

 PDF
PDF Citation
 Print
Print


INTRODUCTION
METHODS
Study subjects
Inclusion and exclusion criteria
Collection of samples and data
Assays of serum indexes enzyme-linked immunosorbent assay
Pancreatitis scoring systems
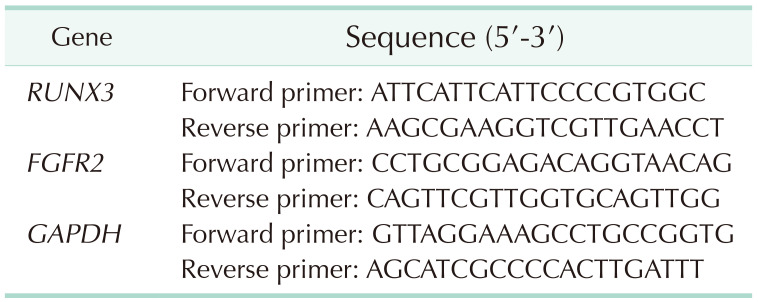
Real-time quantitative PCR
Chromatin immunoprecipitation assay
Data analysis
RESULTS
Clinical data of the included population
Table 2
Clinical baseline characteristics
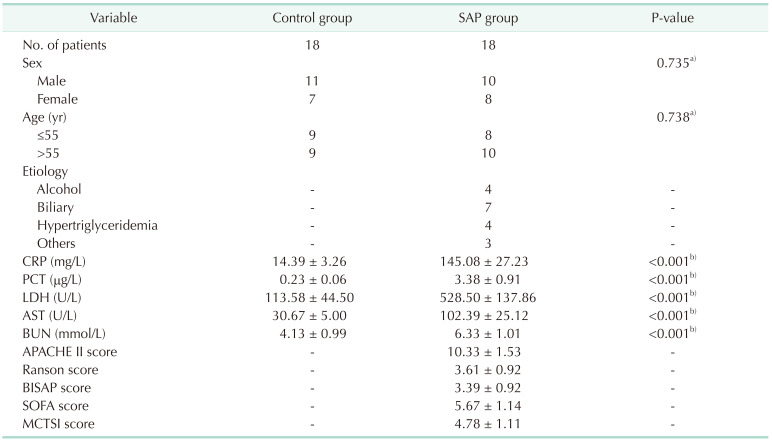
Values are presented as number or mean ± standard deviation.
SAP, severe acute pancreatitis; PCT, procalcitonin; APACHE II, Acute Physiology and Chronic Health Evaluation II; BISAP, Bedside Index for Severity in Acute Pancreatitis; SOFA, sequential organ failure assessment; MCTSI, modified computed tomography severity index.
For data analysis, a)the Fisher test and b)the independent-sample t-test was used.
![]()
RUNX3 is downregulated in peripheral blood of severe acute pancreatitis patients and has high diagnostic values
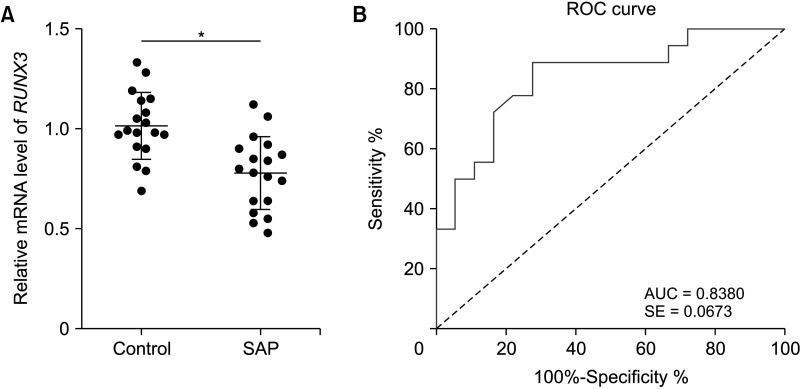 | Fig. 1RUNX3 is downregulated in peripheral blood of SAP patients and has high diagnostic values. (A) RUNX3 levels in peripheral blood of SAP patients and the control group were determined by RT-quantitative PCR. (B) ROC curve based on the diagnostic value of RUNX3 in SAP. Data in panel A were analyzed using the independent-sample t-test. SAP, severe acute pancreatitis; ROC, receiver-operating characteristic; AUC, the area under the curve; SE, standard error.
|
RUNX3 expression is correlated with clinicopathological features of severe acute pancreatitis patients
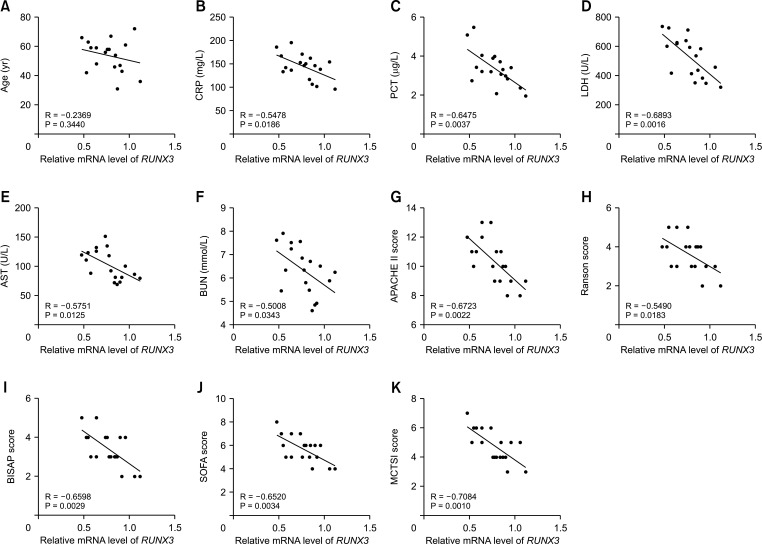 | Fig. 2RUNX3 expression is correlated with clinicopathological characteristics of SAP patients. (A–K) Correlations between RUNX3 expression in peripheral blood and CRP, PCT, LDH, AST, BUN, APACHE II score, Ranson score, BISAP score, SOFA score, and MCTSI score in 18 SAP patients were analyzed using Pearson correlation analysis. SAP, severe acute pancreatitis; PCT, procalcitonin; APACHE II, Acute Physiology and Chronic Health Evaluation II; BISAP, Bedside Index for Severity in Acute Pancreatitis; SOFA, sequential organ failure assessment; MCTSI, modified computed tomography severity index.
|
Table 3
Correlations between RUNX3 expression and clinicopathological characteristics of SAP patients
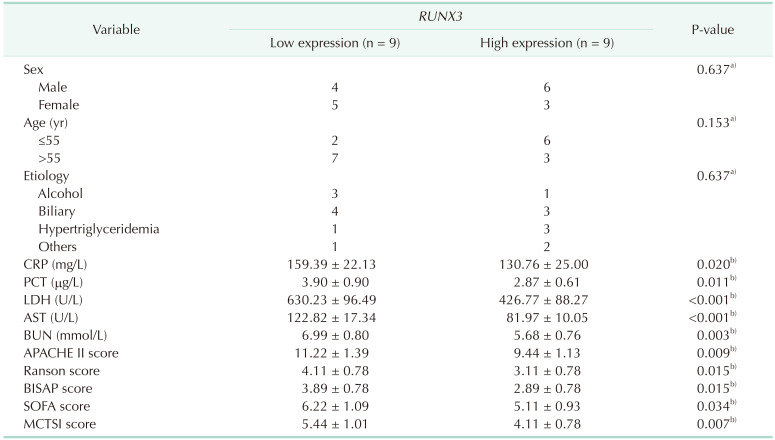
Values are presented as number or mean ± standard deviation.
PCT, procalcitonin; APACHE II, Acute Physiology and Chronic Health Evaluation II; BISAP, Bedside Index for Severity in Acute Pancreatitis; SOFA, sequential organ failure assessment; MCTSI, modified computed tomography severity index.
For data analysis, a)the Fisher test and b)the independent-sample t-test was used.
![]()
FGFR2 is downregulated in peripheral blood of severe acute pancreatitis patients and has high diagnostic values
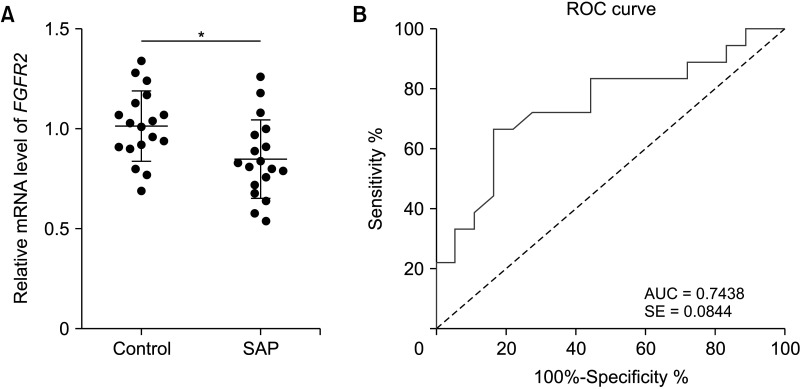 | Fig. 3FGFR2 is downregulated in peripheral blood of SAP patients and has high diagnostic values. (A) FGFR2 levels in peripheral blood of SAP patients and the control group were determined by RT-quantitative PCR. (B) ROC curve based on the diagnostic value of FGFR2 in SAP. Data in panel A were analyzed using the independent-sample t-test. SAP, severe acute pancreatitis; ROC, receiver-operating characteristic; AUC, the area under the curve; SE, standard error. *P < 0.05.
|
FGFR2 expression is correlated with clinicopathological features of severe acute pancreatitis patients
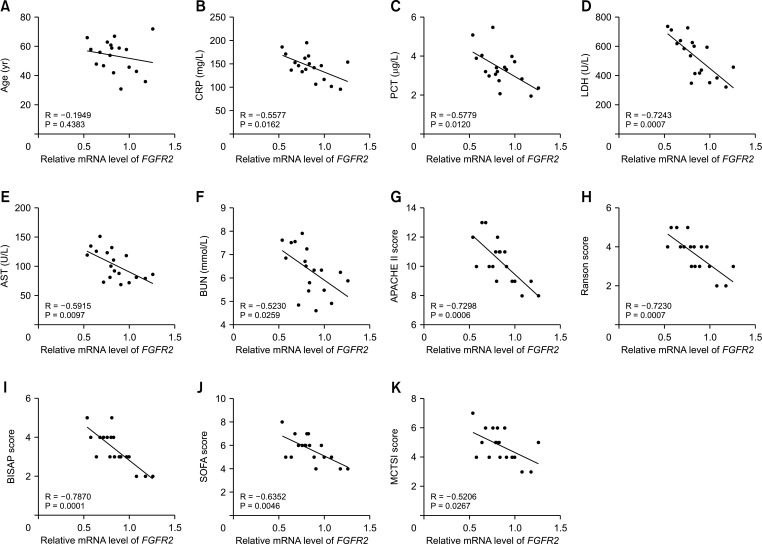 | Fig. 4FGFR2 expression is correlated with clinicopathological characteristics of SAP patients. (A–K) Correlations between FGFR2 expression in peripheral blood and CRP, PCT, LDH, AST, BUN, APACHE II score, Ranson score, BISAP score, SOFA score, and MCTSI score in 18 SAP patients were analyzed using Pearson correlation analysis. SAP, severe acute pancreatitis; PCT, procalcitonin; APACHE II, Acute Physiology and Chronic Health Evaluation II; BISAP, Bedside Index for Severity in Acute Pancreatitis; SOFA, sequential organ failure assessment; MCTSI, modified computed tomography severity index.
|
Table 4
Correlation between FGFR2 expression and clinicopathological characteristics of SAP patients
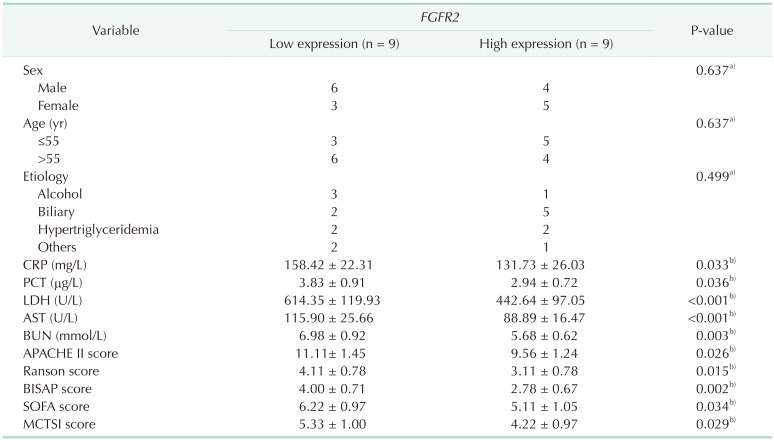
Values are presented as number or mean ± standard deviation.
PCT, procalcitonin; APACHE II, Acute Physiology and Chronic Health Evaluation II; BISAP, Bedside Index for Severity in Acute Pancreatitis; SOFA, sequential organ failure assessment; MCTSI, modified computed tomography severity index.
For data analysis, a)the Fisher test and b)the independent-sample t-test was used.
![]()
RUNX3 expression is positively correlated with FGFR2 expression in peripheral blood of severe acute pancreatitis patients
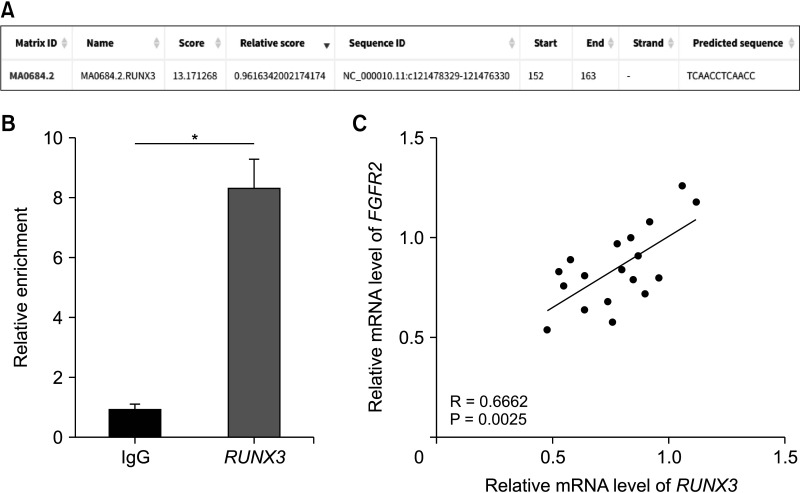 | Fig. 5RUNX3 expression is positively correlated with FGFR2 expression in peripheral blood of SAP patients. (A) The binding of RUNX3 to the FGFR2 promoter was predicted on the JASPAR database (http://jaspar.genereg.net/). (B) The enrichment of RUNX3 on the FGFR2 promoter was analyzed by the ChIP assay. (C) Correlation between RUNX3 expression and FGFR2 expression in peripheral blood of 18 SAP patients was analyzed by Pearson correlation analysis. Cell experiments were performed 3 times independently. Data in panel B were expressed as mean ± standard deviation and analyzed using the t-test. IgG, immunoglobulin G; SAP, severe acute pancreatitis; ChIP, chromatin immunoprecipitation. *P < 0.05.
|
 XML Download