

 PDF
PDF Citation
 Print
Print


INTRODUCTION
Burn injury is a critical trauma illness with high morbidity and mortality. It shows high clinical heterogeneity with a worse prognosis in severely burned patients with various complications such as sepsis, organ failure, and hypermetabolism. Burn has multiple causes of morbidity and mortality that can be masked by the hypermetabolic status and systemic inflammation due to the burn injury. Large longitudinal data sets are available to physicians as big data in the current age. Their analysis could help predict disease progression and mortality [1]. In the clinical field, time-event or time-series data is a key topic in biostatistics applications to medical research. Repeated biomarker measurements provide information on disease progression and individual traits [2]. k-Means clustering is a widely used and efficient algorithm to classify clinical data with little or hidden information into groups. Clustering algorithms by unsupervised methods to identify groups with similar trajectories in heterogamous medical disease entities can provide insight into mechanisms of hidden disease heterogeneity. In this study, we aimed to analyze the routinely collected biomarkers to evaluate the mortality prediction power, find clinical meanings of these or subtypes, and assess patterns of trajectories for various biomarkers.
METHODS
The Institutional Review Board of Hangang Sacred Heart Hospital approved this study (HG 2022-011). Informed consent was waived as this study was retrospective, and there was no intervention.
Study site and patients
This retrospective cohort study was conducted on patients older than 18 years admitted within 2 days after a burn to the burn intensive care unit (BICU) of Hangang Sacred Heart Hospital, Hallym University Medical Center, between July 2012 and June 2021. All eligible patients received fluid resuscitation. Fluid resuscitation refers to administering sufficient fluids to replace fluids lost due to burns and support cardiovascular function in the early phase of burn injury. Complete fluid resuscitation aims to restore and maintain euvolemia (normal fluid volume) and perfusion to vital organs and tissues to prevent or treat burn shock and other complications. Among them, the patients survived at least 7 days to see the pattern of longitudinal laboratory tests were divided into 4 subgroups according to the time: from admission, 1 week, 2 weeks, and 3 weeks to evaluate characteristics of interest (Fig. 1). The criteria for admission to BICU were as follows; (1) partial thickness burn of more than 20% of total body surface area (TBSA) for adults and partial thickness burn of more than 10% of TBSA if the patient was a pediatric or over 65 years of age, (2) inhalation injury, (3) electrical burn, (4) preexisting medical disorder that could incur complications, or affect mortality, and (5) with concomitant trauma, which could elevate the risk of the morbidity or mortality. All patients underwent chest radiography, and routine serum laboratory tests were performed at least every 3–4 days during the intensive care unit (ICU) stay.
Data collection and missing values
Clinical longitudinal data were retrieved from a clinical database warehouse at Hangang Sacred Heart Hospital, Hallym University Medical Center. All variables were collected prospectively from admission to death in the non-survival group and to discharge from BICU in the survival group. When the biomarkers were measured several times a day, we collected the worst value of biomarkers. We recorded the demographic characteristics (age, sex, TBSA, which were calculated using a modified Lund and Browder chart, type of burn, length of BICU stays, and the presence of inhalation injury, which was defined by the history of smoke exposure in a closed space and prolonged extrication, or physical findings such as singed facial hair, carbonaceous deposits in the oropharynx or sputum, facial burns, and voice changes), and routine laboratory test results of 23 biomarkers (complete blood count, electrolytes, routine chemistry, arterial blood gas analysis, creatine kinase [CK], lactate dehydrogenase [LD], and lactate) from the clinical database warehouse. The missing values of these longitudinal variables were imputed using the copyMean method, which is a commonly used method for predicting missing data in longitudinal studies [3]. The missing values were replaced in 2 ways: (1) intermittent: values immediately surrounding the missing are joined by a line; (2) monotone: imputed by the last observation carried forward way, or next observation carried backward. All missing values are described in Supplementary Fig. 1.
Outcomes
The primary outcome was in-hospital 60-day mortality. The severity of injury was reported using the abbreviated burn severity index (ABSI) and the revised Baux (rBaux) index at admission. The newly developed Hangang score [4] in our center, Acute Physiology and Chronic Health Evaluation IV (APACHE IV) score, SOFA scores were calculated daily based on routine laboratory results.
Statistical analysis
Baseline demographic characteristics were reported as follows. Continuous variables distributed normally were presented as means ± standard deviation or distributed nonnormally as medians (interquartile range [IQR]). Depending on normality, the paired t-test or Wilcoxon signed-rank test was used to determine differences between the 2 groups. Categorical variables are presented as percentages and analyzed using the chi-square test or Fisher exact test. The longitudinal biomarkers were clustered into 4 groups by k-means using the R-project program of kmlShape packages (R version 4.2.0; R Foundation for Statistical Computing), an efficient method to cluster longitudinal data according to their shapes. The optimal number of clusters (4) was chosen based on clinical relevance in this study [5]. We conducted logistic regression and Cox survival analysis to evaluate the discrimination performances of mortality prediction. The hazard ratios are presented after adjustment for known predictors of burn mortality such as age, TBSA burned, and inhalation injury. Regarding in-ICU mortality, Harrell’s C-index [6] was used to evaluate the performance of the prediction accuracy of survival models. A P-value of <0.05 (2-sided) was considered statistically significant. All analysis was conducted by using computing statistical R-project program.
RESULTS
Study population
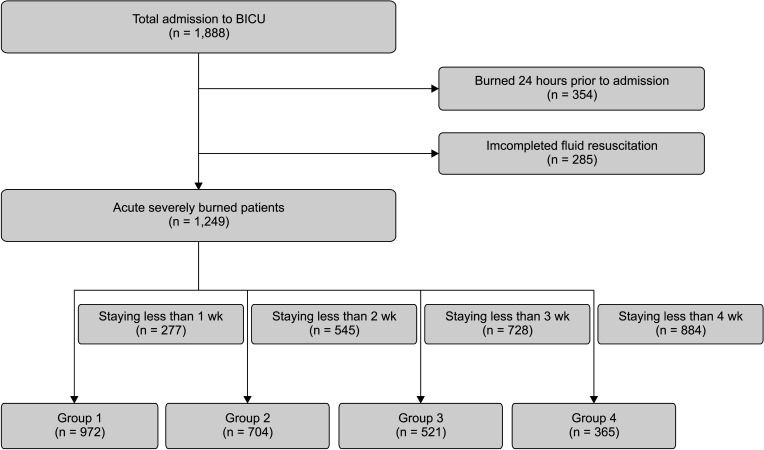
In this study, 1,888 patients admitted to the BICU between July 2012 and June 2021, within 2 days after sustaining a burn injury and receiving fluid resuscitation, were included. Three hundred fifty-four patients who suffered burn injuries within 24 hours before admission and 285 patients who did not undergo complete fluid resuscitation were excluded from the study. The remaining 1,249 eligible patients were divided into 4 groups based on their respective time points. Nine hundred seventy-two patients staying longer than a week were included in group 1,704 patients staying longer than 2 weeks in group 2,521 patients staying longer than 3 weeks in group 3, and 365 patients staying longer than 4 weeks in group 4. Fig. 1 provides a flowchart of the enrolled patients described.
In group 1,292 patients (23.4%) died. The median of overall ages was 51 years (IQR, 41–60 years), with a male predominance of 1,016 (81.3%). The median TBSA was 31%, and inhalation injury was present in 509 (40.8%). The median length of stay in the ICU was 15 (IQR, 7–30) days. The median ABSI, rBaux, Hangang, APACHE IV, and SOFA scores were 8, 91, 133, 37, and 3, respectively. The comorbidities were hypertension in 221 (17.7%), diabetes mellitus in 106 (8.5%), hyperlipidemia in 37 (3.0%), and cardiovascular disease in 26 (2.1%) (Table 1). The demographics for groups 1–4 are summarized in Supplementary Tables 1–4.
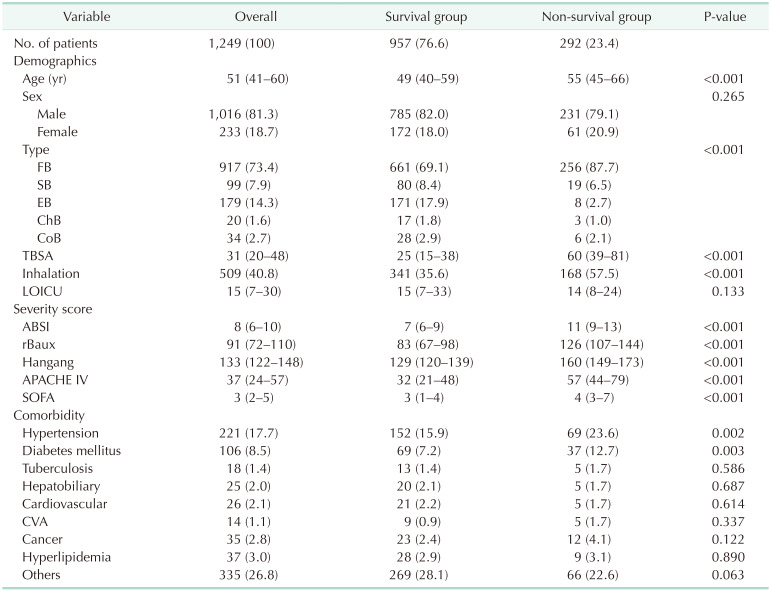
Table 1
Demographics of eligible burn patients
Values are presented as number (%) or median (interquartile range).
FB, flame burn; SB, scald burn; EB, electrical burn; ChB, chemical burn; CoB, contact burn; TBSA, total body surface area burned %; LOICU, length of stay in intensive care unit; ABSI, abbreviated burn severity index; rBaux, revised Baux index; APACHE, acute physiology and chronic health evaluation; SOFA, sequential organ failure assessment; CVA, cerebrovascular accident.
![]()
Prediction performance
We evaluated a total of 23 biomarkers checked at least every 4 days. These were as follows: WBC count, hematocrit, platelet, RDW, neutrophil, lymphocyte, BUN, creatinine, AST, ALT, total bilirubin, direct bilirubin, albumin, glucose, CK, LD, pH, pCO2, pO2, bicarbonate, lactate, sodium, and potassium. Among them, we reported 5 biomarkers showing high-performance power. Mean Harrell’s C-index of pH during the study period was the highest with 0.816, platelets were the 2nd with 0.807, creatinine with 0.796, RDW with 0. 778, and lactate with 0.759 in order.
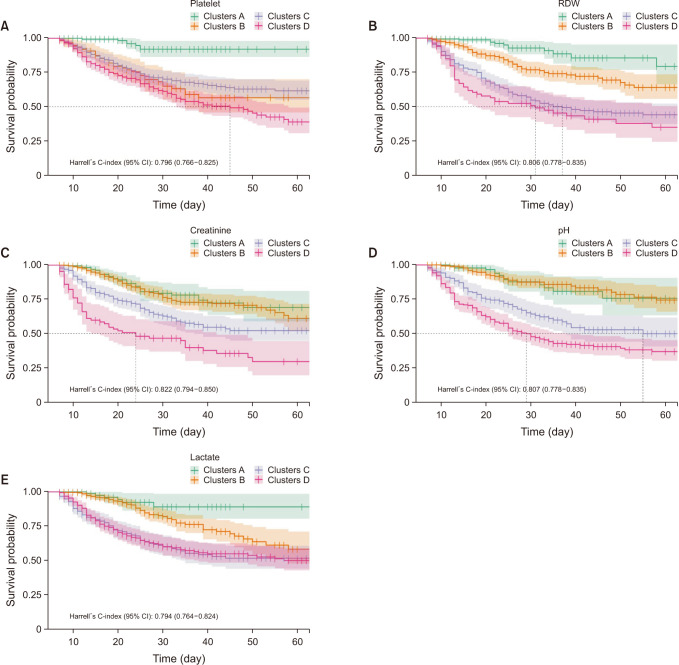
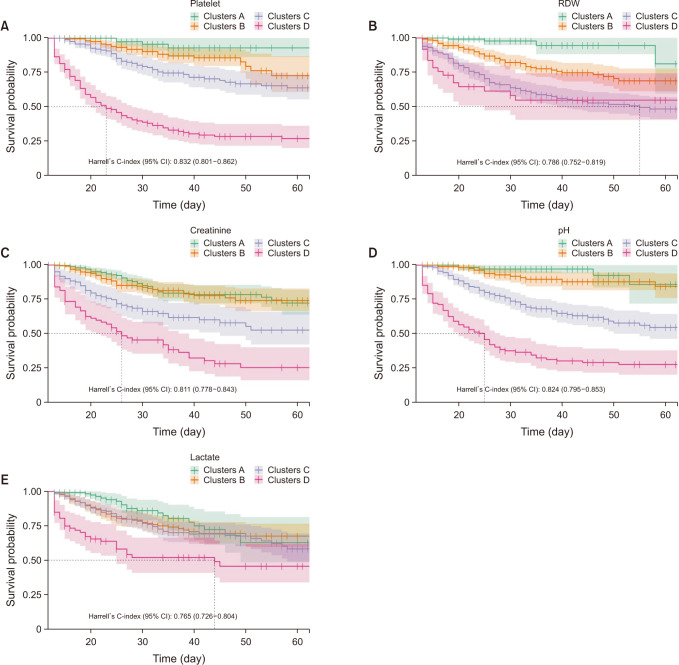
In Harrell’s C-index (95% confidence interval) in group 1, creatinine was 0.822 (0.794–0.850), RDW was 0.806 (0.778–0.835), and pH was 0.807 (0.778–0.835) in order (Fig. 2). In group 2, platelet was the highest with 0.832 (0.801–0.862), pH was next with 0.824 (0.795–0.853), and creatinine was 0.811 (0.778–0.843) (Fig. 3). In Harrell’s C-index for group 3, pH was 0.817 (0.773–0.861), platelet was 0.793 (0.750–0.835), and creatinine was 0.774 (0.723–0.825) (Supplementary Fig. 2). In group 4, pH was the highest with 0.816 (0.757–0.874), platelet was 0.809 (0.751–0.867), and creatinine was 0.777 (0.714–0.840) in order (Supplementary Fig. 3). The Harrell’s C-index of lactate was lower than other biomarkers, 0.794 (0.764–0.824) in group 1, 0.765 (0.726–0.804) in group 2, 0.735 (0.679–0.791) in group 3, and 0.742 (0.674–0.810) in group 4.
Longitudinal profile
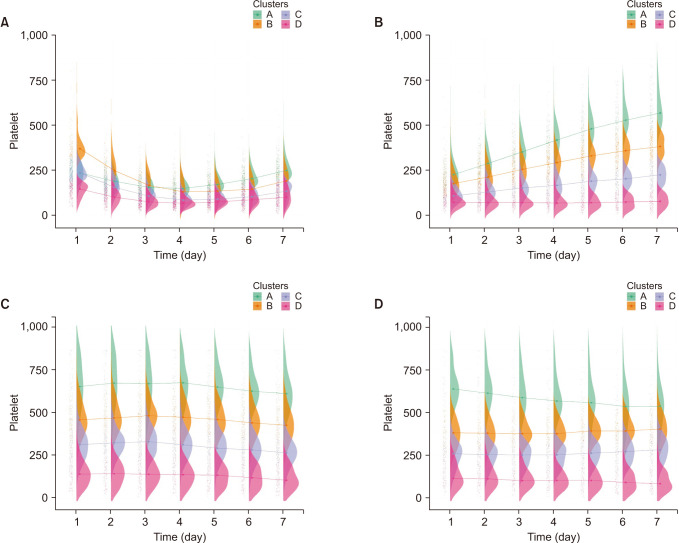
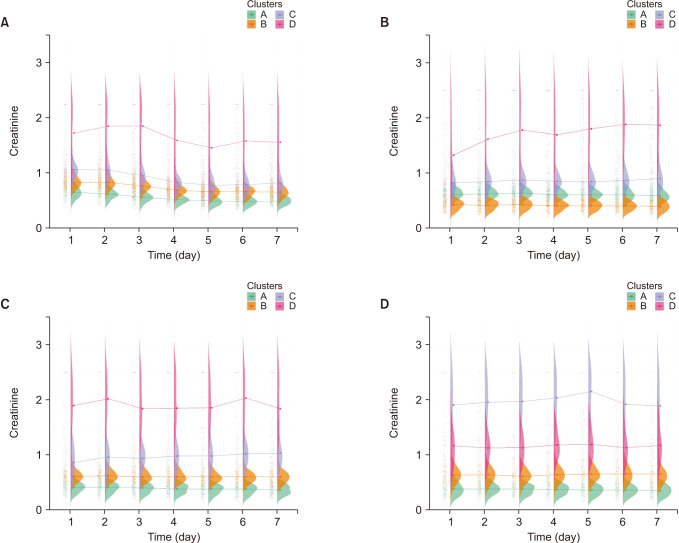
We divided each laboratory test into 4 clusters, A through D, according to the shape pattern assigned by kmlSahpe packages using k-means clustering and rearranged according to the mortality rate of each cluster. In pH, longitudinal profiles are a bit different according to the group. For example, in group 1, clusters C and D crossed between days 2 and 3 and showed a flat pattern in groups 2, 3, and 4 (Fig. 4). For platelets, longitudinal profiles showed different patterns between groups and even with other biomarkers. Platelets also showed a cross between days 3 and 4 in group 1, and platelet values reflect similar ebb/flow phases and showed increasing trends in group 2 (Fig. 5). In creatinine, flat patterns were shown in all groups, with no cross line. Cluster D, with the highest RDW level, had the highest mortality rate except for group 4 (Fig. 6). RDW also showed a cross between days 1 and 3 in group 1, and flat patterns were shown in other groups, with no cross line (Supplementary Fig. 4). The raincloud plot for lactate showed a cross in group 1 and liner pattern were shown in other groups (Supplementary Fig. 5). The mortality rate for all clusters of each biomarker is shown in Supplementary Tables 5–9.
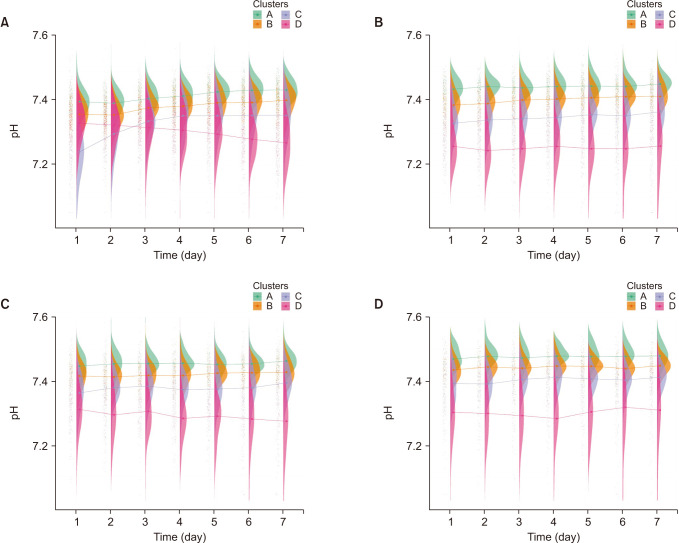
Fig. 4
The raincloud plot of pH for each clusters. (A) Group 1, (B) group 2, (C) group 3, and (D) group 4.
![]()
DISCUSSION
We found overall pH, platelet, lactate, and RDW showed higher performances in mortality prediction. However, they showed different longitudinal profiles. Platelets and lactate showed various changing patterns according to the condition or situation of patients, such as the ebb/flow phase. These markers seem sensitive to patient conditions. However, creatinine and RDW showed relatively consistent patterns regardless of each group. We assume that creatinine and RDW reflect hidden/unknown mechanisms more than phenotype/clinical manifestations. Physicians need to evaluate these biomarkers under the mechanism of why these phenomena were developed.
Platelets are activated with spontaneous aggregation in burns. However, the mechanism of platelet dysfunction is unclear. Regardless, this dysfunction makes a burn victim vulnerable to infection, prevents wound healing, and is associated with coagulopathy [7]. Platelet count trajectories reported that longitudinal changes were strongly associated with mortality in burns [8]. The mean overall C-index was as high as 0.807, a bit lower than the report that showed 0.848 at admission when combined with the rBaux score, 0.779 on day 3 combined with TBSA [9]. However, these were combined with the rBaux score and TBSA, respectively [9].
RDW is a predictor associated with mortality in critical illness patients and higher in non-survival burn patients group and different time trends [10]. RDW also has the potential power of predicting morbidity, mortality of infectious disease, and sepsis [11]. Few studies have reported on the predictive power for mortality in burn patients. In this study, the cluster with higher RDW level presented higher mortality rates, and the RDW exhibits a flat pattern rather than an ascending or descending slope pattern; this pattern was different compared to other markers. We assume that RDW is more independent of the patient's condition, whether the patient's condition is hypermetabolic or inflammatory.
Creatinine is commonly used to assess glomerular filtration and renal function in critically ill patients, and high creatinine levels are associated with increased morbidity and mortality [12]. In this study, creatinine had a C-index of 0.796 because creatinine is known as a predictor of acute kidney injury (AKI), which is the main complication of burn injury and develops in at least 25% of patients with severe burns [13]. Therefore, the management of AKI is one of the mainstays of burn management. The causes of AKI in burn patients are different and classified into early and late AKI according to the point of AKI development [14]. Early AKI is attributed to fluid resuscitation volumes and the degree of burn shock. In contrast, late AKI is caused by sepsis, nephrotoxic agents, and multiorgan failure [1516]. Therefore, biomarkers should be considered according to their mechanism. Thus, longitudinal profiles in this study could be different according to the developed mechanisms of AKI.
Lactate is known as a marker of cellular hypoxia and shock. Its correlation with mortality due to burns has been reported [17]. Lower pH and elevated lactate levels have a strong association with mortality. In early burn stages, these markers can be attributed to local or general tissue hypoperfusion induced by burn shock or over-hydration during fluid resuscitation [18]. These markers are also known as predictors of sepsis, which undoubtedly developed in severely burned patients. Therefore, it is necessary to look at these markers with this mechanism of disease progression in mind, and this difference leads to a change in the longitudinal profile.
To the best of our knowledge, this study is the first to use longitudinal data categorized using k-means clustering algorithms. This means we could find heterogeneity without human selection bias using the most extensive dataset available to us. Despite being a widely used and effective algorithm for data clustering, the k-means method has limitations. One significant limitation is determining the optimal number of clusters, which is a longstanding and complex problem in statistical analysis. There are various approaches to addressing this issue, including parametric, nonparametric, and approaches based on minimizing the number of clusters. Clinical relevance has also been proposed as a criterion for selecting the optimal number of clusters [5]. In this study, the authors chose the optimal number of clusters to be 4 based on clinical relevance. The missing rate of missing lactate values in this study was substantial, ranging from 40% to 50%. Therefore, we employed the copyMean method for imputing the missing values; this is a widely used technique for predicting missing data in longitudinal studies. It is important to consider the high rate of missing values when interpreting the findings of this study. Additionally, as this study was conducted at a single center in 1 country, there is a potential for geographical bias that should be taken into consideration by the authors. Consequently, these findings cannot be generalized to other populations. In the future, our study design could help validate similar studies in various other institutions. Additionally, we divided into 4 groups according to time periods, which can lead to survivorship bias. However, this study assessed various biomarkers’ trajectories over time. The pathophysiology and treatment of burns evolve over time, and encompass fluid resuscitation, hypermetabolic phases, and possible complications such as AKI, sepsis, and acute respiratory distress syndrome. Therefore, the cohort was divided into 4 groups to find specific patterns of biomarkers.
We used longitudinal clinical data and unsupervised clustering algorithms to evaluate routinely collected biomarkers using k-means clustering to find insights into hidden mechanisms. Platelet, RDW, lactate, creatinine, and pH were some of the main predictors reported in other studies, but we found that they showed different longitudinal profiles. Creatinine and RDW showed even patterns, while the other markers showed different patterns according to the patients’ situations. These markers can provide clues into the underlying mechanism and help predict mortality, but the predictors that should be closely monitored may vary over time. The pH consistently demonstrated a high C-index, while creatinine and platelets displayed opposite effects. These results suggest that physicians can infer potential underlying medical conditions and focus on identifying hidden diseases. Creatinine and RDW exhibited consistent patterns, indicating that in situations where other biomarkers showed significant fluctuations, these markers may be useful for predicting mortality.
 XML Download