

 PDF
PDF Citation
 Print
Print


Introduction
Certainly, the kidneys are essential filters for toxic substances and crucial re-absorber for vital minerals and vitamins into the bloodstream. Consequently, kidney diseases and injuries are one of the common leading causes of mortality worldwide [1]. Thioacetamide (TAA), is an organosulfur compound that is commonly used in fungicides, pesticides, rubber chemicals, curing agents, cross linking agents and in metallurgy [2-4]. TAA is a nephrotoxic substance that is widely used in experimental models of renal toxicity [5, 6]. It was reported that TAA is rapidly metabolized to TAA-S-oxide and reactive oxygen species [7]. These reactive metabolites are implicated in the pathogenesis of renal damage as the kidneys are more vulnerable to damage than other organs [8]. Cellular infiltrations, cell death and aggregates of macrophages and neutrophils were observed which suggested fibrosis with further exposure [9]. Detection of the changes induced by exposure to chemicals is vital to identify the appropriate countermeasures that decreases its serious health effects and prevents organ damage [9]. Wherefore, great attention has been paid to prevent and treat acute and chronic renal damages that are caused by such products [10]. Many recent studies described the protective effects of different compounds on the nephrotoxicity induced by TAA. Resveratrol reversed the oxidative stress state and reduced the inflammatory markers that were raised by TAA exposure in the kidney [2]. Treatment with propolis significantly protected against the increased serum urea, and creatinine, and the decreased serum potassium which was induced by TAA [10]. Administration of Schisandrin B corrected all the TAA-induced disturbances in serum parameters and apoptotic markers [11]. Moreover, the histopathological and biochemical alterations induced by TAA were prevented by Nerolidol [12] and Wheat Germ Oil [1]. In addition, it was reported that hepatitis C virus (HCV) infection is associated with increased morbidity, and mortality in patients due to renal dysfunction [13]. Eradication of HCV is a crucial step especially in patients with renal disorders which might improve their prognosis [14]. Sofosbuvir (SFV) is a direct acting antiviral (DAA) with broad activity which has been approved for the treatment of HCV [15], Zika virus [16] and Dengue [17]. SFV acts through inhibition of NS5B polymerase, while Daclatasvir (DAC) acts by inhibiting NS5A replication complex [18, 19]. DAC has been approved as a new DAA agent to be combined with other drugs for treatment of chronic HCV patients [20]. Evidence from recent studies valued the efficiency of SFV and DAC combination in treatment of HCV (approved) [14, 21, 22], as well as the potential effect (not yet approved) against corona virus disease 19 [23-25]. Also, Co-treatment with SFV and DAC combination restored the normal liver structure and function after TAA induction of liver damage [26]. However, the use of DAAs for treatment of patients with severe renal impairment is still challenging and not yet approved [27] although, many reports revealed good tolerance and unimportant adverse effects for their use in these patients [14]. And TAA exposure can lead to centrilobular death and liver cirrhosis which mimic the pathology induced by HCV [26]. Based on these findings, it was hypothesized that the use of DAAs might improve the renal dysfunction associated with TAA exposure or HCV liver affection. While, unfortunately, it was not feasible to produce an animal model with hepatorenal insult due to infection with HCV. Consequently, the current study focused on the assessment of the TAA induced nephrotoxicity in rat model and the identification of the ameliorative role of SFV and DAC supplementation.
Go to : 
Materials and Methods
Drugs and chemicals
All the chemicals, TAA, SFV and DAC were purchased as powders from Sigma Chemical Co (St. Louis, MO, USA). Saline was used to dissolve the drugs to be administered intraperitoneally (TAA) or by gavage (SFV and DAC). SFV dose was 41.1 mg/kg equivalent to 6.7 mg/kg per day in human; also, DAC was given at a dose of 6.2 mg/kg which was calculated to be equivalent to 1 mg/kg per day in human. Both doses were adjusted according to the equation of [28]. The dose of TAA was calculated as 200 mg/kg body weight on the base of the previous study [12].
Animals and experimental design
Forty-eight adult male albino rats (8: 10 weeks old and of 180: 220 gram weight) were obtained from the animal house of Zagazig Scientific and Medical Research Center (ZSMRC) and were used in this experiment. All the rats were breaded in groups of six in clean properly ventilated standard plastic cages in a 12 hours light/12 hours dark cycle and constant room temperature (21°C–22°C). Rats in all cages were given free access to rat standard laboratory diet and water ad libitum and allowed one week for acclimatization before the experiment.
The study followed the guidelines of the Institutional Animal Care and Use Committee (IACUC) in Zagazig University, Egypt and approved by it under the number (ZU-IACUC/3/F/189/2022). These guidelines comply with the EU Directive 2010/63/EU for animal experiments. The rats were divided randomly into eight groups of six animals per group. Drugs, doses, routes, and frequency of treatment are shown in Table 1. After eight weeks of continuous dosing, all the rats were sacrificed by cardiac puncture after being anesthetized using intraperitoneal injection of thiopental Na 30 mg\kg. The blood samples were centrifuged at 4,000 rpm for 15 minutes and then the blood was allowed to clot for 2 hours at room temperature. The separated serum was then pipetted into clean storage Eppendorf and stored at –20°C for further biochemical analysis. Laparotomy was done and both kidneys were extracted and sectioned. Tissue samples from both kidneys were fixed in 10% neutral buffered formalin for histological analysis. The rest of the two kidneys of each animal were kept in phosphate-buffered saline (PBS) for biochemical analysis.
Table 1
Doses, routes, and frequency of dosing in different experimental groups
![]()
Table 2
Means±SE for different experimental groups and detailed results of ANOVA test
![]()
Microscopic analysis
Histological staining
Tissue samples from the kidneys of each animal in each group were fixed in 10% neutral-buffered formalin for 24 hours then dehydrated in ascending grades of ethanol and inserted in paraffin blocks. 4–5 µm thickness serial sections were cut and mounted. Some slides were stained with hematoxylin and eosin and others were stained with Masson’s Trichrome to evaluate the collagen fibers [29]. Two independent observers performed the histopathological evaluation blindly.
Immunohistochemistry
Sections of 4–5 µm thickness were processed for immunohistochemistry as described by [30]. Briefly, the sections were deparaffinized, rehydrated, and rinsed in tap water. Then the slides were embedded in 3% hydrogen peroxide for 10 minutes, immersed in antigen retrieval solution and later blocking of nonspecific protein binding was done by incubation in 10% normal goat serum in PBS for 1 hours at room temperature. The slides were incubated with the diluted primary antibody against α- smooth muscle actin (Rabbit Polyclonal antibody, Cat: RB-9010-P0; Lab-Vision, Fremont, CA, USA) at dilution of 1:200 for 2 hours to identify mesangial cell proliferation in paraffin sections.
Image analysis and morphometry
Leica DM500, (German) photomicroscope was used to examine and photograph the stained sections. Image analysis and morphometry were performed using the free ImageJ software (Version 1.41; National Institutes of Health, Bethesda, MD, USA). Firstly, the images were calibrated by measuring a known distance on the image then the calibration was globalized to obtain the accurate measurements provided that all the images were taken at the same scale. Proximal convoluted tubule and distal convoluted tubule diameters were measured in Hematoxylin and Eosin-stained sections by drawing a straight line between the outer margins of the tubules using the line Selection tool. As some tubules appeared oval in cross section, two diameters were picked per tubule (length and width) and then the means were calculated. Capillary tuft area in Hematoxylin and Eosin-stained sections was evaluated using the segmented line selection tool. The line was drawn in the capsular space (CS) along the outer margin of the capillary tuft then the area was calculated by the software. Collagen area in Masson’s Trichrome stained sections and the area of expression of anti α- smooth muscle actin was assessed using automatic color selection tool after adjusting the suitable color threshold. The actual area of the tissue was measured by subtracting the empty spaces from the total area of the image. The mean area percentage was calculated according to Shalaby et al. [31] by dividing the area of the selected color on the actual area of tissue after excluding the background.
Biochemical analysis
Quantitative colorimetric end point assessment method of serum urea was performed using Biomed diagnostics kits (BioMed Diagnostics, Cairo, Egypt) as described by Anderson and Bhagavan. and according to the manufacturer guidelines [32]. Also serum creatinine level was determined by colorimetric method according to Tietz [33]. Total protein and albumin were measured following the method of Ruot et al. [34]. PBS kept kidney samples were homogenized in ice-cold 0.1 M Tris-HCl buffer at pH 7.4. Centrifugation of the homogenate at 3,000 rpm for 15 minutes at 4°C was done and the resultant supernatant was isolated for detection of Malondialdehyde (MDA) and Reduced glutathione (GSH) levels [35]. The pellets were extracted and stored at −20°C [36]. Briefly, the supernatants were diluted with distilled water then exposed to acid hydrolysis by 1,1,3,3-tetramethoxypropane solution. Only, 1 ml of the hydrolyzed solution was mixed with 99 ml 0.1 mol/l HCl. Then, 0.5 ml of EDTA and 2.5 ml of 0.8% BHT were added to the sample and centrifuged at 4°C and 3,500 rpm for 5 minutes. The supernatant was removed, and the sample was filtered and transferred to 10 ml tube and completed with 10% TCA. Finally, 4 ml of the solution were mixed with 1 ml of TBA, closed with aluminum foil and incubated in a water bath at 70°C for 90 minutes. After cooling, the samples were measured opposite to the blank, the calibration curve was set, and MDA was quantified. To assess tissue GSH, the supernatants were deproteinized with an equal volume of 10% 5-sulfosalicylic acid containing 0.2 mM EDTA. The solution was then centrifuged at 10,000 g for 15 minutes and the supernatants were mixed with reaction mixture according to the manufacturer instructions. After 5 minutes, the mixture was acidified with 0.05 ml 7 M H 3PO 4 and injected into the HPLC system. Superoxide dismutase (SOD) enzyme activity was measured following the method described by [37]. Spectrophotometric assay of SOD was performed using 50 mM air-saturated 2-amino-2-methyl-1,3-propanediol buffer containing 3 mM boric acid and 0.1 mM diethylenetriaminepentaacetic acid at pH 8.8 and temperature 37°C. One minute kinetic measurement was performed after adding BXT-01050. The level of tumor necrosis factor-α (TNF-α) was measured by ELISA kits and according to the manufacturer’s instructions. In brief, a 96-well microplate was coated with polyclonal antibody specific to TNF-α and then the samples and the standards were added. Several rounds of washing were performed before and after addition of Avidin-conjugated horseradish peroxidase to remove excess unbound solutions. The reaction was terminated by adding sulfuric acid after development of enzyme color and the color change was measured at 450 nm. Each sample was duplicated, and the level was assessed by comparing the optical density of samples [2].
Statistical analysis
All the data were analyzed by GraphPad Prism 5 software (GraphPad Software, San Diego, CA, USA). Statistical differences between the mean values of experimental groups were determined by one-way ANOVA followed by Bonferroni's post hoc test for multiple comparisons. Data were checked by D’Agostino & Pearson omnibus normality test before analysis and showed normal distribution. The groups that showed no significant difference with the control (SFV, DAC and SFV+DAC treated) were excluded from the analysis. Results were presented as means±standard error of the mean (SEM). The differences were considered statistically significant when P-value<0.05.
Go to :
Results
Histological examination and morphometry
Kidney samples from the first four groups (control, SFV, DAC and SFV+DAC treated) appeared microscopically more or less the same with normal architecture of the kidney. Presentation of photos was limited to the control group in Fig. 1A to avoid repetition. In these groups, tissue specimens showed healthy glomeruli containing a lobulated tuft of glomerular capillaries, surrounded by a double-walled epithelial glomerular capsule (Bowman capsule). Between the two capsular layers is the capsular space. Morphometrically, the mean area of the capillary tuft±SEM was 1020.60±21.210 µm2. The proximal convoluted tubules (PCT) are lined by simple cuboidal epithelium with lumens often occluded with mean diameter±SEM of 37.75±1.174. Moreover, the distal convoluted tubules (DCT) are lined by simple cuboidal epithelial cells smaller than that in PCT with empty lumens (mean diameter±SEM of 53.57±1.097). On the other hand, the kidneys of the fifth group (TAA treated) estimated marked distortion and loss of the normal kidney architecture. The glomerular capillary tuft appeared hypertrophied in most of glomeruli with occlusion of the CS and significant increase in the mean capillary tuft area±SEM (1301.50±33.580) than the control group (P<0.0001). Other glomeruli expressed marked degeneration and atrophy of the glomerular capillary tuft with capacious CS (not included in the morphometry). The tubules were distorted with either loss of the smooth inner lining or shedding of the lining cells and accumulation of casts inside the lumen. The remaining tubular cells appeared pyknotic as shown in Fig. 1B and C. There were significant differences in both PCT and DCT diameters when compared to the control with P<0.0001 for both (Mean±SEM=50.78±1.954 and 73.80±1.287 for PCT and DCT respectively). The sixth and seventh groups (TAA+SFV and TAA+DAC treated groups) nearly appeared similar with no significant difference between them but with clear moderate degree of improvement when compared to the TAA treated group. There was apparent normalization in the size of glomerular capillary tuft which rendered the CS to nearly the normal size. The glomerular capillary tuft area of TAA+SFV group Mean±SEM was 1131.64±21.690 which showed high significant difference from the TAA treated group (P<0.0001) but still also significantly different from the control group (P=0.0026). Also, the tubules appeared mostly empty with no casts however some tubules still had signs of necrosis and shedding of their lining as shown in Fig. 1D and E. There were significant differences in the diameters of PCT and DCT when compared to TAA treated group with P=0.0211 and 0.0003. The means±SEM of the PCT and DCT diameters were 44.13±1.665 and 64.52±1.486 respectively in TAA+SFV group. Comparing these diameters with the control group showed also significant differences (P=0.0074 and <0.0001 for PCT and DCT in order). The last group (TAA+SFV+DAC treated) showed the highest degree of improvement regarding the size of CS when compared to TAA treated group. The mean±SEM of the glomerular capillary tuft area was 1118.27±25.060 with high significant difference between this group and the TAA treated group (P<0.0001). Moreover, there was very mild significant difference in the capillary tuft area when compared to the control group P=0.0103. As well as most of the tubules appeared normal with simple cuboidal epithelial lining. However, few tubules still showed fine destruction, casts and pyknotic nuclei as shown in Fig. 1F. The mean±SEM of the PCT and DCT were 43.31±1.118 and 57.26±0.232. This showed high significant difference when compared with the TAA treated group with P=0.0063 and <0.0001 for PCT and DCT respectively. When compared with the control group there were still significant difference in the diameters of PCT and DCT (P=0.0018 and 0.0331).
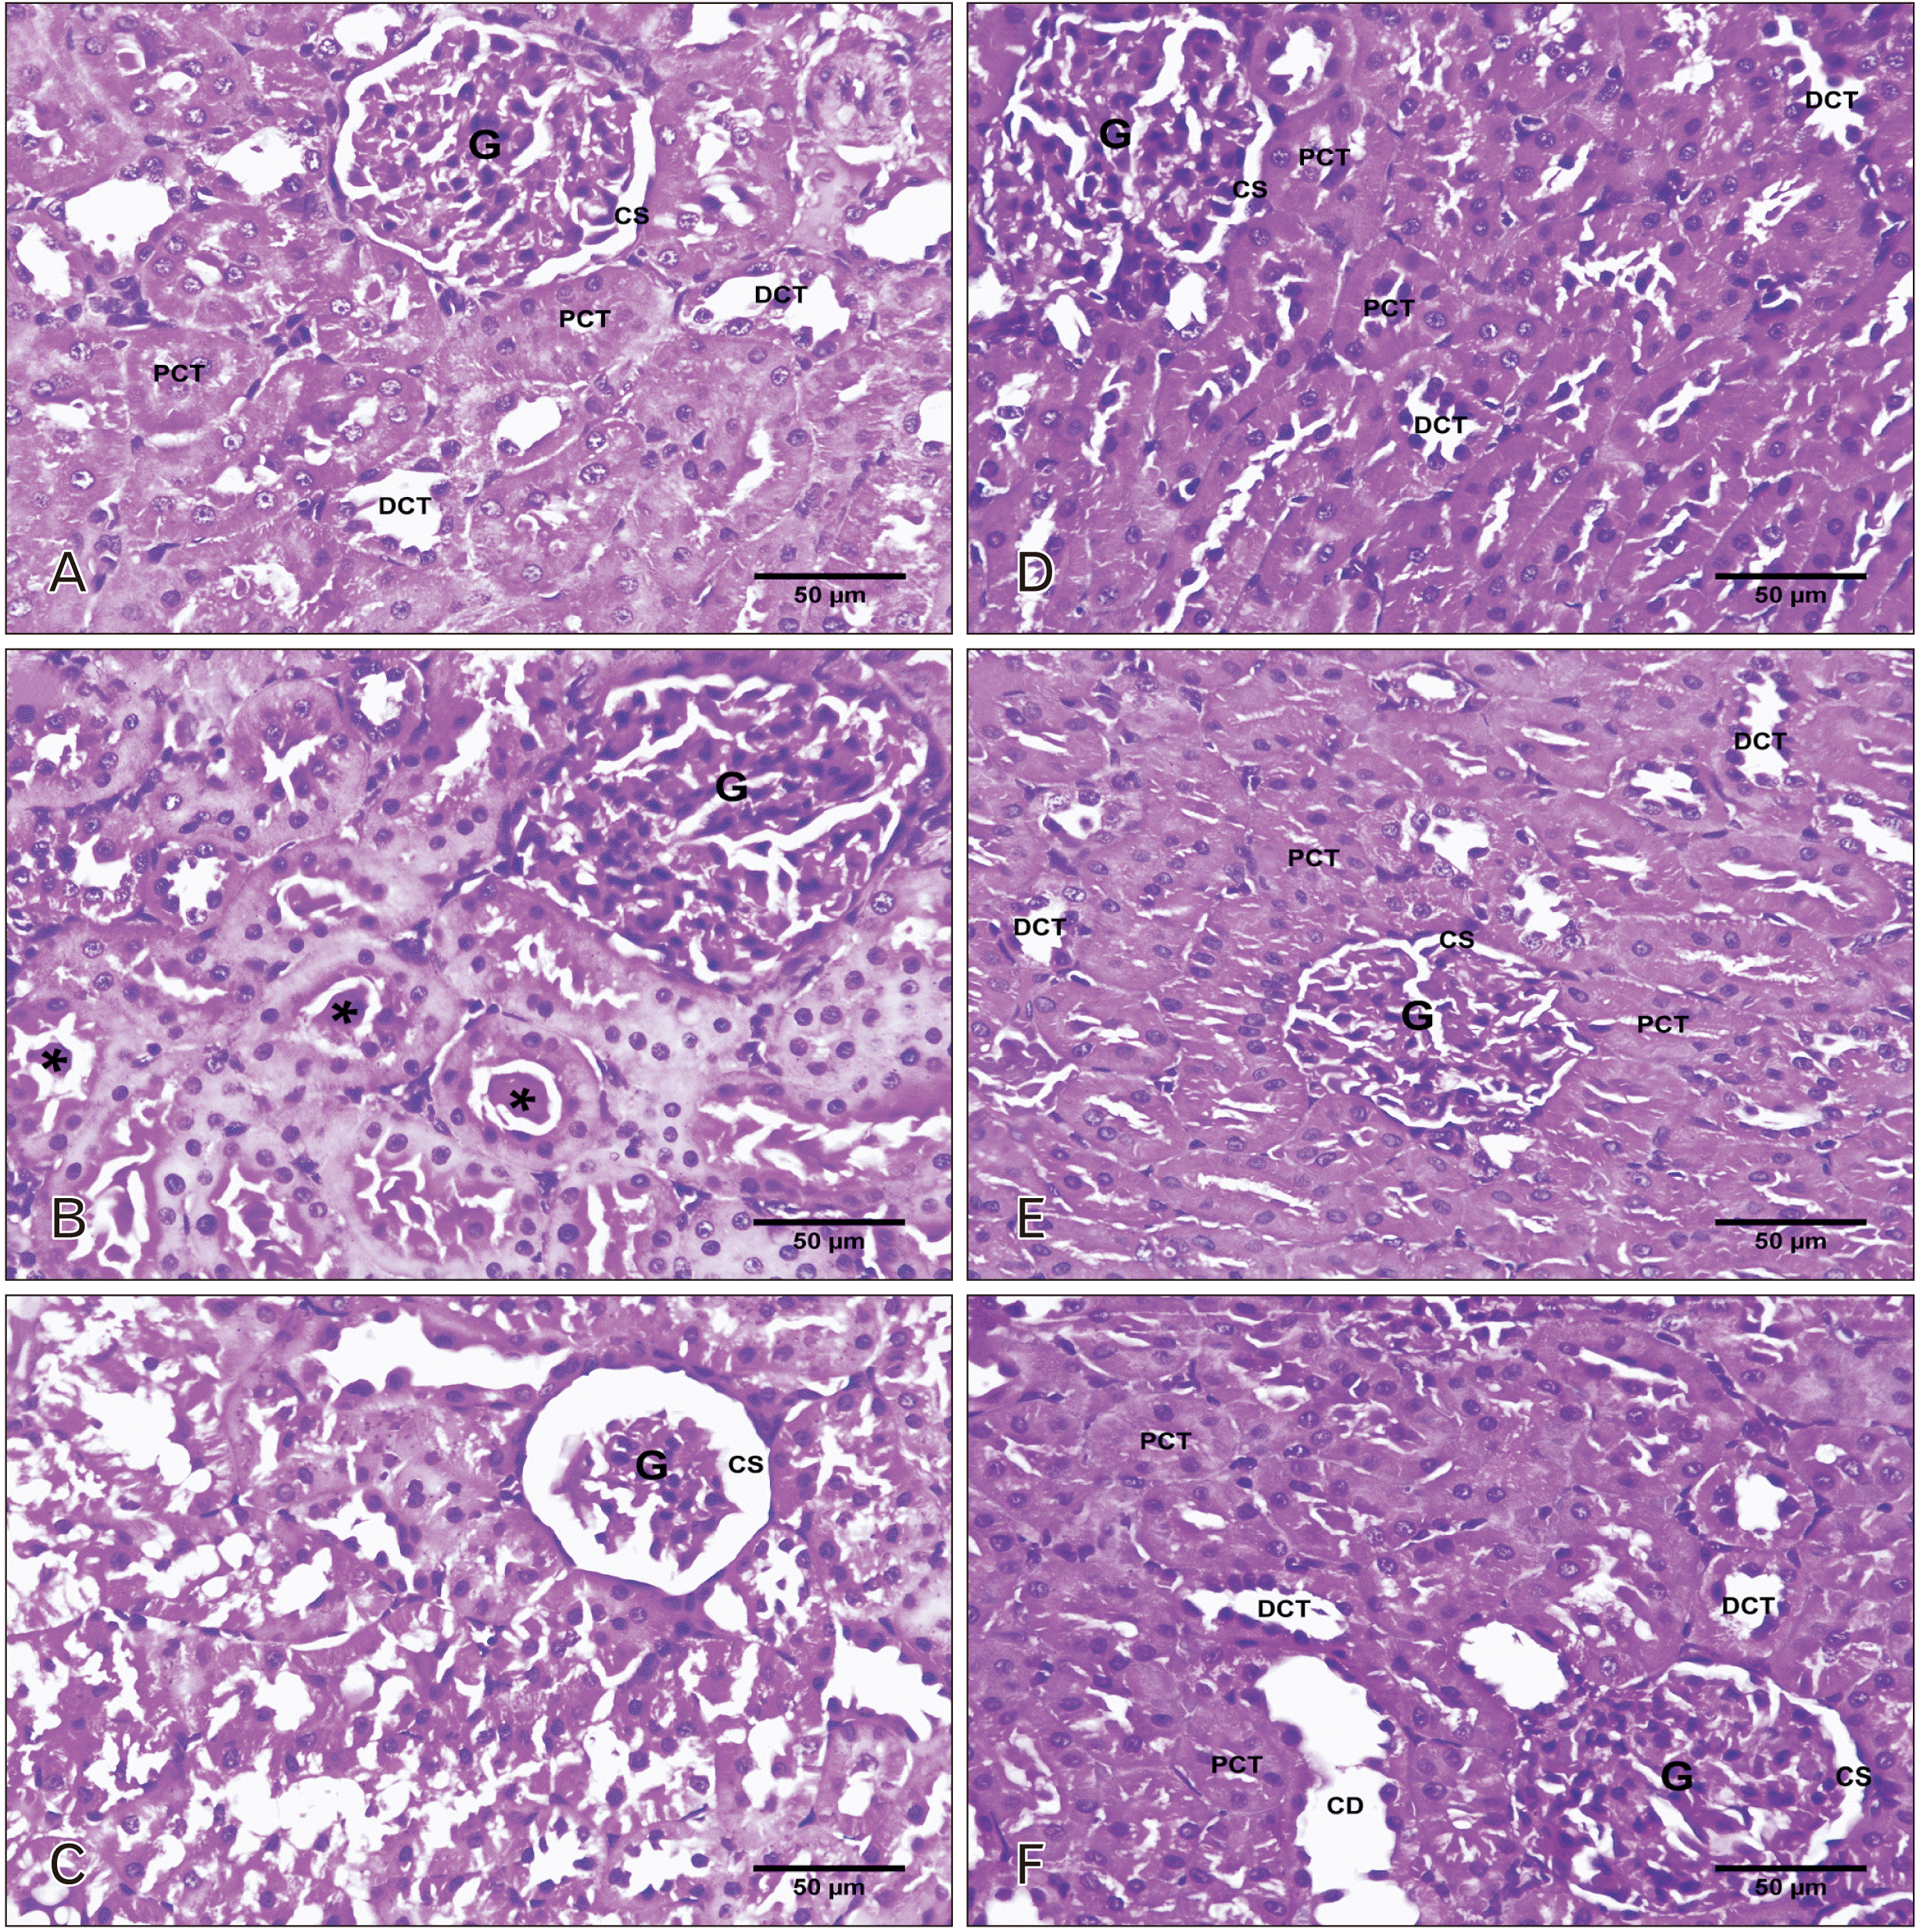 | Fig. 1Representative photomicrographs of kidney sections stained with H&E. (A) Control group showing the healthy G, CS, PCT, and DCT. (B, C) TAA treated group showing hypertrophy of some G and atrophy of the G with widening of CS and markedly destroyed tubules with other showing casts inside them (*). (D, E) TAA+SFV and TAA+DAC treated groups in order showing mild improvement in kidney architecture. (F) TAA+SFV+DAC treated group with marked improvement in kidney architecture (×400). Scale bar in A–F=50 μm. CS, capsular space; G, glomeruli; PCT, proximal convoluted tubules; DCT, distal convoluted tubules; TAA, thioacetamide; SFV, sofosbuvir; DAC, daclatasvir; CD, collecting duct.
|
Masson’s trichrome and morphometry
Statistical analysis of the results of collagen area percent revealed no significant difference between the first four groups (control, SFV, DAC and SFV+DAC treated groups). The control group showed average amount of collage distributed in the kidney tissue as shown in Fig. 2A with mean area percentage±SEM of 5.00±0.232. TAA treated group showed marked increase in collagen deposition juxtamedullary (Fig. 2B) with mean area percentage±SEM of 12.54±0.550. By post hoc test, there was significant difference in the collagen area percentage in TAA treated group when compared to the control group (P<0.0001). Supplementation with either SFV or DAC resulted in similar mild improvement in collagen deposition (Fig. 2C, D) which was confirmed by analyzing the measured area percentage in both groups and revealed no significant difference between them (mean±SEM 9.34±0.273 for TAA+Dac treated group). Comparison with the TAA treated group as well as with the control group showed high significant difference with P<0.0001 in the two conditions. SFV+DAC combination led to more improvement in collagen deposition induced by TAA as shown in Fig. 2E. Morphometry and statistics elaborated significant difference in the area percentage of collagen between the last group (TAA+SFV+DAC) with mean±SEM of 8.01±0.291 and either TAA treated or the control groups (P<0.0001 in both comparisons).
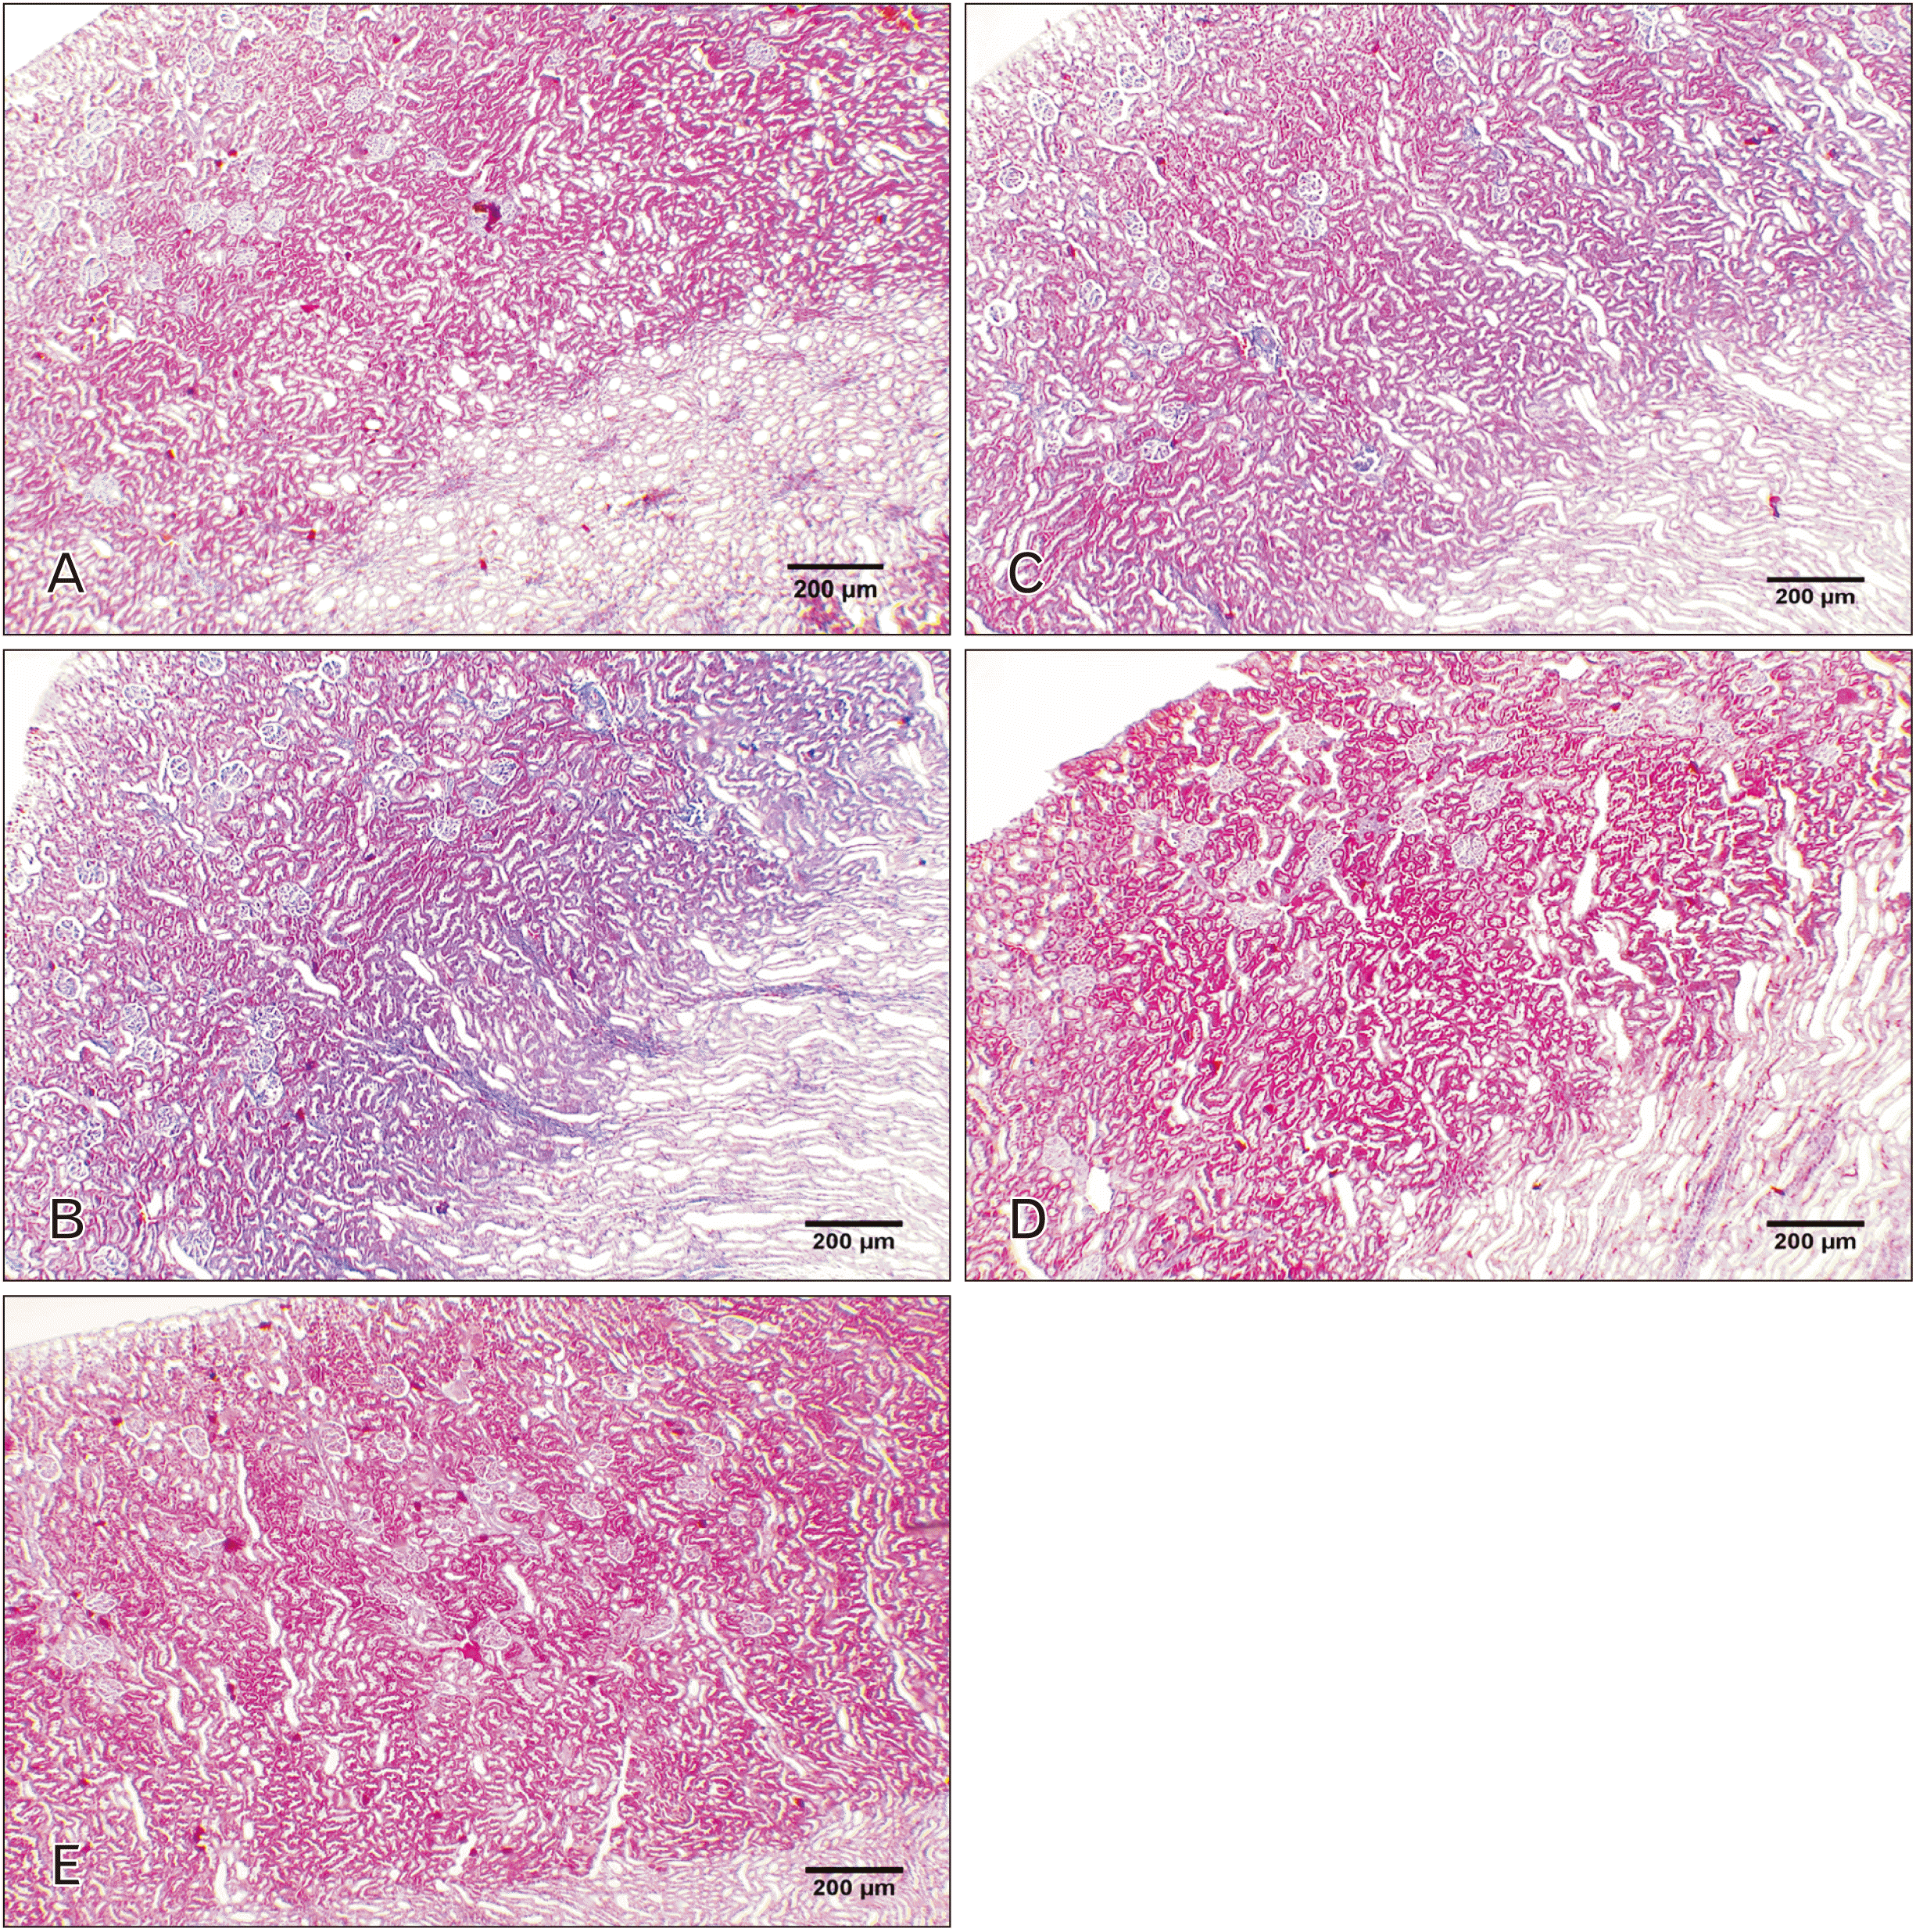 | Fig. 2Representative photomicrographs of kidney sections stained with Masson’s Trichrome. (A) Control group showing the normal distribution of collagen fiber in the cortex and medulla. (B) TAA treated group showing marked increase in collagen fiber deposition in the cortex and medulla. (C, D) TAA+SFV and TAA+DAC treated groups in order showing mild decrease in collagen fiber deposition. (E) TAA+SFV+DAC treated group with marked reduction in collagen fiber deposition (×40). Scale bar in A-E=200 μm. TAA, thioacetamide; SFV, sofosbuvir; DAC, daclatasvir.
|
Immunohistochemistry and morphometry
Examination of the slides labelled with anti α-smooth muscle actin showed very limited expression within the glomerular capillary tuft in the control group as presented in Fig. 3A. There were no microscopic visual differences in the expression as well as the area percentage of expression between the control (mean±SEM 0.05±0.006), SFV, DAC, and SFV+DAC groups. On the other hand, TAA treated group (Fig. 3B) estimated marked increase in the expression of α- smooth muscle actin in the glomeruli and in between the tubules. There was significant difference in the area percentage of expression (mean±SEM 0.47±0.029) when compared to the control with P<0.0001. TAA+SFV and TAA+DAC treated groups showed moderate level of expression in the glomeruli as well as in between the tubules (Fig. 3C, D) with no significant difference in between them concerning the area percentage of expression. Comparison to TAA treated group revealed significant difference with P=0.0007 and 0.0019 for both groups in order. When they were compared to the control group there was high significant difference (mean±SEM 0.33±0.019 for TAA+SFV treated group and P<0.0001). α-smooth muscle actin expression in the last group (TAA+SFV+DAC) was less prominent especially between the tubules as shown in Fig. 3E. The mean±SEM of the expression area percentage was 0.22±0.010 that showed statistically significant difference when compared to TAA treated group and the control group (P<0.0001 for both). Morphometrical values for all experimental groups are shown in Fig. 4.
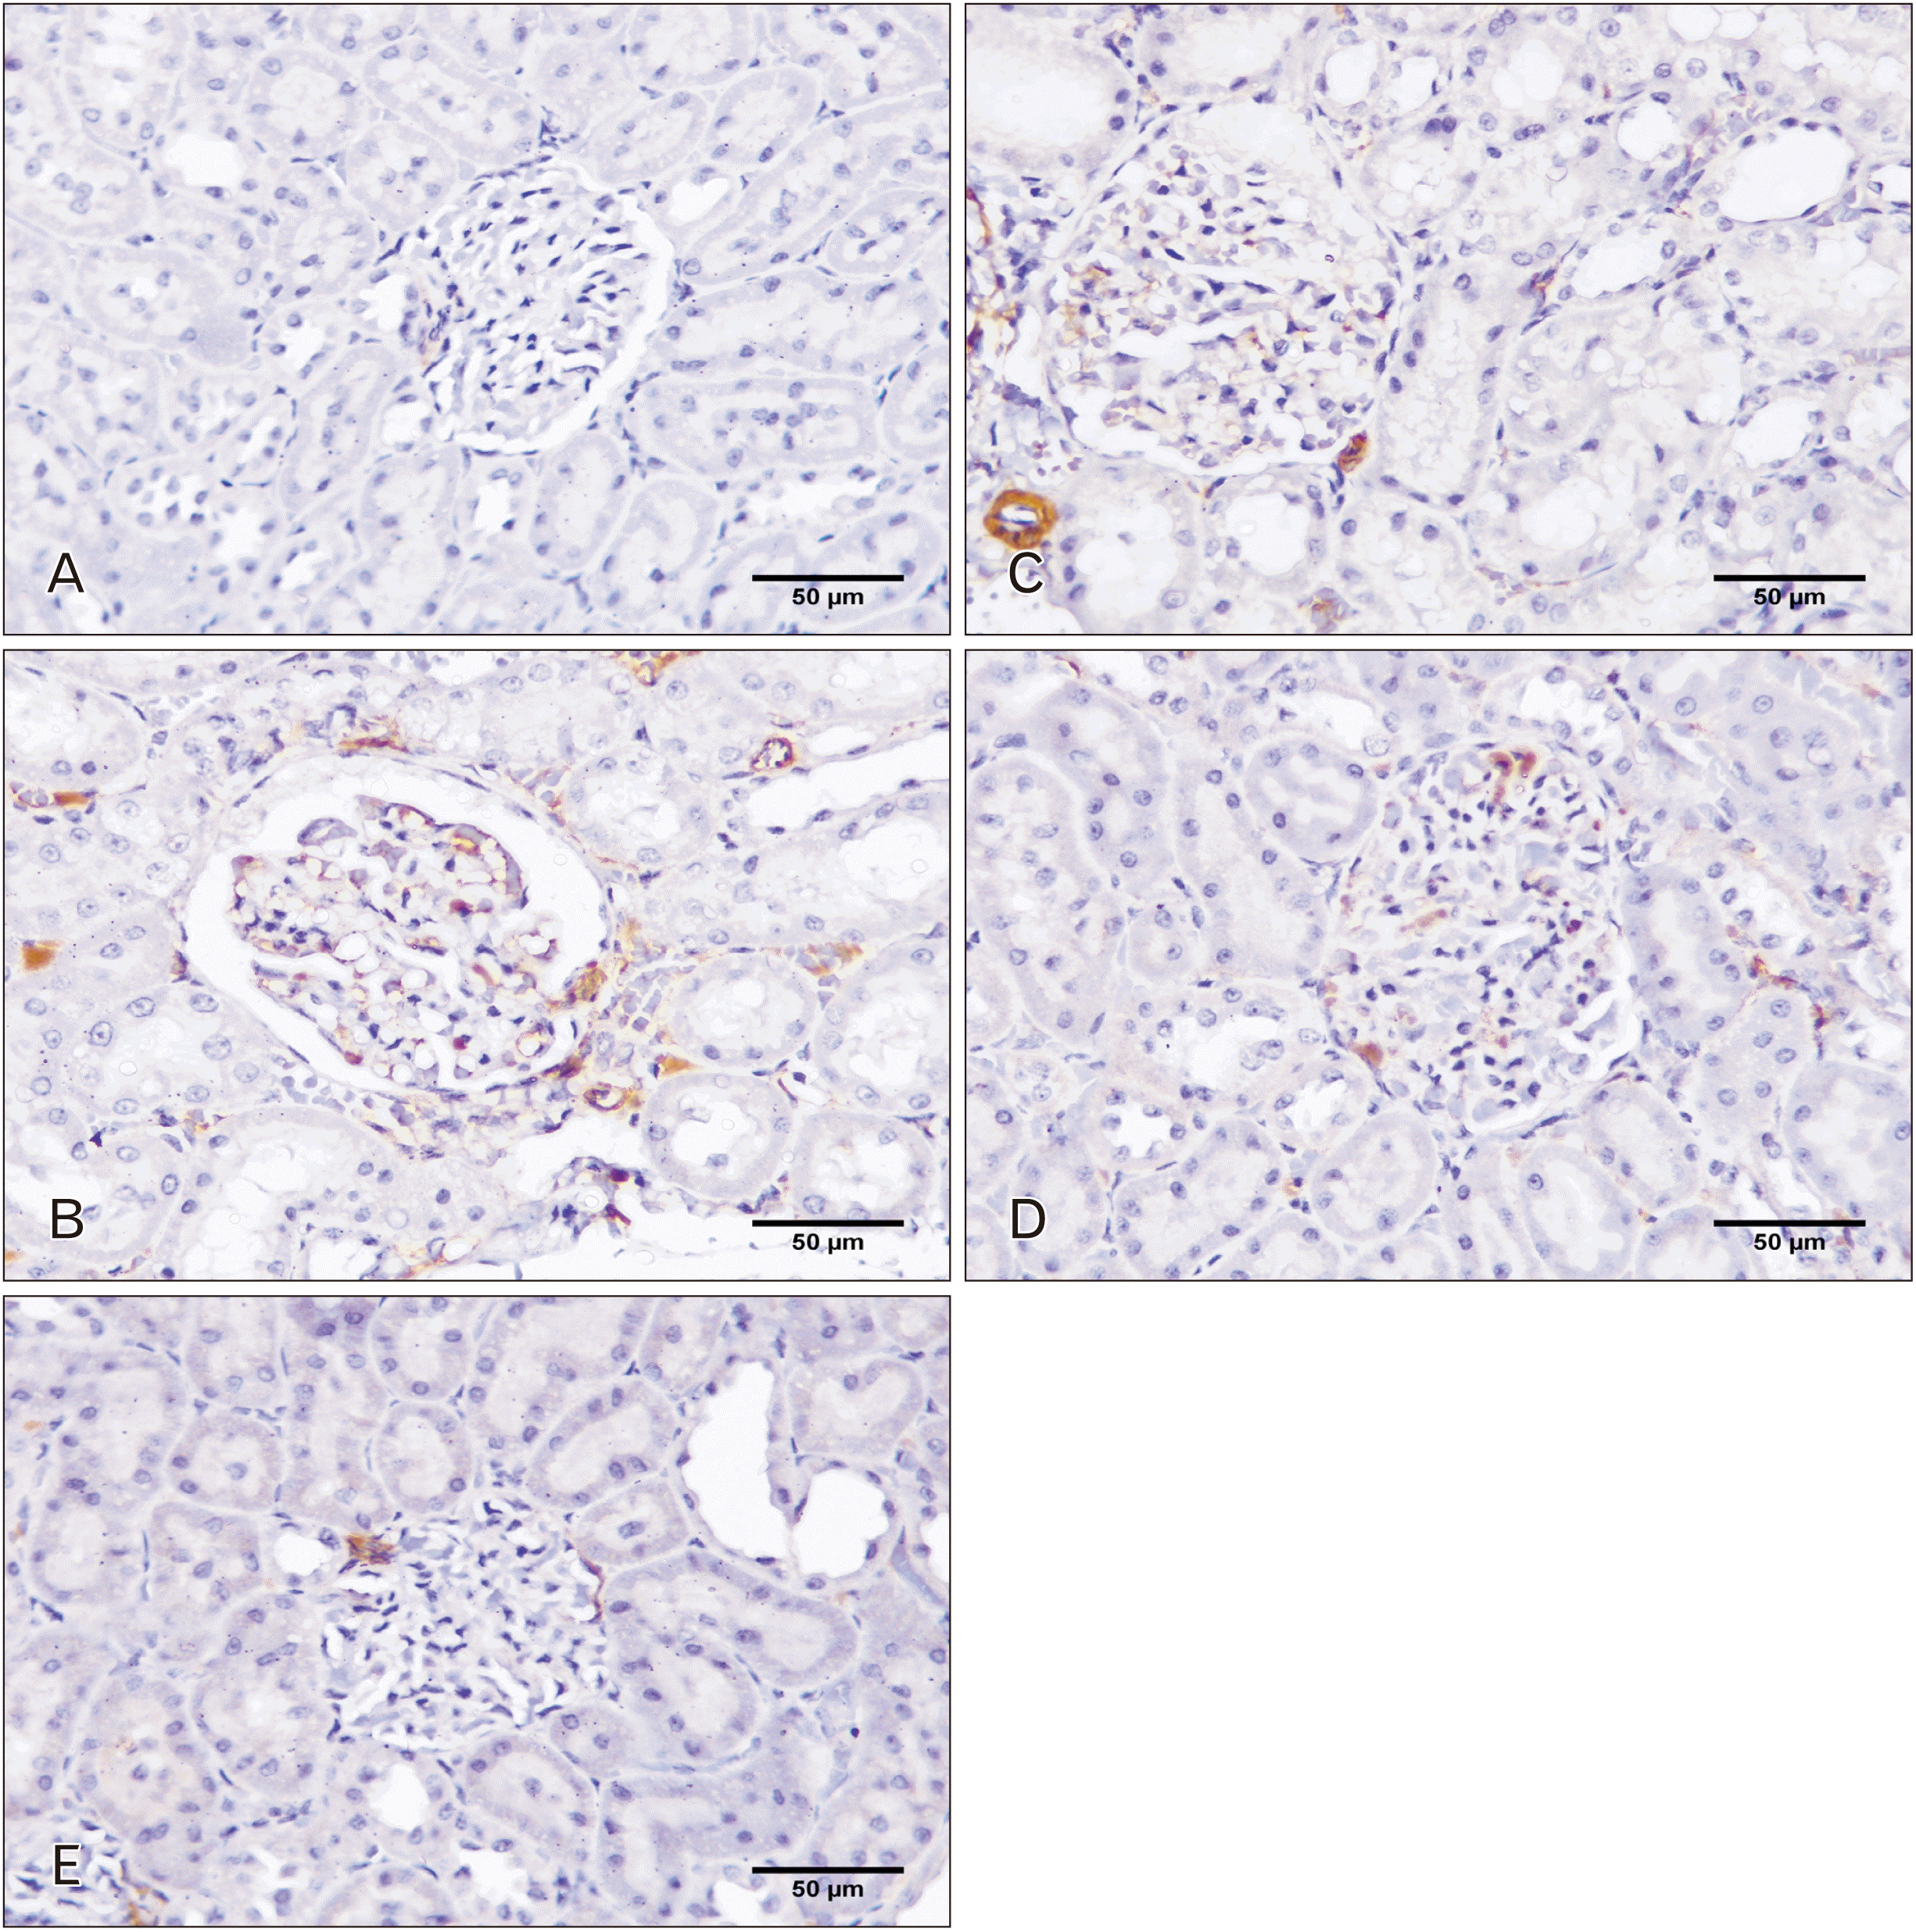 | Fig. 3Representative photomicrographs of kidney sections labelled with α-smooth muscle actin. (A) Control group showing the average normal expression in the glomeruli. (B) TAA treated group showing wide expression of α-smooth muscle actin within the glomeruli and in-between tubules. (C, D) TAA+SFV and TAA+DAC treated groups in order showing mild reduction in the expression. (E) TAA+SFV+DAC treated group with marked restriction in expression (×400). Scale bar in A–E=50 μm. TAA, thioacetamide; SFV, sofosbuvir; DAC, daclatasvir.
|
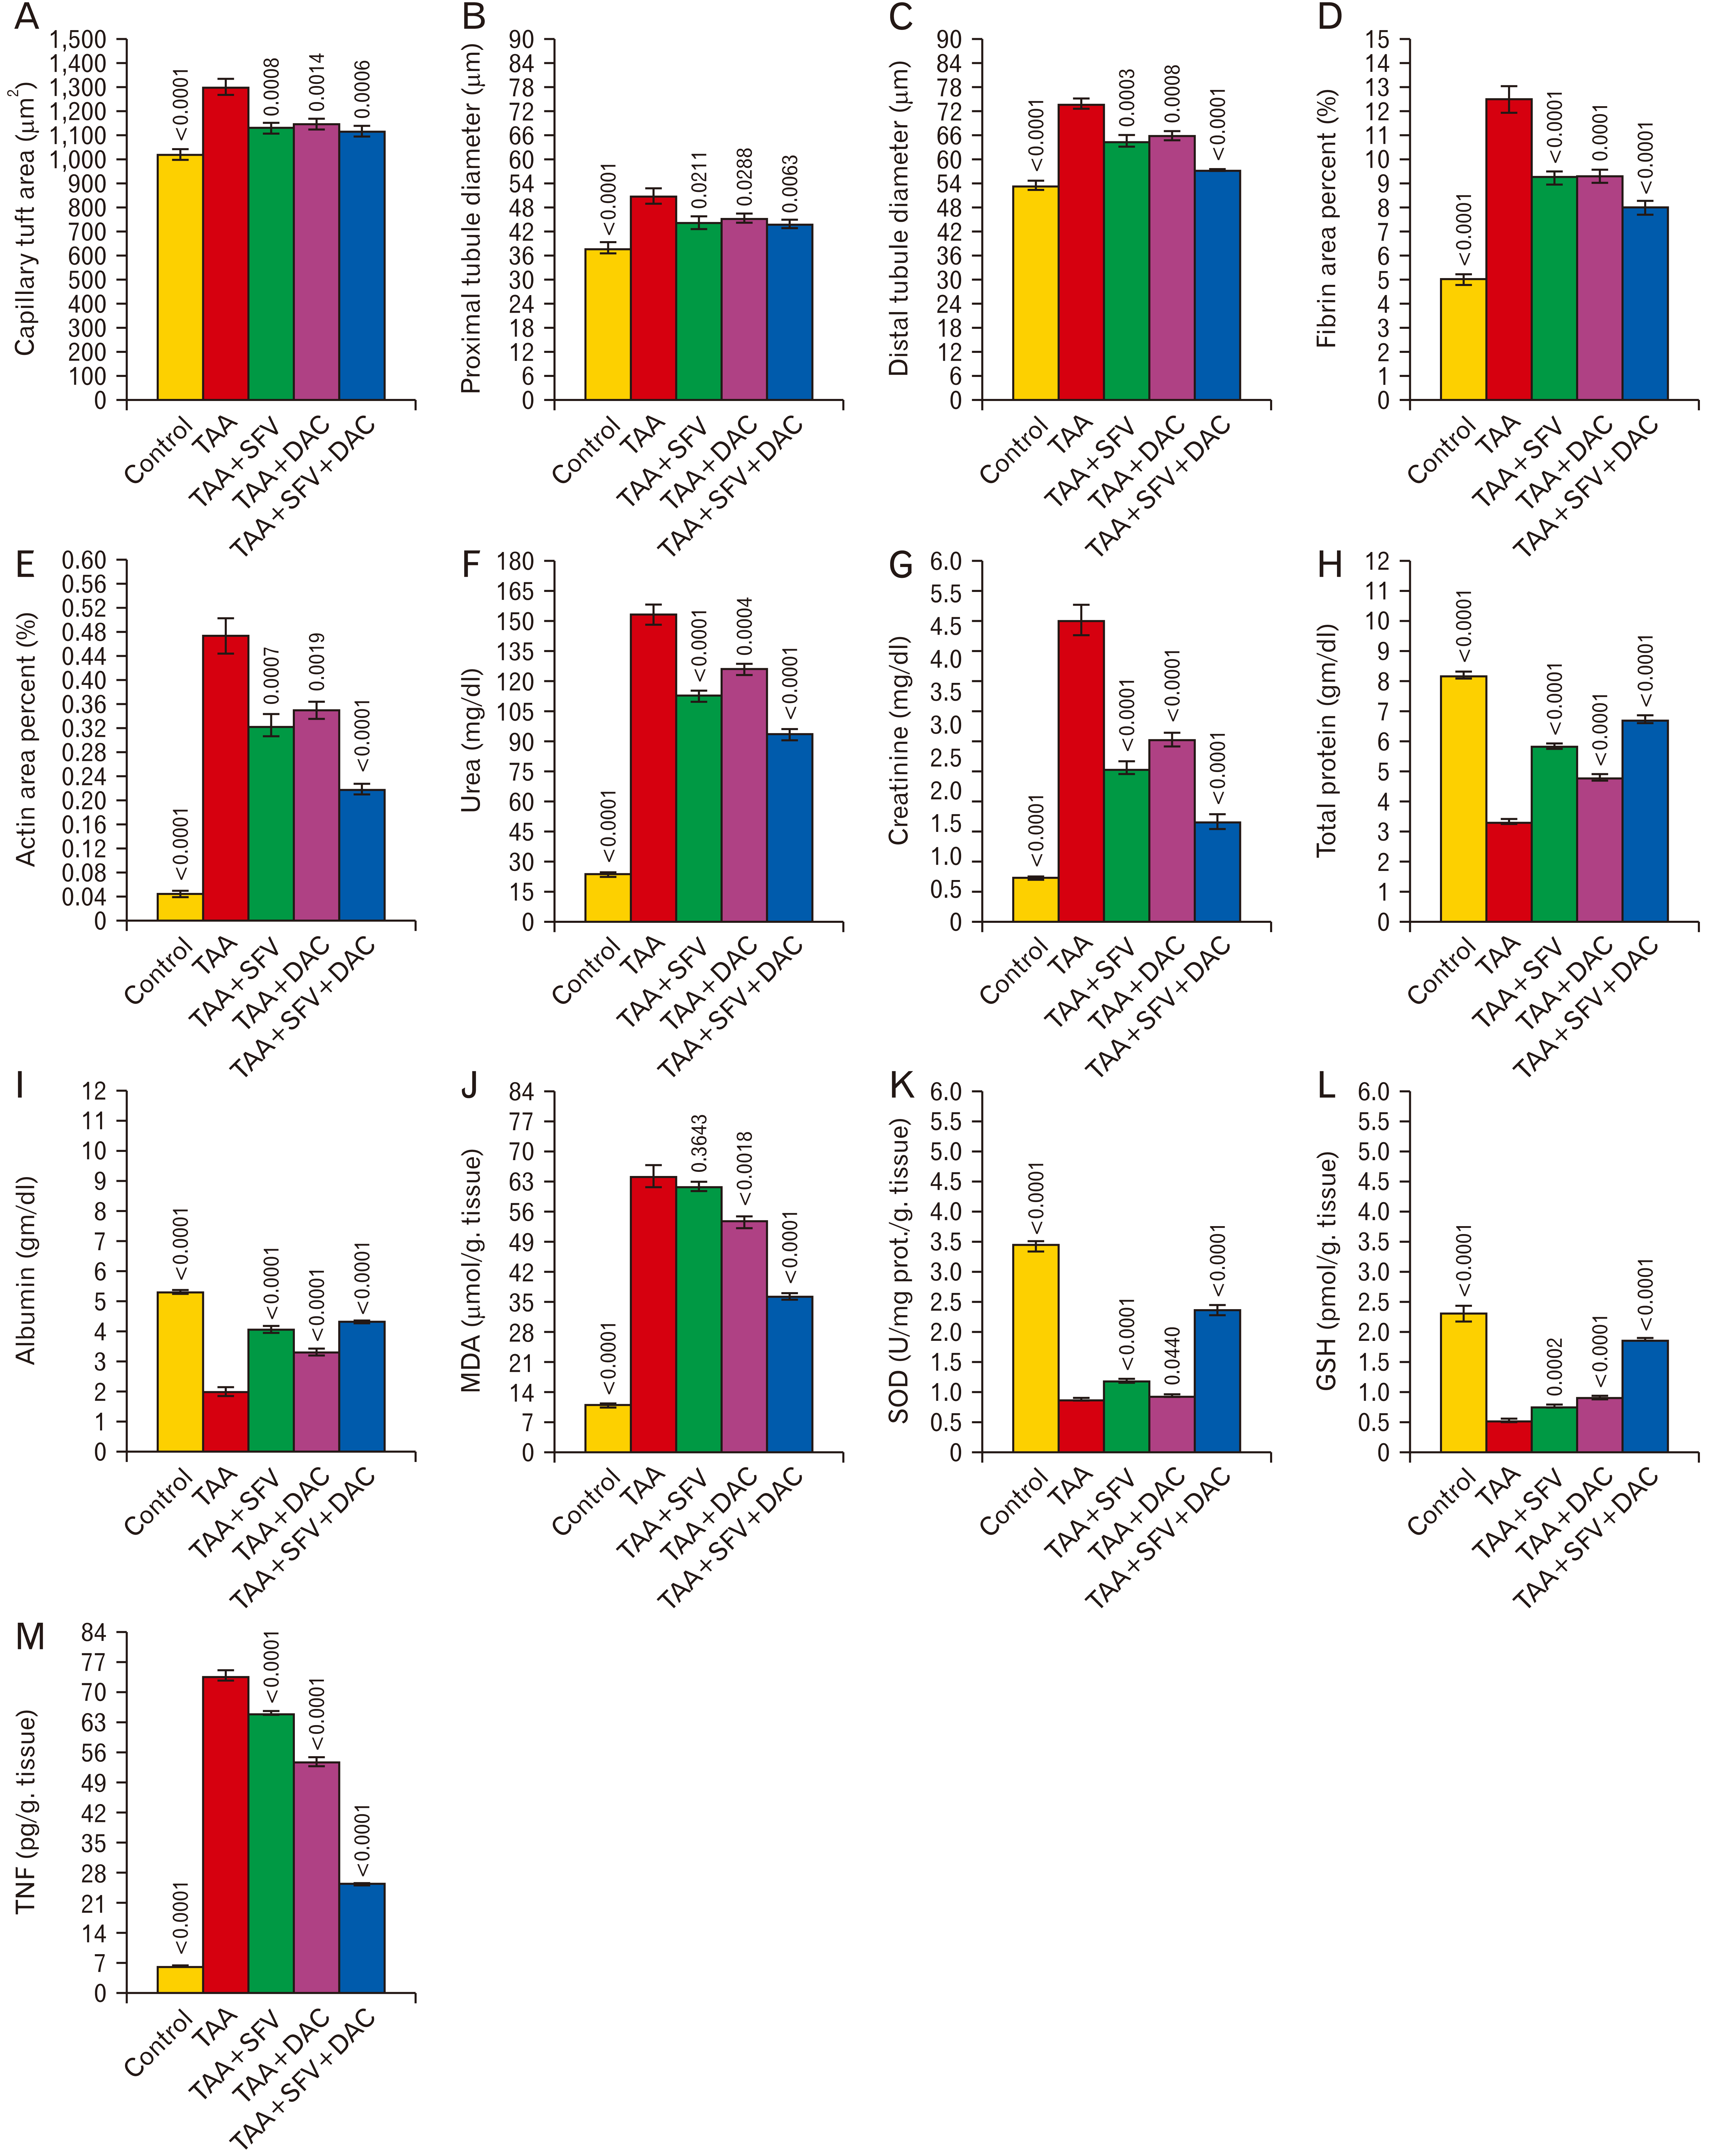 | Fig. 4Different morphological (A–E) and biochemical (F–M) parameters that were assessed in all experimental groups. Values are presented as means±SEM. P-values were elaborated by Bonferroni’s post hoc test by comparing all groups versus TAA group. TAA, thioacetamide; SFV, sofosbuvir; DAC, daclatasvir.
|
Biochemical analysis
All the measured parameters showed no significant difference between the control, SFV, DAC and SFV+DAC treated groups (the control group was presented only to avoid redundancy). Urea, creatinine, MDA and TNF-α levels increased markedly after TAA treatment and showed highly significant difference when compared to the control (P<0.0001 for all). On the other hand, TAA treatment resulted in prominent decrease in the total protein, albumin, SOD and GSH with high significant difference in comparison to the control group (P<0.0001 for all). Supplementation with either SFV or DAC alone revealed no significant difference between the two groups. Both groups showed mild degree of improvement in all parameters which had significant difference when compared to TAA treated group. The P-value was <0.0001 for urea, creatinine, total protein, albumin, SOD and TNF-α respectively in TAA+SFV group. However, P-value for GSH was 0.0002 and that for MDA was not significant (P=0.3643). Also, all the parameters showed significant differences when compared to the control with P<0.0001. Regarding the last group that was treated with TAA+SFV+DAC, this combination resulted in marked improvement in the whole measured parameters with significant difference in comparison to TAA treated group (P<0.0001). Moreover, comparison between TAA+SFV+DAC treated group and control group showed significant difference with P<0.0001 for all parameters. All the measured biochemical values are presented in Fig. 4.
Go to :
Discussion
Liver disease secondary to HCV infection is a global public health problem in which liver cirrhosis is the most common complication [21]. In addition, hepatitis affects other organs such as the kidney, spleen, due to the anatomical and physiological relationships [38]. As well as HCV infection can lead to renal disease, so that treating the infection can improve the survival rate [13]. Despite, the availability of interferon, the use of DAA combination is approved and highly recommended worldwide [39]. Dual use of SOF and DAC therapy is one of the most used combinations for the treatment of HCV infection [22]. TAA is a metal sulfide source compound, that has toxic effects on many organs. It shows a nephrotoxic, hepatotoxic, neurotoxic, and cardiotoxic effects through induction of oxidative stress. It is used to induce an experimental model of liver and renal injury [6, 12, 40]. The current study used TAA to produce a model of nephrotoxicity like that associated with HCV infection. At first the pathological effects of TAA treatment were identified, then the protective role of SOF and DAC supplementation were quantified. TAA prominently altered gene expression in different overlapped pathways concerning inflammation, necrosis, and immune responses which activated the dilation module as a possible response to inflammation and necrosis in a dose dependent manner [9]. The results of this study revealed great loss of the normal kidney architecture in the form of hypertrophy or atrophy of the glomerular capillary tuft. In addition, tubular distortion was evident after TAA treatment for 8 weeks at a dose of 200 mg/kg body weight. Some tubules appeared without their smooth inner lining and were filled with casts, others showed cells with pyknotic nuclei. These results were in line with many reported trials with different doses and durations. TAA treatment at 0.3% in water for two weeks led to glomerular distortion and significant congestion [2]. Light microscopic examination of kidney tissue related to TAA intraperitoneally supplemented rats in a dose of 50 mg/kg/day, 5 days/week for 2 weeks showed glomerular and peritubular congestion with disruption of tubular epithelial lining and intra-luminal hyaline cast. Tubular cells showed vacuolations, Karyorrhexis and deeply stained nuclei [10]. Also, desquamation and loss of the tubular brush border with cell swelling, cytoplasmic vacuolations and pale cytoplasm were observed after single intraperitoneal injection of 200 mg/kg TAA in mice [11]. Furthermore, fusion of cell margins, vascular degeneration and pyknotic nuclei were observed in the renal glomeruli and tubules after treatment with 0.3% of TAA in drinking water for two weeks [1]. However, no significant histopathologic abnormalities were detected in the kidneys of rats exposed to oral TAA at doses like 10 mg and 30 mg/kg body weight for four weeks or intraperitoneal injection with 25 mg/kg or 100 mg/kg body weight for 8 or 24 hours [9, 41]. In previous research, TAA increased collagen deposition and induced glomerular sclerosis and necrosis with interstitial fibrosis [2, 42, 43]. Juxtamedullary collagen content increased significantly in the TAA treated group in this study which agreed with Mansour et al. [10] who showed significant increase in the amount of collagen fibers in-between renal tubules and around renal glomeruli after TAA treatment as well. Moreover, significantly increased collagen and fibrin deposition in the renal medulla with focal mesangial cell proliferation and outstanding hepatic perivascular and peri-biliary deposition of collagen were noticed as well in the TAA supplemented group [26, 44]. Mesangial cell proliferation was confirmed by estimating the expression of α-smooth muscle actin in the current study. Immunohistochemical examination revealed evident glomerular and inter-tubular increase in the expression of α-smooth muscle actin. It was reported that the impaired renal functions associated with TAA administration occurred due to glomerular congestion, tubular epithelial cell death, inflammatory cell infiltration and the generation of reactive oxygen species [45, 46]. The concentration of total protein, albumin, urea, and creatinine were significantly disturbed after treating rats with TAA at a dose of 200 mg/kg body weight. Moreover, all the measured oxidative stress markers (MDA, SOD and GSH) and proinflammatory cytokines like TNF-α were markedly affected by TAA treatment. Several studies reported the disturbance in the renal function parameters, oxidative stress markers, cytokines and inflammatory markers as interleukins in the TAA-treated group [1, 2, 9-12, 41]. Mostly, oxidative stress plays the most important role in TAA-induced nephrotoxicity so that many authors hypothesized that the use of antioxidants could have beneficial effects [47, 48]. Furthermore, many natural products as nerolidol, wheat germ oil, schisandrin-B and propolis were discussed to relieve the toxic effects induced by TAA [1, 10-12]. The availability of directly acting antiviral combinations led to a great revolution in the treatment of HCV [49]. Although, the metabolites of this group of drugs are excreted in urine and the plasma levels of these metabolites are significantly higher in patients with impaired renal function, no major complications were recorded [14]. SFV plus DAC is one of the most extensively investigated combinations for treating different genotypes of HCV [21]. It was hypothesized that the use of this combination might have ameliorative effects on the TAA induced nephrotoxicity. The results of the current study confirmed that SFV and DAC have a good safety profile on the kidney as much as the case on the liver [14, 50]. No significant differences either histological, immunohistochemical or biochemical were recorded between the control and the groups received SFV or DAC or both. The selective use of SFV or DAC demonstrated a remarkable degree of improvement in all the examined aspects of nephrotoxicity induced by TAA. Moreover, the combination of both drugs produced the maximum protection against TAA stimulated renal dysfunction. The glomerular capillary tuft and the CS were apparently normal, most of the tubules appeared empty with no casts and healthy epithelial lining, collagen deposition was significantly less than that in TAA group and glomerular and inter-tubular α-smooth muscle actin expression was less prominent with P-value less than 0.0001 for all the measured parameters either morphometrical or biochemical. SFV plus DAC combination therapy was extensively investigated in different HCV genotypes and proved a high rate of safety, tolerance and effectiveness for the treatment of chronic hepatitis C [21]. Also, the same combination was investigated in TAA induced hepatitis and showed a great anti fibrotic effect by inhibiting TNF-α cytokine as well as a protective effects against oxidative stress and inflammation [26]. Previously, simultaneous kidney and liver transplantation followed by HCV treatment was the only possible treatment option for patients with advanced liver disease associated with nephropathy. However, currently it was observed that these patients had a perfect and unexpected sustained viral response and excellent compliance after the use of SFV+DAC combination in cases of renal affection [14]. Till now, it is not clear if the improvement in the kidney after the use of DAAs was mediated by the direct anti-fibrotic, anti-oxidative stress and anti-inflammatory effects of these drugs or secondary to the induced liver improvement. This is a very promising point of research to build upon the results of the current study and uncover the precise mechanisms of action mediated by DAAs in different types of nephropathies.
Based on the findings it can be concluded that TAA is a highly nephrotoxic agent. Moreover, the combination of antivirus-C drugs like SFV and DAC carries a great prospection for the patients with renal affection. However, further investigations are still needed to add more knowledge about their prognosis and to clarify the probability of adding more supplements to get more improvement.
Go to :
 XML Download