Abstract
Background and Objectives
Epithelial-Mesenchymal transition (EMT) is one of the origins of myofibroblasts in renal interstitial fibrosis. Mesenchymal stem cells (MSCs) alleviating EMT has been proved, but the concrete mechanism is unclear. To explore the mechanism, serum-free MSCs conditioned medium (SF-MSCs-CM) was used to treat rat renal tubular epithelial cells (NRK-52E) fibrosis induced by transforming growth factor-β1 (TGF-β1) which ameliorated EMT.
Methods and Results
Galectin-3 knockdown (Gal-3 KD) and overexpression (Gal-3 OE) lentiviral vectors were established and transfected into NRK-52E. NRK-52E fibrosis model was induced by TGF-β1 and treated with the SF-MSCs-CM for 24 h after modelling. Fibrosis and autophagy related indexes were detected by western blot and immunocytochemistry. In model group, the expressions of α-smooth muscle actin (α-SMA), fibronectin (FN), Galectin-3, Snail, Kim-1, and the ratios of P-Akt/Akt, P-GSK3β/GSK3β, P-PI3K/PI3K, P-mTOR/mTOR, TIMP1/MMP9, and LC3B-II/I were obviously increased, and E-Cadherin (E-cad) and P62 decreased significantly compared with control group. SF-MSCs-CM showed an opposite trend after treatment compared with model group. Whether in Gal-3 KD or Gal-3 OE NRK-52E cells, SF-MSCs-CM also showed similar trends. However, the effects of anti-fibrosis and enhanced autophagy in Gal-3 KD cells were more obvious than those in Gal-3 OE cells.
Conclusions
SF-MSCs-CM probably alleviated the EMT via inhibiting Galectin-3/Akt/GSK3β/Snail pathway. Meanwhile, Gal-3 KD possibly enhanced autophagy via inhibiting Galectin-3/Akt/mTOR pathway, which synergistically ameliorated renal fibrosis. Targeting galectin-3 may be a potential target for the treatment of renal fibrosis.
Chronic kidney disease (CKD) and renal fibrosis, which affect half of adults over the age of 70 and 10% of the world’s population, are an important public health problem. The main pathological feature of renal fibrosis is a large number of activated myofibroblasts, and the excessive synthesis and secretion of extracellular matrix (ECM) is deposited in the renal interstitium, which leading to structural damage, impairment of renal function, and eventually end-stage renal disease (1). It has been recognized that TGF-β1 is still regarded as the master regulator of fibrosis. TGF-β1 mediated EMT is an outstanding mechanism in the progression of fibrosis, which is often used to establish renal fibrosis in vitro (2). Hyperactivated myofibroblasts are an important source of excessive ECM production. Notwithstanding, there exists controversy about the sources of myofibroblasts and their contribution to fibrosis, recent studies suggested that resident fibroblasts and EMT are the two major sources of myofibroblasts in renal interstitial fibrosis (3).
It has been an important direction in the treatment of renal fibrosis to search for effective targets. Clinically, angiotensin-converting enzyme inhibitors (ACEIs) or angiotensin receptor blockers (ARBs) have been the mainstay of therapy for CKD for more than 20 years. While ACEIs and ARBs slow the progression of renal disease, they do not halt this progress (4). There are still no agents beyond ACEIs and ARBs approved to treat renal fibrosis in clinical practice. A great deal of evidences showed that stem cells have notable therapeutic effects in acute and chronic kidney diseases. Among them, MSCs are considered the most promising therapeutic tool due to their capacity of self-renewal, multilineage differentiation, immunomodu-lation, and have attracted great attention in regenerative medicine. MSCs-based therapy has been proved to ameliorate renal fibrosis with effectiveness and safety in various CKD diseases and emerged as a promising way for anti-fibrosis in the latest 10 years (5). At present, it is still recognized that plenty of cytokines secreted by MSCs is the main factor of their anti-fibrotic effects in acute and chronic kidney diseases. However, the concrete mechanism of MSCs for inhibiting EMT has not been fully elucidated.
To date, there is still a lack of effective treatment specifically targeting to renal fibrosis. However, Prakoura et al. (6) and Liu and Zhuang (4) summarized five novel mediators of renal fibrosis with the potential to constitute future therapeutic targets against kidney disease: galectin-3, discoidin domain receptor 1 (DDC1), periostin, connexin 43, and cannabinoid receptor 1 (CB1). Among them, galectin-3 is a new anti-fibrotic target of our interest. We attempted to elucidate the regulation of galectin-3 in MSCs with renal fibrosis induced by TGF-β1.
Autophagy is a highly conserved metabolic process that involves in the breakdown of intracellular proteins and organelles mediated by lysosomes (7). Basic autophagy in renal cells is essential for maintaining the internal environment, structure and renal function. Under stress, autophagy is changed as part of the adaptive response of renal cells, and this process is strictly regulated by signaling pathways that regulate autophagy flow (8). Some studies have shown that autophagy has a pro-fibrotic effect and participates in the activation of renal fibroblasts in a unilateral ureteral obstruction (UUO) mouse model (9, 10). More experiments in vivo and vitro have confirmed that induction of autophagy leads to inhibition of EMT, which in turn inhibits fibrosis (11, 12). However, there are still questions about whether autophagy has a protective or pathological role in renal fibrosis, as well as the exact mechanisms of the autophagy response, which require further research to gain insight into the regulation of renal autophagy and contribute to the discovery of novel therapeutic strategies (13).
MSCs were derived from rat bone marrow that obtained from the femur and tibia of healthy male Sprague-Dawley rats (120∼150 g). These cells were maintained in low glucose Dulbecco’s modified Eagle’s medium (DMEM) containing 10% fetal bovine serum (FBS) (Gibco, Invitrogen, New York, USA), 2.5 mM L-glutamine, and penicillin/streptomycin (Gibco, Invitrogen, New York, USA) in a 5% CO2 incubator at 37℃. When these reached 90% confluence, MSCs were harvested using 0.25% trypsin-EDTA (Thermo Fisher Scientific, Waltham, MA, USA). MSCs were subcultured at the ratio of 1:3. To identify MSCs, MSCs (passage 3) were collected and washed with sterile saline to achieve a single cell suspension for analysis. The cells were incubated with the following antibodies against surface antigens (Abcam, UK): CD90-FITC (ab226, Abcam), CD29-PE/Cy7 (ab95622, Abcam), CD45-APC (17-0461-82, ThermoFisher Scientific) and CD106-PE (ab223981, Abcam). Finally, MSCs were washed and resuspended in 0.5 ml of PBS for analysis using a BD FACSCalibur flow cytometer and Cell Quest software (BD Biosciences, San Jose, CA, USA). When MSCs reached 70% at passage 3, the cells were washed with phosphate buffered saline for three time, and cultured with DMEM without serum and antibiotics for 48 h. Collect the free serum MSCs supernatant, centrifuge it at 2,000 rpm for 10 min and remove cellular debris by using a 0.22 μm disposable filter, and then store it at −80℃ till use. All animal cares and experimental procedures involved in this study have been approved by the Animal Ethics Committee (AEC) of the Southwest Medical University (No. SWMU201803147).
Normal rat renal tubular epithelial cells (NRK-52E) were purchased from the Beina Chuanglian Biotechnology Research Institute (BNBIO, Beijing, China) and cultured in DMEM containing low-glucose (Gibco/Life Technologies, Grand Island, NY) supplemented with 10% FBS (Gibco/Life Technologies). Cells that reached 80% confluent were used for the next experiments. The experiment was divided into five groups: (1) Normal group, (2) TGF-β1 group, (3) TGF-β1+SF-MSCs-CM group, (4) TGF-β1+SF-DMEM (serum-free DMEM) group, and (5) SF-MSCs-CM group. The TGF-β1 group was treated with recombinant human TGF-β1 (15 ng/ml, PeproTech, Rocky Hill, NJ, USA) for 72 h. SF-MSCs-CM or SF-DMEM was added to the dishes for 24 h and 48 h at the end of TGF-β1 treatment in TGF-β1+SF-MSCs-CM group and TGF-β1+SF-DMEM group. The SF-MSCs-CM group was only treated with conditioned medium for 24 h and 48 h. The cells were cultured and treated in a 6 cm dish, and the volume of DMEM and SF-MSCS-CM were both 4 ml in each dish.
To explore the role of galectin-3 gene in SF-MSCs-CM against TGF-β1-induced NRK-52E fibrosis, Gal-3 KD or Gal-3 OE lentiviral vector was transfected into NRK-52E cells, the empty vector transfected cells were used as control (Syngentech, Beijing, China). Western blot confirmed the expression of galectin-3 protein. NRK-52E cells transfected were seeded into 6 cm sterile dishes and divided into three groups: control group (Control), galectin-3 knockdown group (Gal-3 KD), and galectin-3 overexpression group (Gal-3 OE). Every group was divided into five subgroups: (1) Normal group, (2) TGF-β1 group, (3) TGF-β1+SF-MSCs-CM group, (4) TGF-β1+SF-DMEM group, and (5) SF-MSCs-CM group. The TGF-β1 group was treated with recombinant human TGF-β1 (15 ng/ml, Pepro-Tech, Rocky Hill, NJ, USA) for 72 h. SF-MSCs-CM or SF-DMEM was added to the dishes for 24 h or 48 h at the end of TGF-β1 treatment in TGF-β1+SF-MSCs-CM group and TGF-β1+SF-DMEM group. The SF-MSCs-CM group was only treated with conditioned medium for 24 h or 48 h. Western blot was used to analyze cell lysates.
NRK-52E cells were seeded into 24-well sterile plates with cell slides and stained to detect E-Cadherin (1:50, Cell Signaling, USA) and α-SMA (1:100, Proteintech, USA) by immunocytochemistry according to the manufacturers’s manual (Solarbio Life Sciences, Beijing, China).
Total proteins were extracted on ice using RIPA (Beyotime, China) lysis buffer containing 1 mM PMSF. Collect the supernatants after centrifugation at 15,000 rpm at a 4℃ for 15 min. The concentration of protein was quantified by a BCA assay kit. The protein samples were loaded in 10% SDS-PAGE gels and transferred onto the PVDF membrane (Millipore, USA). The membrane was incubated overnight at 4℃ after blocking with 5% skim milk. The following antibodies are used: GAPDH (1:30,000, Proteintech, USA), α-SMA (1:4,000, Proteintech, USA), Galectin-3 (1:3,000, Cell Signaling, USA), GSK3β (1:1,000, Cell Signaling, USA), Phospho-GSK3β (Ser9) (1:1,000, Cell Signaling, USA), Snail (C15D3) (1:1,000, Cell Signaling, USA), Akt (pan) (1:1,000, Cell Signaling, USA), Phospho-Akt (Ser473) (1:1,000, Cell Signaling, USA), Fibronectin (1:1,000, Abcam, UK), E-Cadherin (1:1,000, Abcam, UK), MMP9 (1:1,000, Abcam, UK), TIMP1 (1:1,000, Cell Signaling, USA), Kim-1 (1:1,000, SAB, USA), PI3K (1:1,000, Abmart, China), Phospho-PI3K (1:1,000, Abmart, China), mTOR (1:1,000, Abmart, China), Phospho-mTOR (1:1,000, Abmart, China), LC3B (1:1,000, Abmart, China), and P62 (1:1,000, Abmart, China) antibodies. The membranes were incubated with horseradish peroxidase (HRP)-conjugated goat-anti rabbit or mouse antibodies for 1 hour and reacted with chemiluminescence HRP substrate (Solarbio, China). The ChemiScope 6000 Exp imaging system (CliNX, Shanghai, China) was used to display the protein bands. NIH Image J software was used for quantitative analysis of protein bands.
All data were biologically replicated three times. The data were presented as mean±standard deviation. Statistical analysis was performed using one-way or two ANOVA (GraphPad Software, San Diego, CA, USA) followed by the Bonferroni or Tukey post hoc testing to analyze differences between groups. p<0.05 were considered statistically significant.
Bone marrow-derived MSCs showed a typical spindle-shaped appearance. Flow cytometric analysis revealed that MSCs showed high expression levels of CD29 and CD90 and low expression levels of CD106 and CD45 (Fig. 1). The results confirmed the presence of a MSC phenotype.
To select an appropriate time for observing the effects of SF-MSCs-CM on alleviating fibrosis changes and cytokine depletion in conditioned medium, two time points (24 h and 48 h) were set up, respectively. TGF-β1 significantly increased the expressions of Gal-3 and α-SMA compared with the normal group. SF-MSCs-CM treatment for 24 h notably decreased the expressions of Gal-3 and α-SMA after TGF-β1 treatment, SF-DMEM medium treatment significantly upregulated these indexes compared with the TGF-β1+SF-MSCs-CM group. However, these indexes presented an upward trend comparing SF-MSCs-CM treatment for 48 h with SF-MSCs-CM treatment for 24 h after TGF-β1 treatment, which probably attributed to the exhaustion of the cytokines secreted by MSCs (Fig. 2).
To explore the regulation of Gal-3 in SF-MSCs-CM with NRK-52E fibrosis induced by TGF-β1 in vitro, western blot was used to detect the fibrosis related proteins. The resulted showed that TGF-β1 surely upregulated the expressions of α-SMA, FN, Kim-1, Gal-3, and Snail, and the ratios of TIMP1/MMP9, P-Akt/Akt, P-GSK3β/GSK3β, P-PI3K/PI3K, and P-mTOR/mTOR compared with the normal group. Meanwhile, SF-MSCs-CM treatment for 24 h notably reduced the above proteins or ratios, but E-Cadherin showed the opposite trend. Compared with TGF-β1+SF-MSCs-CM group, these indexes were markedly upregulated in TGF-β1+SF-DMEM group, especially when the expression level of α-SMA was higher than that in TGF-β1 group (Fig. 3).
To observe the effect of SF-MSCs-CM on autophagy in anti-fibrosis process, two time points were set, respec-tively, 24 h and 48 h. Up-regulation of the ratio of LC3B-II/I induced by TGF-β1 was accompanied by downregulation of P62 compared with the normal group, but the trend was even more pronounced in TGF-β1+SF-MSCs-CM group which SF-MSCs-CM treatment for 24 h compared with the TGF-β1 group, DMEM medium treatment with no serum significantly down-regulate the ratio of LC3B-II/I, meanwhile up-regulated the expression of P62 compared with the TGF-β1+SF-MSCs-CM group. However, the ratio of LC3B-II/I of TGF-β1+SF-MSCs-CM group treatmented for 48 h has a downward trend accompanied with an upward trend of P62 compared with that of TGF-β1+SF-MSCs-CM group treatmented for 24 h (Fig. 4).
To verify whether galectin-3 gene involved in SF-MSCs-CM against TGF-β1 induced NRK-52E fibrosis and the possible mechanism, the lentiviral vector was used to knock down and overexpress galectin-3 gene in NRK-52E cells, the efficiency of transfection of galectin-3 gene was verified by western blot (Fig. 5A∼C). To make the comparison of anti-fibrotic effect of SF-MSCs-CM between Gal-3 KD and Gal-3 OE cells, the expression of α-SMA, galectin-3 and E-cad was proved to be no statistical difference in the normal group, Gal-3 KD control group and Gal-3 OE control group (Fig. 5D).
In the Gal-3 KD group, TGF-β1 significantly increased the expressions or the ratios of α-SMA, TIMP1/MMP9, FN, Kim-1, Gal-3, P-Akt/Akt, P-GSK3β/GSK3β, and Snail compared with the normal group, and decreased the expression of E-cad. SF-MSCs-CM treatment significantly downregulated these indexes more clearly than SF-DMEM treatment after TGF-β1 treatment, except the expression of E-cad, which was upregulated. In the Gal-3 OE group, the indexes presented similar trends to those in the Gal-3 KD group, but higher than those of the same subgroups in the Gal-3 KD group (Fig. 6).
Immunocytochemical staining of cell slides revealed that Gal-3 KD reduced the expression of α-SMA and increased the expression of E-Cadherin in NRK-52E cells, but an opposite trend appeared in Gal-3 OE. TGF-β1 clearly increased the expression of α-SMA and decreased the expression of E-Cadherin in Gal-3 OE cell, which was more than in Gal-3 KD cells. The treatment of SF-MSCs-CM after TGF-β1 treatment reduced the expression of α-SMA and raised the expression of E-Cadherin in both Gal-3 KD cells and Gal-3 OE cells, but more obvious in Gal-3 KD cells than in Gal-3 OE cells. SF-DMEM treatment also downregulated the expression of α-SMA, worse than TGF-β1+SF-MSCs-CM group (Fig. 7).
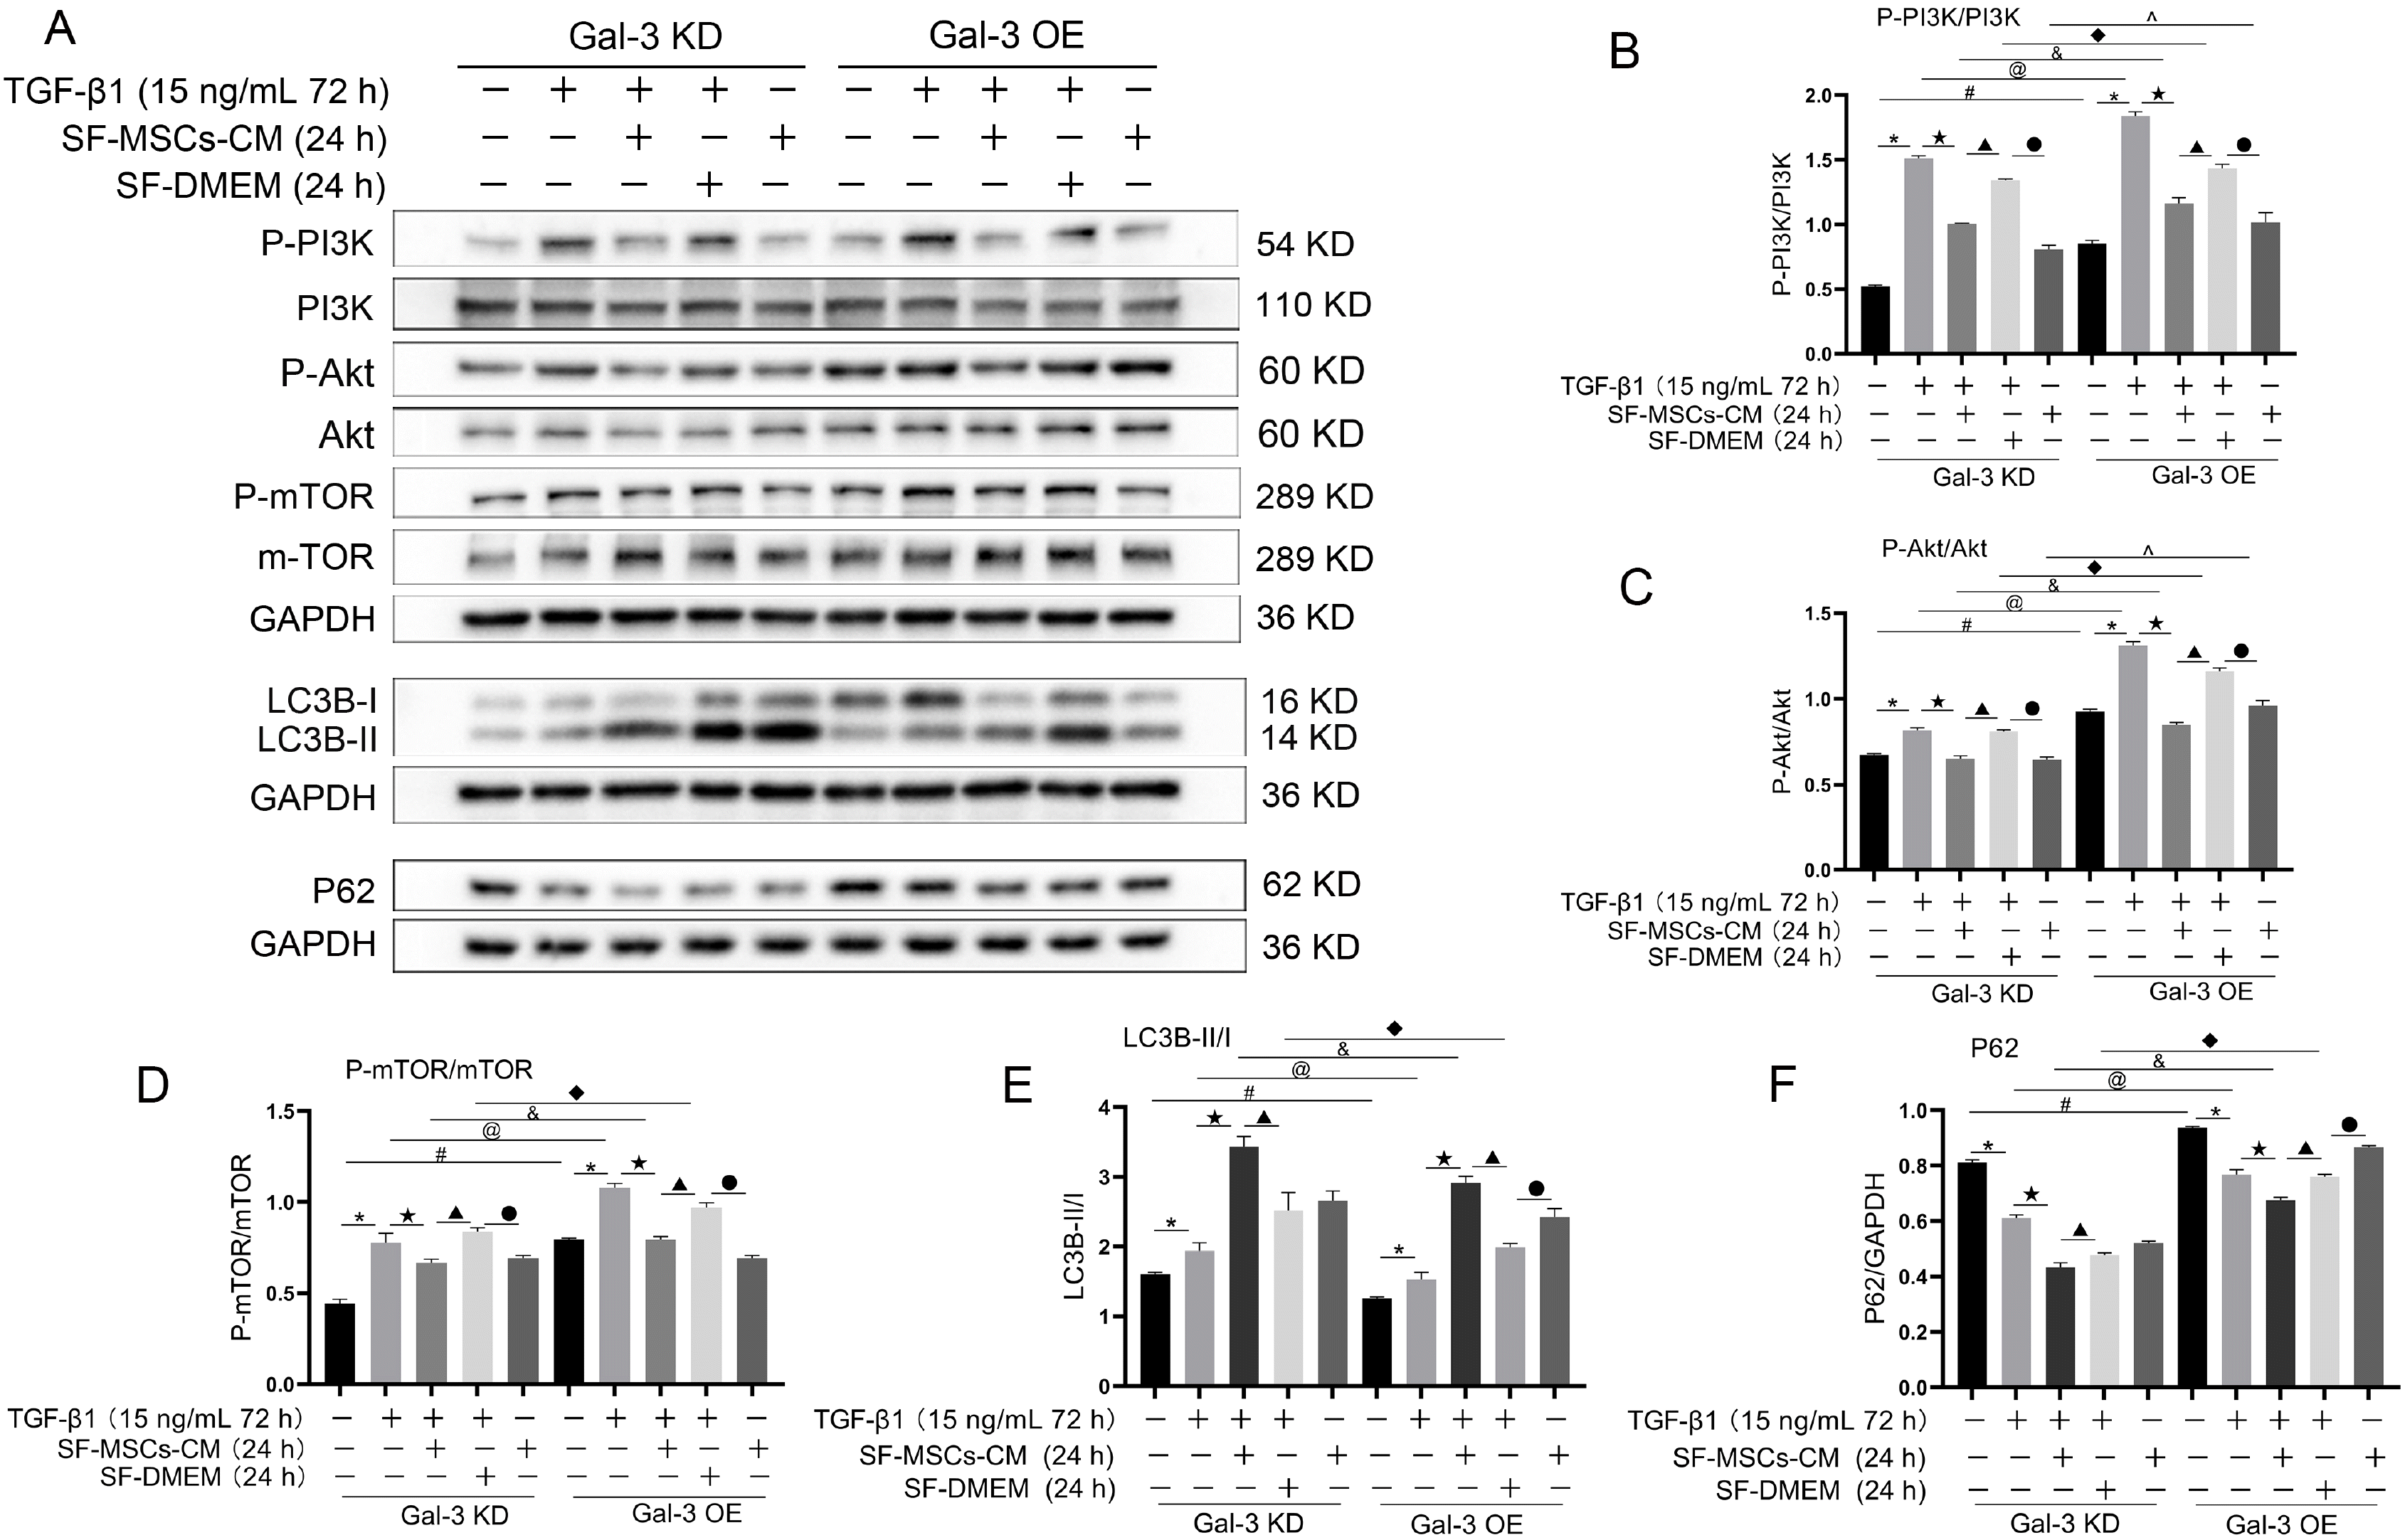
Whether in Gal-3 KD cells or in Gal-3 OE cells, TGF-β1 increased the ratios of P-PI3K/P-PI3K, P-Akt/Akt, P-mTOR/mTOR, and LC3B-II/I compared with the blank group, and were clearly decreased after SF-MSCs-CM treatment, except LC3B-II/I, while the expression of P62 showed the opposite trend. However, the ratios of the above indicators showed more significant decreases in Gal-3 KD cells than those in Gal-3 OE cells, except LC3B-II/I. P62 was downregulated more surely in Gal-3 KD cells than that in Gal-3 OE. SF-DMEM treatment after TGF-β1 treatment also decreased the ratios of the above indexes, but less than those in TGF-β1+SF-MSCs-CM group, especially in Gal-3 OE cells (Fig. 8).
Effects of MSCs on the fibrosis in liver, heart, and lung diseases have been widely demonstrated (14-16). MSCs-based therapy is a promising therapeutic strategy for acute and chronic kidney disease (17), and have antifibrosis effects and safeties in acute kidney injury and chronic kidney diseases (18-20). However, the exact mechanisms of MSCs-based therapies remain unclear. At present, numerous studies have shown that the exogenous treatment of MSCs or MSCs-conditioned medium can significantly reduce renal tubulointerstitial fibrosis by mainly secreting cytokines via paracrine effects, decrease peritubular capillary injury, and prevent epithelial-mesenchymal transition in variously chronic kidney injury models (21-23). Our results were consistent with these studies, showing the downregulation of α-SMA, galectin-3, TIMP1/MMP9, FN, Kim-1, Snail, and upregulation of E-Cadherin. These findings suggest that SF-MSCs-CM has anti-fibrotic properties and may be an effective therapy for preventing the progression of renal fibrosis.
Meantime, in the TGF-β1+SF-MSCs-CM group, we found that the expression of α-SMA decreased at 24 h, and then increased at 48 h, but less than that in TGF-β1 group, which probably attributed to the cytokines exhaustion of the conditional medium from MSCs, serum starvation (or unsuitable growing conditions), and autophagy regulation. Different literatures have reported that the different degree of fibrosis model induced by TGF-β1 in vitro is due to cell types, TGF-β1 concentration, induction time, and preconditioning of serum starvation. Most studies reported that in vitro, fibrosis model was induced by 10 ng/ml TGF-β1 treatment for 48 h or 5 ng/ml TGF-β1 treatment for 72 h. But we treated NRK-52E cells with TGF-β1 at a concentration of 15 ng/ml for 72 h, which probably resulted in excessive fibrosis. During 24 h treatment with SF-MSCs-CM, the concentration of cytokines, exosomes, or microvesicles derived from MSCs in the medium stayed at a high level, and NRK-52E cells could also tolerate a short-term serum deficiency, which showed good antifibrotic effects. But with the extension of treatment time, these levels decreased rapidly, and cells couldn’t tolerate serum deficiency for longer time, which maybe result in the above results. Meantime, SF-MSCs-CM was not suitable for the growth conditions of NRK-52E due to longer serum starvation. These results also indicated that the conditional medium of MSCs alone was not enough to reverse fibrosis in vitro in the short term. So, as the cells were kept in serum-free medium for longer time and the nutrients of SF-MSCS-CM were consumed, fibrosis tended to return, and even become more severe. On the other hand, this study also showed that with the extension of SF-MSCs-CM intervention time, autophagy gradually decreased. Autophagy could been triggered by serum starvation (24). Inhibition of autophagy can attenuate tunicamycin-induced fibrosis and apoptosis in HK-2 (25), but also reported that Drp1-regulated PARK2-depen-dent mitophagy activation protects against renal fibrosis in unilateral ureteral obstruction (26). Kimura et al. (27) confirmed that autophagy has a certain antagonistic effect on energy metabolism disorders and abnormal redox reactions. These implied that under different conditions, the regulation of autophagy did affect the fibrosis process, although it is still controversial. Our results showed that SF-MSCs-CM treatment for 24 h could alleviate fibrosis by activating the autophagy, but deteriorate by inhibiting the autophagy after SF-MSCs-CM treatment for 48 h (Fig. 2, 4), which implied that autophagy inhibition could exacerbate fibrosis in this study. This may be another reason for the above results.
To explore the possible mechanisms of SF-MSCs-CM against renal fibrosis in NRK-52E induced by TGF-β1, on the one hand, SF-MSCs-CM downregulated the ratios of P-Akt/Akt, P-GSK3β/GSK3β, which leaded to reducing the downstream key EMT transcription factor, Snail, inhibiting EMT which is one of the main sources of myofibroblasts, eventually alleviating the fibrosis. And that, the inhibiting the EMT of SF-MSCs-CM was related to the reduction of Galectin-3. On the other hand, SF-MSCs-CM downregulated the ratios of P-PI3K/PI3K, P-Akt/Akt, and P-mTOR/mTOR, and then enhanced the ratio of LC3BII/I accompanied by the decrease of P62, which implied that SF-MSCs-CM maybe ameliorate NRK-52E fibrosis by strengthening the autophagy via inhibiting PI3K/Akt/mTOR signaling pathway. Likewise, the enhancing the autophagy of SF-MSCs-CM was related to the decrease of Galectin-3. As reported in some references, the PI3K/Akt/mTOR signaling pathway has an inhibitory effect on autophagy (28, 29). Autophagy is a cellular biological process in which cytoplasmic components are degraded in lysosomes to maintain homeostasis and energy production. Increasing evidence suggests that autophagy activity is necessary for homeostasis, survival, physiological function of renal cells, and plays a role in preventing renal fibrosis (30-32). Our results also indicated that enhanced autophagy helped to weaken the degree of fibrosis, which was consistent with the reported. The data preliminarily suggested that SF-MSCs-CM can indeed enhance autophagy through Gal-3 knockdown, probably resulting from the deactivation of PI3K/Akt/mTOR signaling pathway. How galectin-3 knockdown regulates the activation of autophagy still needs further research.
Our study showed that galectin-3 knockdown was associated with either EMT inhibition or enhanced autophagy. Galectin is a superfamily of animal lectins, widely distributed in various cells, such as activated myofibroblasts, macrophages, epithelial cells, etc. It is characterized by its ability to bind β-galactoside, which is evolutionarily conserved and has a carbohydrate recognition domain (CRD) of about 130 amino acids. In mammals, 15 members of the galactose lectin family have been discovered, but galectin-3 is the only chimeric type of galectin in vertebrates. In the kidney, Gal-3 is involved in nephrogenesis and a variety of kidney diseases (33). Located mainly in the cytoplasm, galectin-3 can be shuttled into the nucleus or secreted to the cell surface, and can be detected in biological fluids including serum and urine. Gal-3 has the following three functions: 1) During growth and development, Gal-3 promotes cell migration by regulating intercellular adhesion and cell matrix adhesion; 2) Gal-3 promotes the activation of macrophages and fibrocytes, leading to tissue fibrosis and scar formation, thus causing organ fibrosis and dysfunction; 3) Gal-3 can promote the EMT and further participate in the pathological changes of tissue fibrosis (34). Galectin-3 expression has been reported in a large number of literatures in fibrosis diseases of the heart, liver, and kidney (35-37). Some of the literature suggests that galectin-3 has also been proposed as a diagnostic or prognostic biomarker for certain types of heart disease, kidney disease, and cancer (34, 38). Galectin-3 has the potential to be a valuable anti-fibrotic target.
Numerous studies have shown that the therapeutic effect of MSCs in treating various diseases mainly depended on their cytokine secretion and immune regulation, rather than their ability to differentiate into specific cells (39, 40). The conditioned medium of mesenchymal stem cell contains a variety of growth factors, cytokines, chemokines, microvesicles, and exosomes (41, 42). In addition, the exosomes or extracellular vesicles derived from MSCs medium contain a variety of substances, such as proteins, lipids and DNA, which play important roles in fibrosis resistance. Multiple animal models demonstrated that MSCs medium improved acute renal function injury (AKI) induced by cisplatin, glycerin, gentamicin, or ischemia-reperfusion injury (43-45). The exosomes derived from bone marrow-derived MSCs (BM-MSC-Ex) could inhibit TGF-β1-induced EMT in HK-2 cells, and may involve autophagy activation of BM-MSC-Ex (46). Wang et al. (47) observed that miRNA-LET7C in human bone marrow-derived MSCs exosomes down-regulated the expression of type I collagen, MMP9, α-SMA and TGF-β1 and their receptors in UUO mouse kidney and NRK-52E cells. Shi et al. (48) found that extracellular vesicles derived from rat bone marrow stem cells could partly inhibit RhoA/ROCK pathway and reduce renal fibrosis. The above literatures indicated that conditioned medium derived from MSCs may also exert antifibrotic roles by exosomes or microvesicles, and maybe involve autophagy activation of BM-MSC-Ex. However, whether the cytokines, exosomes, or microvesicles secreted by MSCs interact with galectin-3, and how galectin-3 regulates the autophagy in the fibrosis process need further study.
In conclusion, SF-MSCs-CM could decrease the expression of Galectin-3 in TGF-β1-induced NRK-52E in vitro fibrosis. The mechanism probably involved in attenuating EMT by inhibiting Galectin-3/Akt/GSK3β/Snail signaling pathway, and enhancing autophagy by inhibiting Galectin-3/PI3K/Akt/mTOR pathway.
References
1. Yan H, Xu J, Xu Z, Yang B, Luo P, He Q. 2021; Defining therapeutic targets for renal fibrosis: exploiting the biology of pathogenesis. Biomed Pharmacother. 143:112115. DOI: 10.1016/j.biopha.2021.112115. PMID: 34488081.
2. Meng XM, Nikolic-Paterson DJ, Lan HY. 2016; TGF-β: the master regulator of fibrosis. Nat Rev Nephrol. 12:325–338. DOI: 10.1038/nrneph.2016.48. PMID: 27108839.
3. Mack M, Yanagita M. 2015; Origin of myofibroblasts and cellular events triggering fibrosis. Kidney Int. 87:297–307. DOI: 10.1038/ki.2014.287. PMID: 25162398.
4. Liu F, Zhuang S. 2019; New therapies for the treatment of renal fibrosis. Adv Exp Med Biol. 1165:625–659. DOI: 10.1007/978-981-13-8871-2_31. PMID: 31399988.
5. Zhuang Q, Ma R, Yin Y, Lan T, Yu M, Ming Y. 2019; Mesenchymal stem cells in renal fibrosis: the flame of cytotherapy. Stem Cells Int. 2019:8387350. DOI: 10.1155/2019/8387350. PMID: 30766607. PMCID: PMC6350586.
6. Prakoura N, Hadchouel J, Chatziantoniou C. 2019; Novel targets for therapy of renal fibrosis. J Histochem Cytochem. 67:701–715. DOI: 10.1369/0022155419849386. PMID: 31116064. PMCID: PMC6713972.
7. Dikic I, Elazar Z. 2018; Mechanism and medical implications of mammalian autophagy. Nat Rev Mol Cell Biol. 19:349–364. DOI: 10.1038/s41580-018-0003-4. PMID: 29618831.
8. Tang C, Livingston MJ, Liu Z, Dong Z. 2020; Autophagy in kidney homeostasis and disease. Nat Rev Nephrol. 16:489–508. DOI: 10.1038/s41581-020-0309-2. PMID: 32704047. PMCID: PMC7868042.
9. Kim YA, Kim HJ, Gwon MG, Gu H, An HJ, Bae S, Leem J, Jung HJ, Park KK. 2021; Inhibitory effects of STAT3 transcription factor by synthetic decoy ODNs on autophagy in renal fibrosis. Biomedicines. 9:331. DOI: 10.3390/biomedicines9040331. PMID: 33806080. PMCID: PMC8064438. PMID: 7c9a1cc429ea4cb9abf73632804c6a7c.
10. Xue X, Ren J, Sun X, Gui Y, Feng Y, Shu B, Wei W, Lu Q, Liang Y, He W, Yang J, Dai C. 2018; Protein kinase Cα drives fibroblast activation and kidney fibrosis by stimulating autophagic flux. J Biol Chem. 293:11119–11130. DOI: 10.1074/jbc.RA118.002191. PMID: 29794026. PMCID: PMC6052200.
11. Gong W, Luo C, Peng F, Xiao J, Zeng Y, Yin B, Chen X, Li S, He X, Liu Y, Cao H, Xu J, Long H. 2021; Brahma-related gene-1 promotes tubular senescence and renal fibrosis through Wnt/β-catenin/autophagy axis. Clin Sci (Lond). 135:1873–1895. DOI: 10.1042/CS20210447. PMID: 34318888. PMCID: PMC8358963.
12. Wang YJ, Chen YY, Hsiao CM, Pan MH, Wang BJ, Chen YC, Ho CT, Huang KC, Chen RJ. 2020; Induction of autophagy by pterostilbene contributes to the prevention of renal fibrosis via attenuating NLRP3 inflammasome activation and epithelial-mesenchymal transition. Front Cell Dev Biol. 8:436. DOI: 10.3389/fcell.2020.00436. PMID: 32582712. PMCID: PMC7283393. PMID: d5324ecb11604ed6978d463436dbb3da.
13. Zhao XC, Livingston MJ, Liang XL, Dong Z. 2019; Cell apoptosis and autophagy in renal fibrosis. Adv Exp Med Biol. 1165:557–584. DOI: 10.1007/978-981-13-8871-2_28. PMID: 31399985.
14. Gubert F, da Silva JS, Vasques JF, de Jesus Gonçalves RG, Martins RS, de Sá MPL, Mendez-Otero R, Zapata-Sudo G. 2021; Mesenchymal stem cells therapies on fibrotic heart diseases. Int J Mol Sci. 22:7447. DOI: 10.3390/ijms22147447. PMID: 34299066. PMCID: PMC8307175. PMID: f522e52b7c62449e9dc1b3cd6db5f7fa.
15. Ntolios P, Steiropoulos P, Karpathiou G, Anevlavis S, Karampitsakos T, Bouros E, Froudarakis ME, Bouros D, Tzouvelekis A. 2020; Cell therapy for idiopathic pulmonary fibrosis: rationale and progress to date. BioDrugs. 34:543–556. DOI: 10.1007/s40259-020-00437-8. PMID: 32894503.
16. Tsuchiya A, Takeuchi S, Watanabe T, Yoshida T, Nojiri S, Ogawa M, Terai S. 2019; Mesenchymal stem cell therapies for liver cirrhosis: MSCs as "conducting cells" for improvement of liver fibrosis and regeneration. Inflamm Regen. 39:18. DOI: 10.1186/s41232-019-0107-z. PMID: 31516638. PMCID: PMC6732839. PMID: 138c296deb904065b83df46c6ba220e2.
17. Yun CW, Lee SH. 2019; Potential and therapeutic efficacy of cell-based therapy using mesenchymal stem cells for acute/chronic kidney disease. Int J Mol Sci. 20:1619. DOI: 10.3390/ijms20071619. PMID: 30939749. PMCID: PMC6479813.
18. Makhlough A, Shekarchian S, Moghadasali R, Einollahi B, Dastgheib M, Janbabaee G, Hosseini SE, Falah N, Abbasi F, Baharvand H, Aghdami N. 2018; Bone marrow-mesenchymal stromal cell infusion in patients with chronic kidney disease: a safety study with 18 months of follow-up. Cytothe-rapy. 20:660–669. DOI: 10.1016/j.jcyt.2018.02.368. PMID: 29580865.
19. Quimby JM, Webb TL, Habenicht LM, Dow SW. 2013; Safety and efficacy of intravenous infusion of allogeneic cryopreserved mesenchymal stem cells for treatment of chronic kidney disease in cats: results of three sequential pilot studies. Stem Cell Res Ther. 4:48. DOI: 10.1186/scrt198. PMCID: PMC3707049. PMID: 23632128.
20. Perico N, Casiraghi F, Remuzzi G. 2018; Clinical translation of mesenchymal stromal cell therapies in nephrology. J Am Soc Nephrol. 29:362–375. DOI: 10.1681/ASN.2017070781. PMID: 29191959. PMCID: PMC5791082.
21. Li H, Rong P, Ma X, Nie W, Chen Y, Zhang J, Dong Q, Yang M, Wang W. 2020; Mouse umbilical cord mesenchymal stem cell paracrine alleviates renal fibrosis in diabetic nephropathy by reducing myofibroblast transdifferentiation and cell proliferation and upregulating MMPs in mesangial cells. J Diabetes Res. 2020:3847171. DOI: 10.1155/2020/3847171. PMID: 32455132. PMCID: PMC7222483.
22. Liu B, Ding FX, Liu Y, Xiong G, Lin T, He DW, Zhang YY, Zhang DY, Wei GH. 2018; Human umbilical cord-derived mesenchymal stem cells conditioned medium attenuate interstitial fibrosis and stimulate the repair of tubular epithelial cells in an irreversible model of unilateral ureteral obstruction. Nephrology (Carlton). 23:728–736. DOI: 10.1111/nep.13099. PMID: 28667820.
23. Chen L, Wang Y, Li S, Zuo B, Zhang X, Wang F, Sun D. 2020; Exosomes derived from GDNF-modified human adipose mesenchymal stem cells ameliorate peritubular capillary loss in tubulointerstitial fibrosis by activating the SIRT1/eNOS signaling pathway. Theranostics. 10:9425–9442. DOI: 10.7150/thno.43315. PMID: 32802201. PMCID: PMC7415791.
24. Bernard M, Yang B, Migneault F, Turgeon J, Dieudé M, Olivier MA, Cardin GB, El-Diwany M, Underwood K, Rodier F, Hébert MJ. 2020; Autophagy drives fibroblast senescence through MTORC2 regulation. Autophagy. 16:2004–2016. DOI: 10.1080/15548627.2020.1713640. PMID: 31931659. PMCID: PMC7595590.
25. Shu S, Wang H, Zhu J, Liu Z, Yang D, Wu W, Cai J, Chen A, Tang C, Dong Z. 2021; Reciprocal regulation between ER stress and autophagy in renal tubular fibrosis and apoptosis. Cell Death Dis. 12:1016. DOI: 10.1038/s41419-021-04274-7. PMID: 34716302. PMCID: PMC8556380. PMID: 6d66ef031aac4178a31899264c356066.
26. Li S, Lin Q, Shao X, Zhu X, Wu J, Wu B, Zhang M, Zhou W, Zhou Y, Jin H, Zhang Z, Qi C, Shen J, Mou S, Gu L, Ni Z. 2020; Drp1-regulated PARK2-dependent mitophagy protects against renal fibrosis in unilateral ureteral obstruc-tion. Free Radic Biol Med. 152:632–649. DOI: 10.1016/j.freeradbiomed.2019.12.005. PMID: 31825802.
27. Kimura T, Takahashi A, Takabatake Y, Namba T, Yamamoto T, Kaimori JY, Matsui I, Kitamura H, Niimura F, Matsusaka T, Soga T, Rakugi H, Isaka Y. 2013; Autophagy protects kidney proximal tubule epithelial cells from mitochondrial metabolic stress. Autophagy. 9:1876–1886. DOI: 10.4161/auto.25418. PMID: 24128672.
28. Chen K, Yu B, Liao J. 2021; LncRNA SOX2OT alleviates mesangial cell proliferation and fibrosis in diabetic nephropathy via Akt/mTOR-mediated autophagy. Mol Med. 27:71. DOI: 10.1186/s10020-021-00310-6. PMCID: PMC8268185. PMID: 34238205. PMID: e0f6f6d7e06e4f58a37af1c528ab3121.
29. Cong LH, Li T, Wang H, Wu YN, Wang SP, Zhao YY, Zhang GQ, Duan J. 2020; IL-17A-producing T cells exacerbate fine particulate matter-induced lung inflammation and fibrosis by inhibiting PI3K/Akt/mTOR-mediated autophagy. J Cell Mol Med. 24:8532–8544. DOI: 10.1111/jcmm.15475. PMID: 32643865. PMCID: PMC7412687.
30. Dai J, Sun Y, Chen D, Zhang Y, Yan L, Li X, Wang J. 2019; Negative regulation of PI3K/AKT/mTOR axis regulates fibroblast proliferation, apoptosis and autophagy play a vital role in triptolide-induced epidural fibrosis reduction. Eur J Pharmacol. 864:172724. DOI: 10.1016/j.ejphar.2019.172724. PMID: 31600493.
31. Nam SA, Kim WY, Kim JW, Park SH, Kim HL, Lee MS, Komatsu M, Ha H, Lim JH, Park CW, Yang CW, Kim J, Kim YK. 2019; Autophagy attenuates tubulointerstital fibrosis through regulating transforming growth factor-β and NLRP3 inflammasome signaling pathway. Cell Death Dis. 10:78. DOI: 10.1038/s41419-019-1356-0. PMID: 30692509. PMCID: PMC6349890.
32. Zhao XC, Livingston MJ, Liang XL, Dong Z. 2019; Cell apoptosis and autophagy in renal fibrosis. Adv Exp Med Biol. 1165:557–584. DOI: 10.1007/978-981-13-8871-2_28. PMID: 31399985.
33. Saccon F, Gatto M, Ghirardello A, Iaccarino L, Punzi L, Doria A. 2017; Role of galectin-3 in autoimmune and non-autoimmune nephropathies. Autoimmun Rev. 16:34–47. DOI: 10.1016/j.autrev.2016.09.023. PMID: 27666815.
34. Hara A, Niwa M, Noguchi K, Kanayama T, Niwa A, Matsuo M, Hatano Y, Tomita H. 2020; Galectin-3 as a next-generation biomarker for detecting early stage of various diseases. Biomolecules. 10:389. DOI: 10.3390/biom10030389. PMID: 32138174. PMCID: PMC7175224. PMID: d4cf0ba4c34c41ef866598d2dfcf61e0.
35. Martínez-Martínez E, Ibarrola J, Fernández-Celis A, Calvier L, Leroy C, Cachofeiro V, Rossignol P, López-Andrés N. 2018; Galectin-3 pharmacological inhibition attenuates early renal damage in spontaneously hypertensive rats. J Hypertens. 36:368–376. DOI: 10.1097/HJH.0000000000001545. PMID: 28858976.
36. Oikonomou T, Goulis I, Ntogramatzi F, Athanasiadou Z, Vagdatli E, Akriviadis E, Cholongitas E. 2019; Galectin-3 is associated with glomerular filtration rate and outcome in patients with stable decompensated cirrhosis. Dig Liver Dis. 51:1692–1697. DOI: 10.1016/j.dld.2019.05.030. PMID: 31235313.
37. Shen H, Wang J, Min J, Xi W, Gao Y, Yin L, Yu Y, Liu K, Xiao J, Zhang YF, Wang ZN. 2018; Activation of TGF-β1/α-SMA/Col I profibrotic pathway in fibroblasts by galectin-3 contributes to atrial fibrosis in experimental models and patients. Cell Physiol Biochem. 47:851–863. DOI: 10.1159/000490077. PMID: 29807358.
38. Dong R, Zhang M, Hu Q, Zheng S, Soh A, Zheng Y, Yuan H. 2018; Galectin-3 as a novel biomarker for disease diagnosis and a target for therapy (Review). Int J Mol Med. 41:599–614. DOI: 10.3892/ijmm.2017.3311. PMID: 29207027. PMCID: PMC5752178.
39. Wang Y, Chen X, Cao W, Shi Y. 2014; Plasticity of mesenchymal stem cells in immunomodulation: pathological and therapeutic implications. Nat Immunol. 15:1009–1016. DOI: 10.1038/ni.3002. PMID: 25329189.
40. Yang D, Wang W, Li L, Peng Y, Chen P, Huang H, Guo Y, Xia X, Wang Y, Wang H, Wang WE, Zeng C. 2013; The relative contribution of paracine effect versus direct differentiation on adipose-derived stem cell transplantation mediated cardiac repair. PLoS One. 8:e59020. DOI: 10.1371/journal.pone.0059020. PMCID: PMC3602597. PMID: 23527076. PMID: 0c2856f8d3ba41a995332f455e19b3bd.
41. d'Angelo M, Cimini A, Castelli V. 2020; Insights into the effects of mesenchymal stem cell-derived secretome in Parkinson's disease. Int J Mol Sci. 21:5241. DOI: 10.3390/ijms21155241. PMID: 32718092. PMCID: PMC7432166. PMID: f08f081b48a646f3a76ce03d25a2ac72.
42. Gunawardena TNA, Rahman MT, Abdullah BJJ, Abu Kasim NH. 2019; Conditioned media derived from mesenchymal stem cell cultures: the next generation for regenerative medicine. J Tissue Eng Regen Med. 13:569–586. DOI: 10.1002/term.2806. PMID: 30644175.
43. Kholia S, Herrera Sanchez MB, Cedrino M, Papadimitriou E, Tapparo M, Deregibus MC, Bruno S, Antico F, Brizzi MF, Quesenberry PJ, Camussi G. 2020; Mesenchymal stem cell derived extracellular vesicles ameliorate kidney injury in aristolochic acid nephropathy. Front Cell Dev Biol. 8:188. DOI: 10.3389/fcell.2020.00188. PMID: 32266268. PMCID: PMC7105599. PMID: 30db69ecc4864a438e8049a7860729bc.
44. Reis LA, Borges FT, Simões MJ, Borges AA, Sinigaglia-Coimbra R, Schor N. 2012; Bone marrow-derived mesenchymal stem cells repaired but did not prevent gentamicin-induced acute kidney injury through paracrine effects in rats. PLoS One. 7:e44092. DOI: 10.1371/journal.pone.0044092. PMID: 22970165. PMCID: PMC3435420. PMID: 565ef4ee4e9145c78eb21cf4b072b0c6.
45. Yu B, Zhang X, Li X. 2014; Exosomes derived from mesenchymal stem cells. Int J Mol Sci. 15:4142–4157. DOI: 10.3390/ijms15034142. PMID: 24608926. PMCID: PMC3975389.
46. Yin S, Zhou S, Ren D, Zhang J, Xin H, He X, Gao H, Hou J, Zeng F, Lu Y, Zhang X, Fan M. 2022; Mesenchymal stem cell-derived exosomes attenuate epithelial-mesenchymal transition of HK-2 cells. Tissue Eng Part A. doi: 10.1089/ten.TEA.2021.0190. [Epub ahead of print]. DOI: 10.1089/ten.tea.2021.0190. PMID: 35019728.
47. Wang B, Yao K, Huuskes BM, Shen HH, Zhuang J, Godson C, Brennan EP, Wilkinson-Berka JL, Wise AF, Ricardo SD. 2016; Mesenchymal stem cells deliver exogenous microRNA-let7c via exosomes to attenuate renal fibrosis. Mol Ther. 24:1290–1301. DOI: 10.1038/mt.2016.90. PMID: 27203438. PMCID: PMC5088767.
48. Shi Z, Wang Q, Zhang Y, Jiang D. 2020; Extracellular vesicles produced by bone marrow mesenchymal stem cells attenuate renal fibrosis, in part by inhibiting the RhoA/ROCK pathway, in a UUO rat model. Stem Cell Res Ther. 11:253. DOI: 10.1186/s13287-020-01767-8. PMID: 32586368. PMCID: PMC7318505. PMID: ffa4bded8b22465c881a608e1765d922.
Fig. 1
Identification of rat bone marrow-derived MSCs. The appearance of bone marrow-derived MSCs is a typical spindle shape. Immunophenotypic characterization of MSCs was detected by flow cytometry. MSCs related markers were positive for CD29 and CD90 and were negative for CD106 and CD45.
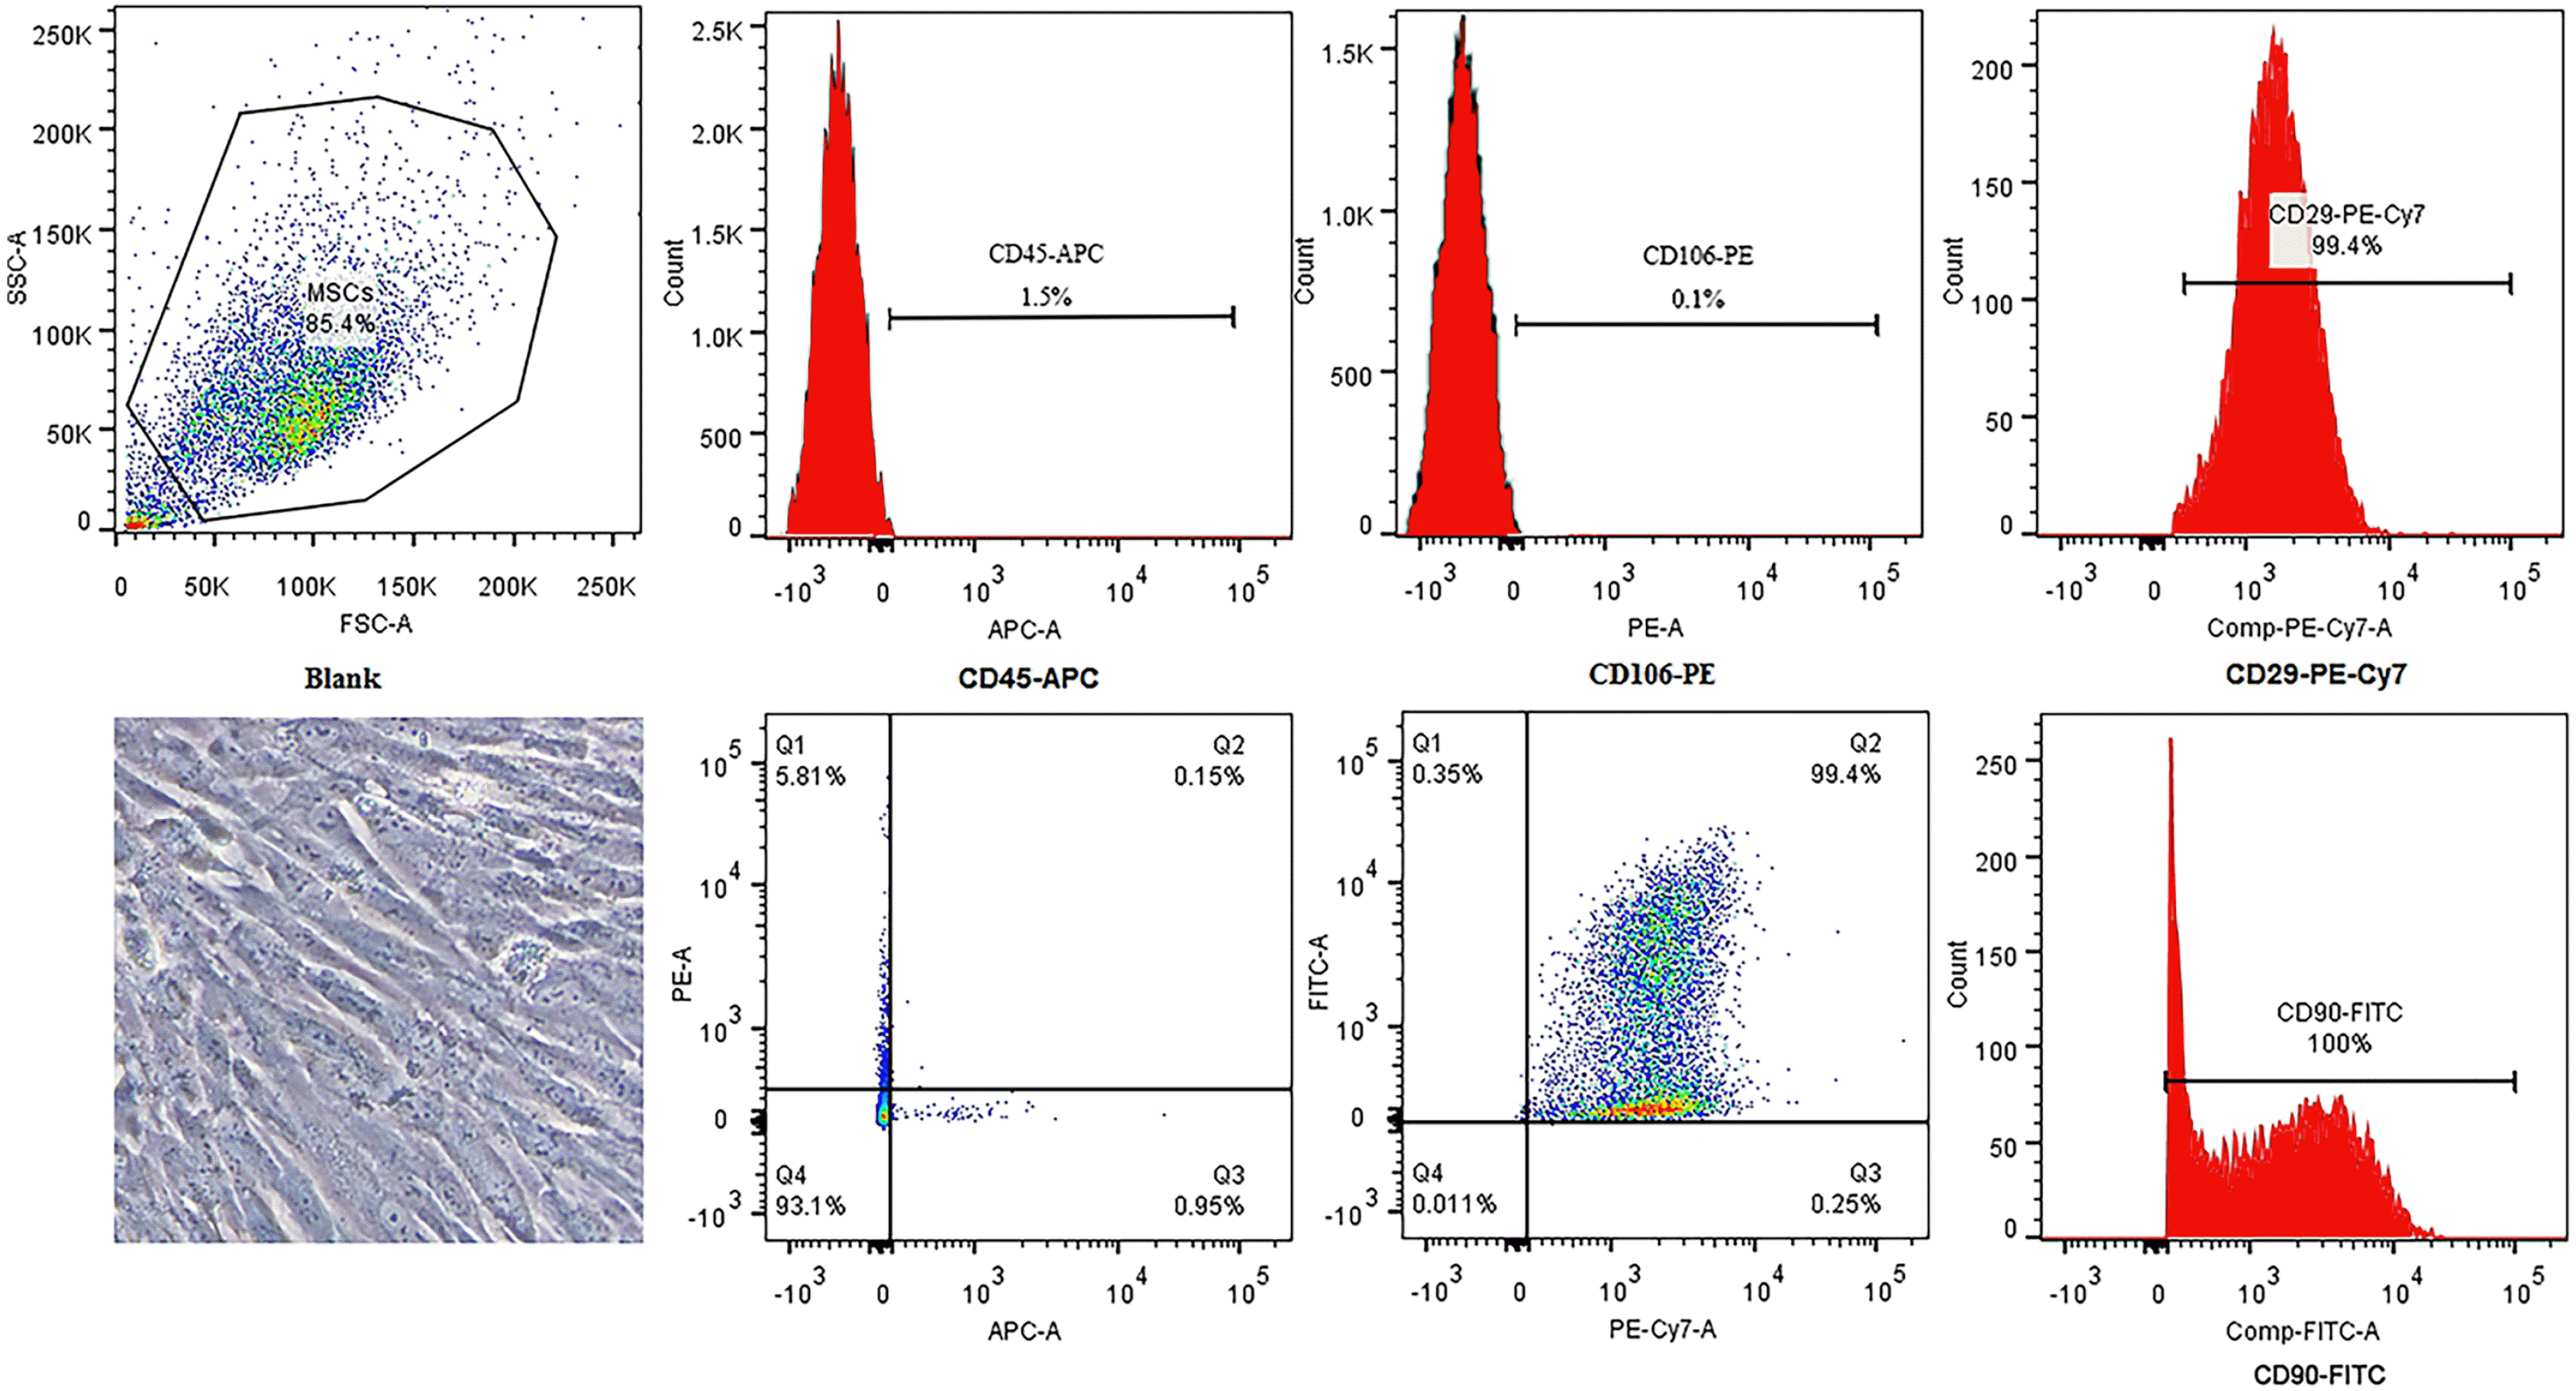
Fig. 2
Effects of SF-MSCs-CM on TGF-β-induced NRK-52E fibrosis at different time points. (A) The expression of α-SMA and Gal-3 in NRK-52E cells induced by TGF-β1 was detected by Western Blot after SF-MSCs-CM treatment. (B) Quantification of α-SMA. (C) Quantification of Gal-3. Results were normalized relative to the expression of GAPDH. N=3 (per group). Data are presented as mean±SD and analyzed by two-way ANOVA followed by Tukey post hoc testing. *p<0.05, vs. control group, #p<0.05, vs. TGF-β1+SF-MSCs-CM (24 h) group, ●p<0.05, vs. TGF-β1+SF-MSCs-CM (48 h) group, ▲p<0.05, vs. TGF-β1 +SF-DMEM (24 h) group, ◆p<0.05, vs. TGF-β1+SF-DMEM (48 h) group.
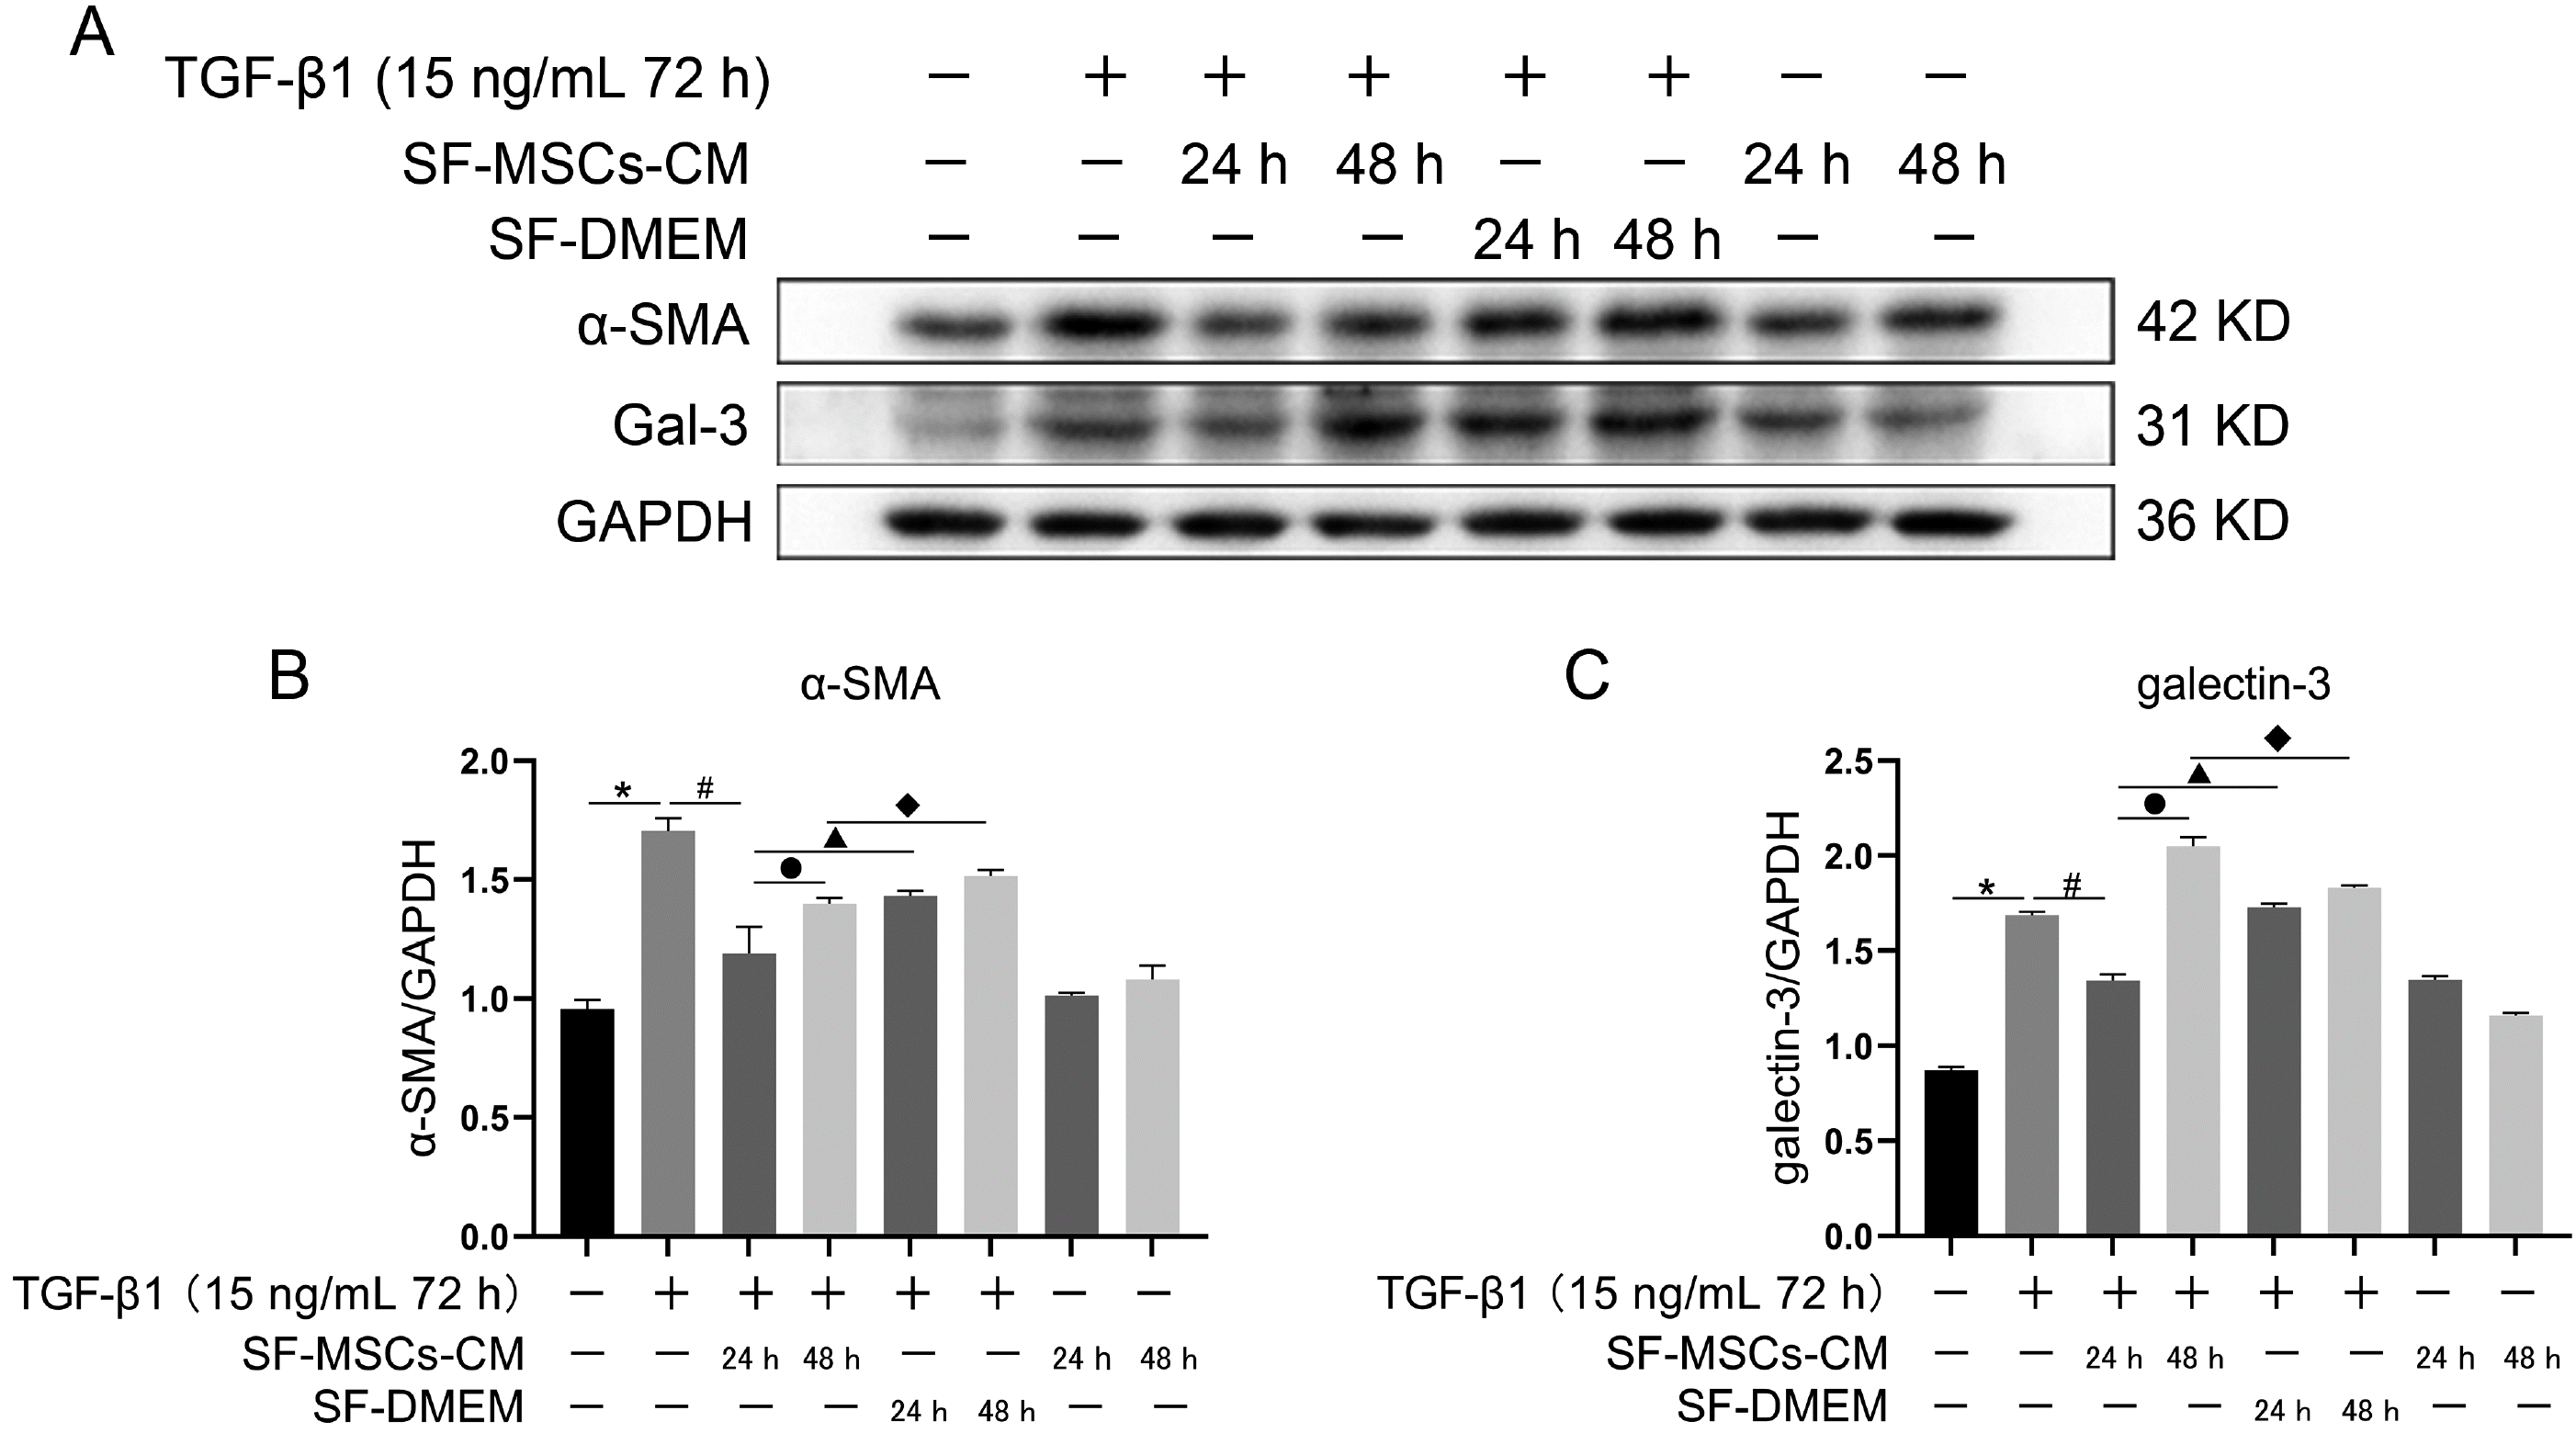
Fig. 3
Effects of SF-MSCs-CM on TGF-β1-induced NRK-52E cell fibrosis. Compared with TGF-β1 group, these fibrosis related indicators were notably downregulated in TGF-β1+SF-MSCs-CM group. Results were normalized relative to the expression of GAPDH. N=3 (per group). Data are presented as mean±SD and analyzed by two-way ANOVA followed by Tukey post hoc testing. *p<0.05, vs. control group, ★p<0.05, vs. TGF-β1+SF-MSCs-CM group, ▲p<0.05, vs. TGF-β1+SF-DMEM group, ●p<0.05, vs. SF-MSCs-CM group.
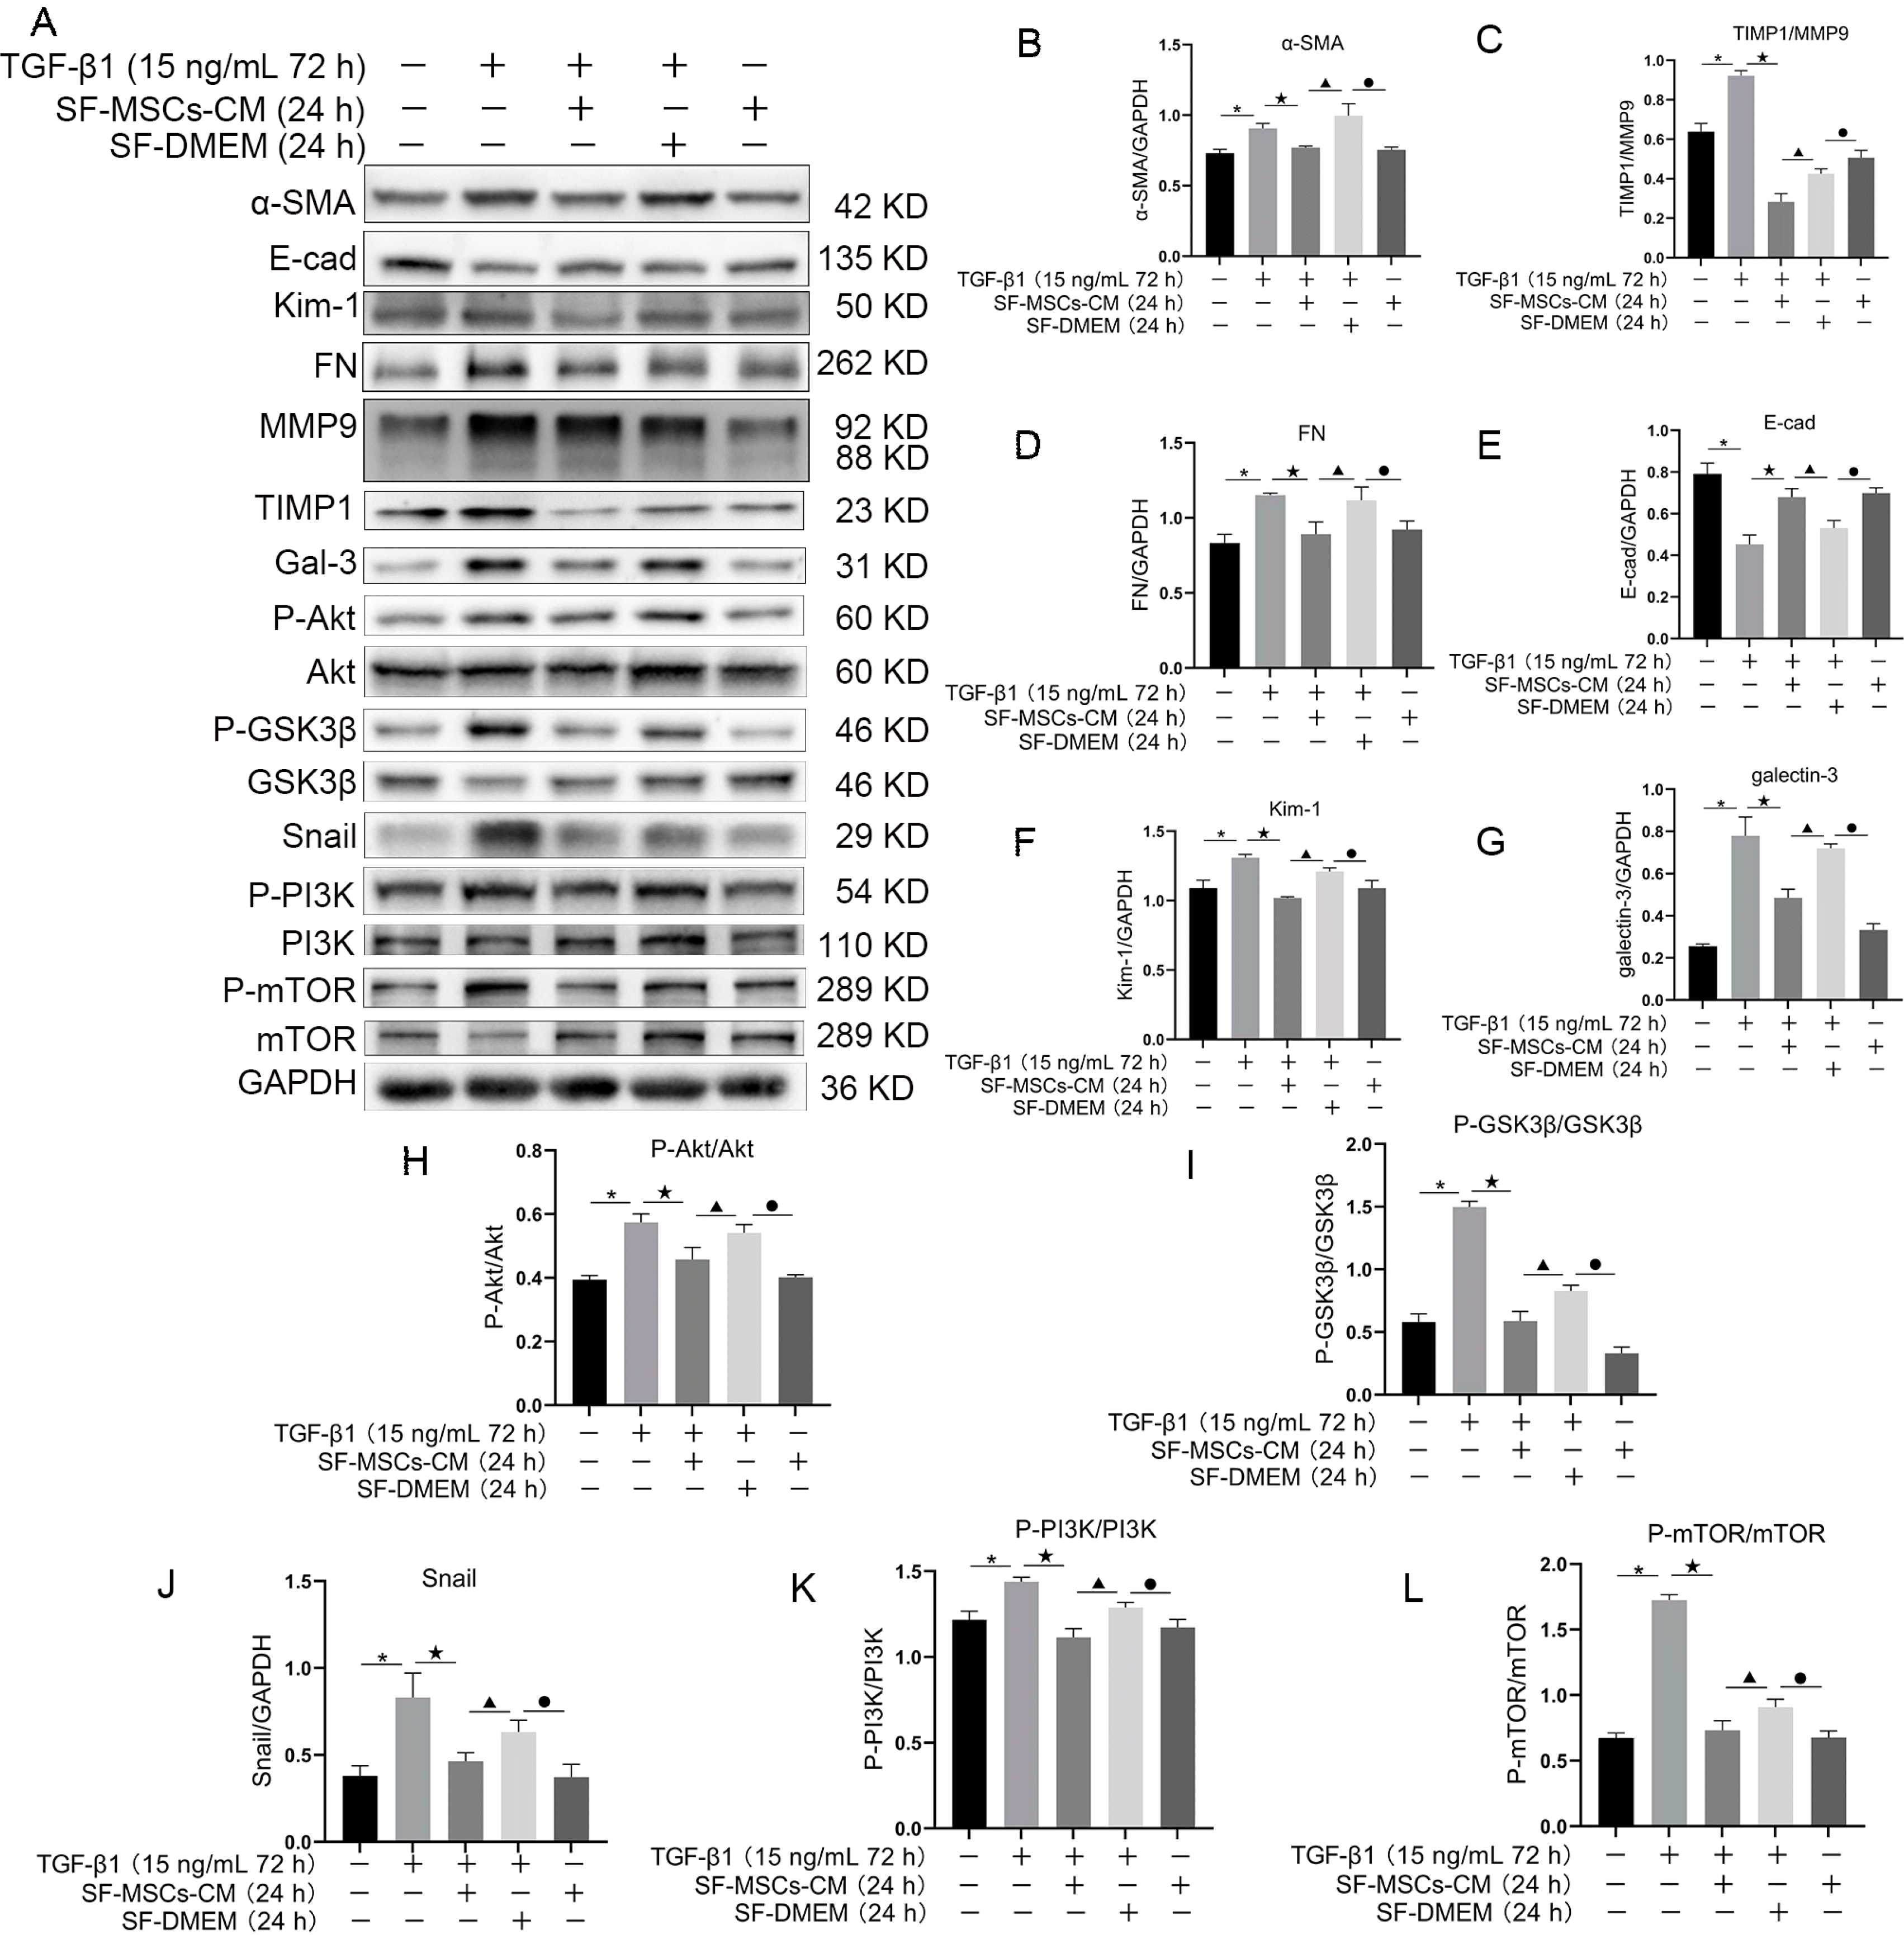
Fig. 4
Effects of SF-MSCs-CM on TGF-β1-induced NRK-52E cell autophagy at different time points. SF-MSCs-CM treatment upregulated the ratio of LC3B-II/I compared with the TGF-β1 group, accompanied by down-regulation of P62, SF-DMEM treatment after TGF-β1 treatment significantly downregulate the ratio of LC3B-II/I meanwhile upregulated the expression of P62 compared with the TGF-β1+SF-MSCs-CM group. However, the ratio of LC3B-II/I of SF-MSCs-CM treatment for 48 h after TGF-β1 treatment could have a downward trend compared with 24 h, P62 does the opposite. (A) Quantification of LC3B-II/I. (B) Quantification of P62. Results were normalized relative to the expression of GAPDH. N=3 (per group). Data are presented as mean±SD and analyzed by two-way ANOVA followed by Tukey post hoc testing. *p<0.05, vs. normal group, #p<0.05, vs. TGF-β1+SF-MSCs-CM group (24 h), ●p<0.05, vs. SF-MSCs-CM group (48 h), ▲p<0.05, vs. TGF-β1+SF-DMEM group (24 h), ◆p<0.05, vs. TGF-β1+SF-DMEM group (48 h), &p<0.05, vs. SF-MSCs-CM group (24 h).
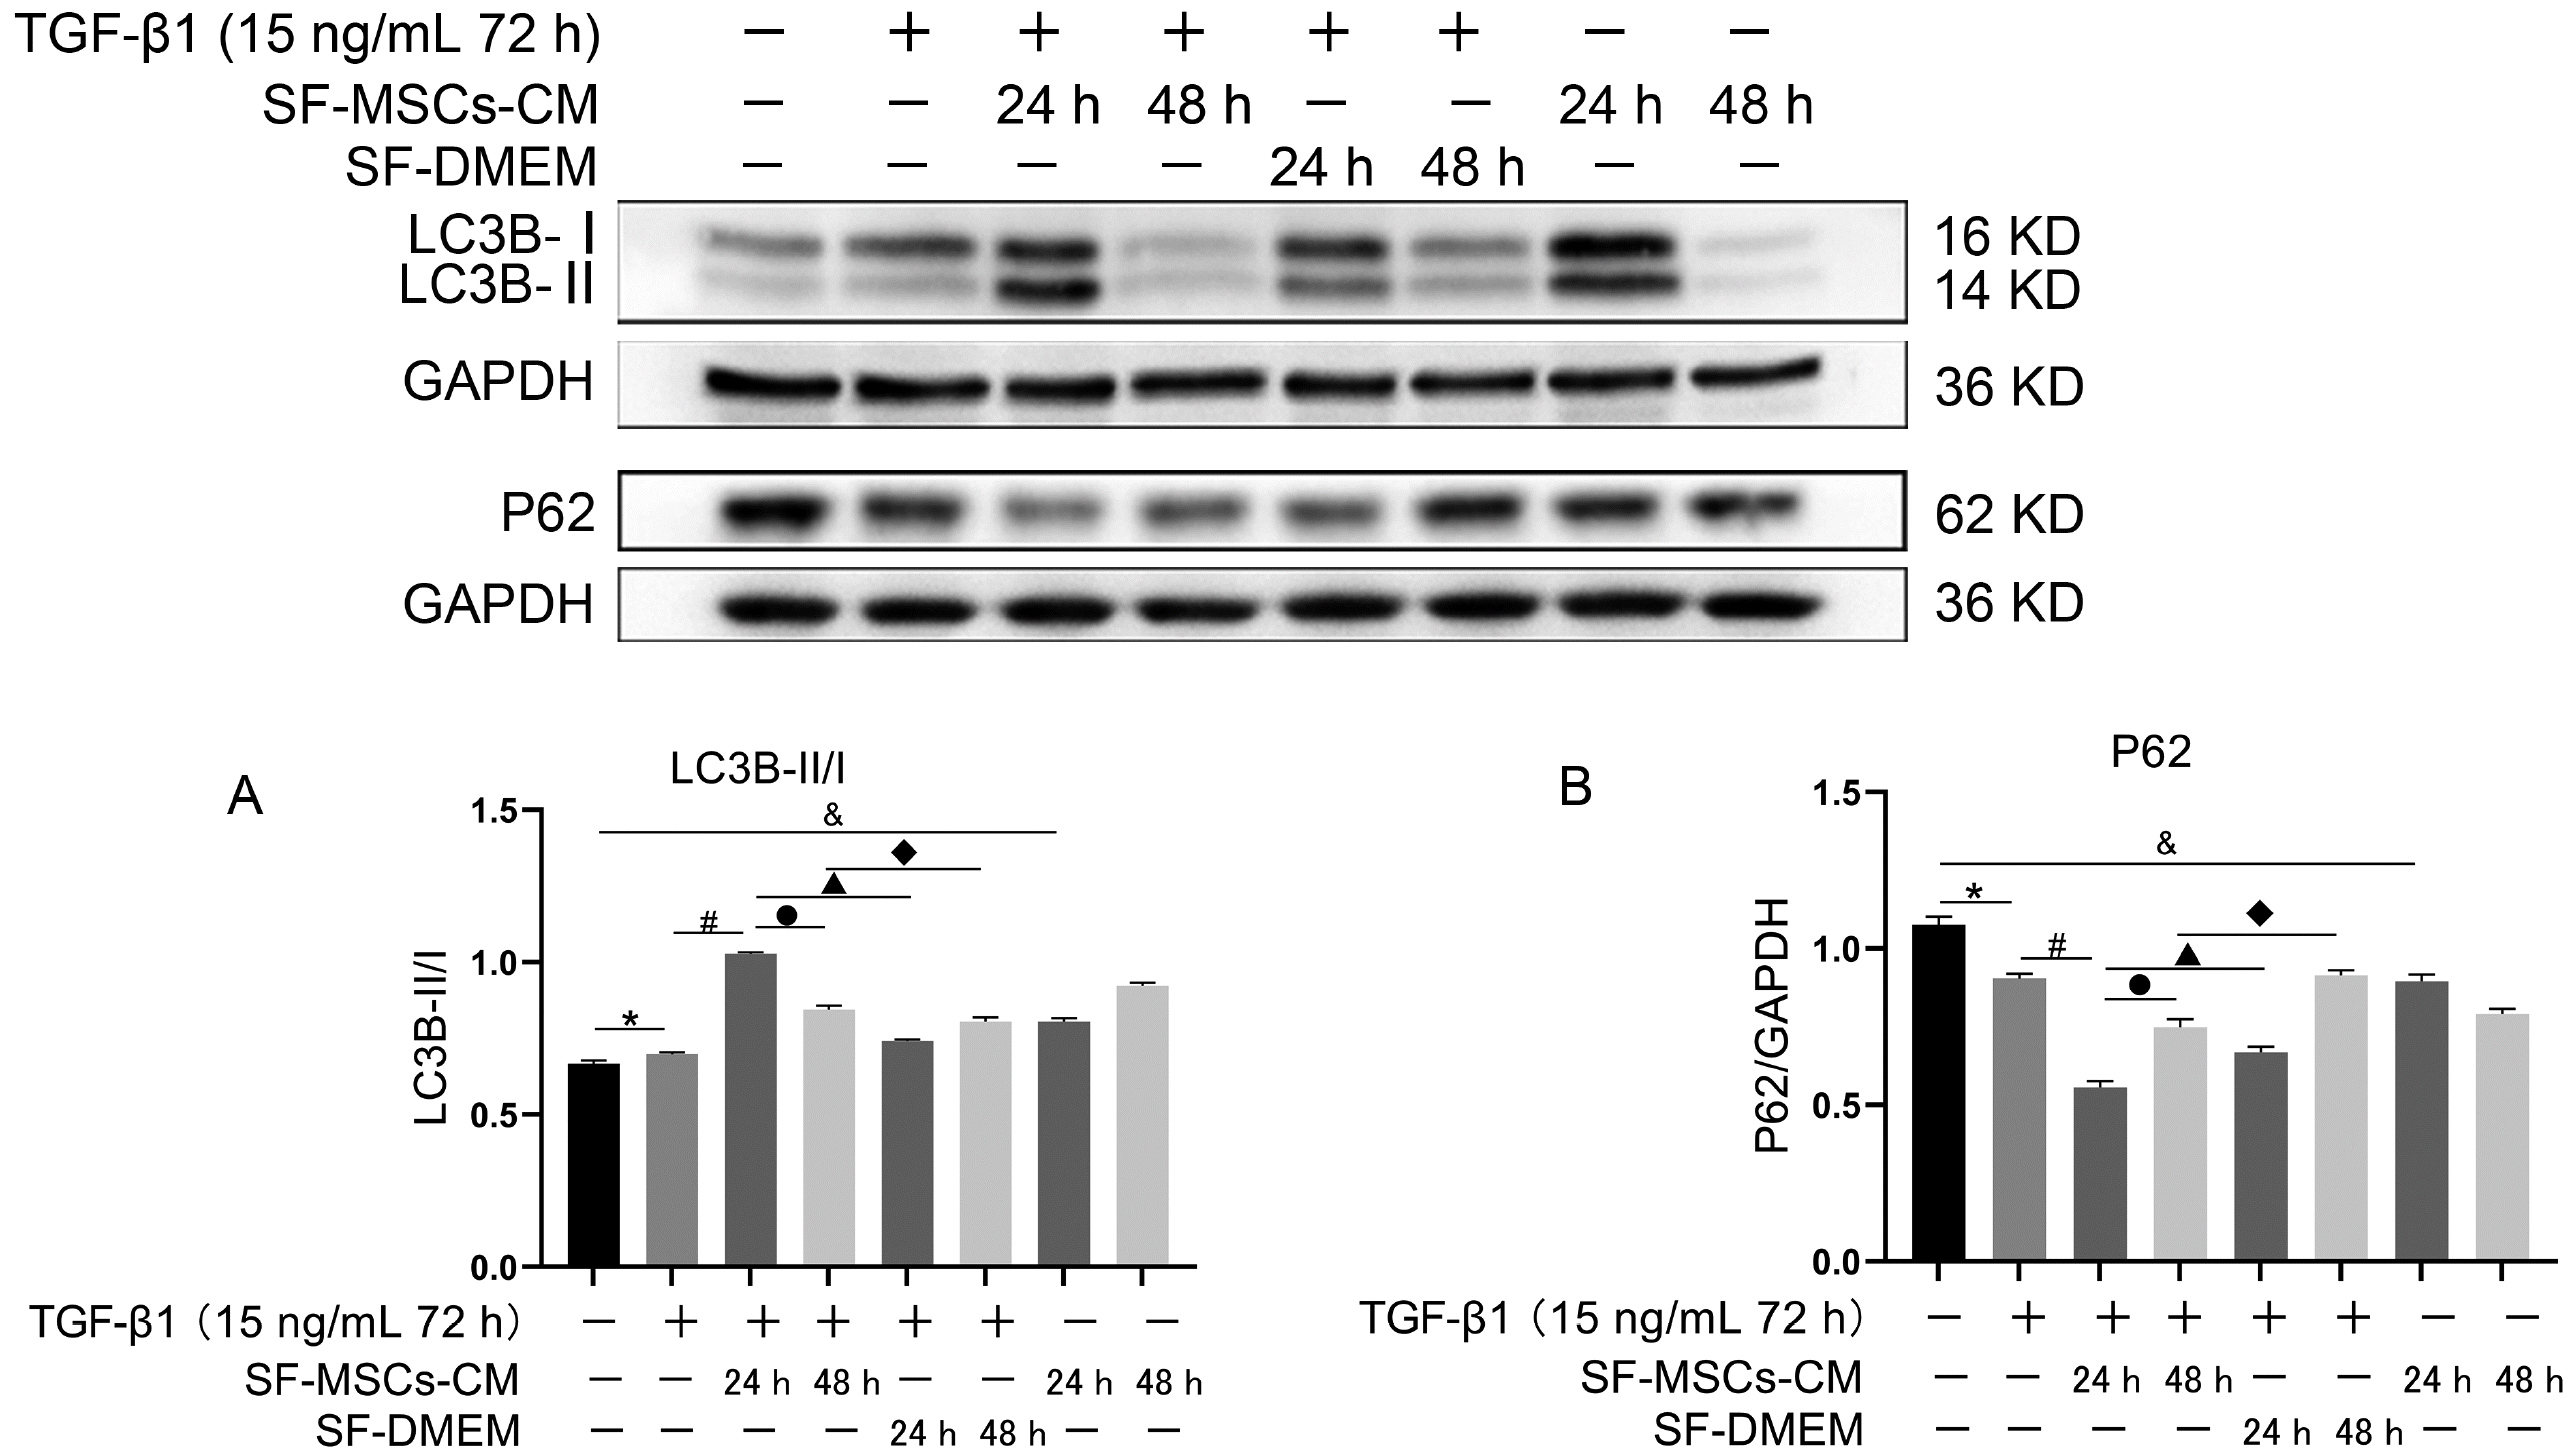
Fig. 5
The expression of Gal-3 in NRK-52E cells was detected by fluorescence microscope and western blot. Results were normalized relative to the expression of GAPDH. Results were normalized relative to the expression of GAPDH. N=3 (per group). Data are presented as mean±SD and analyzed by two-way ANOVA followed by Tukey post hoc testing. *p<0.05, **p<0.001 vs. control group. Scale bar (A)=200 μm, (B)=400 μm.
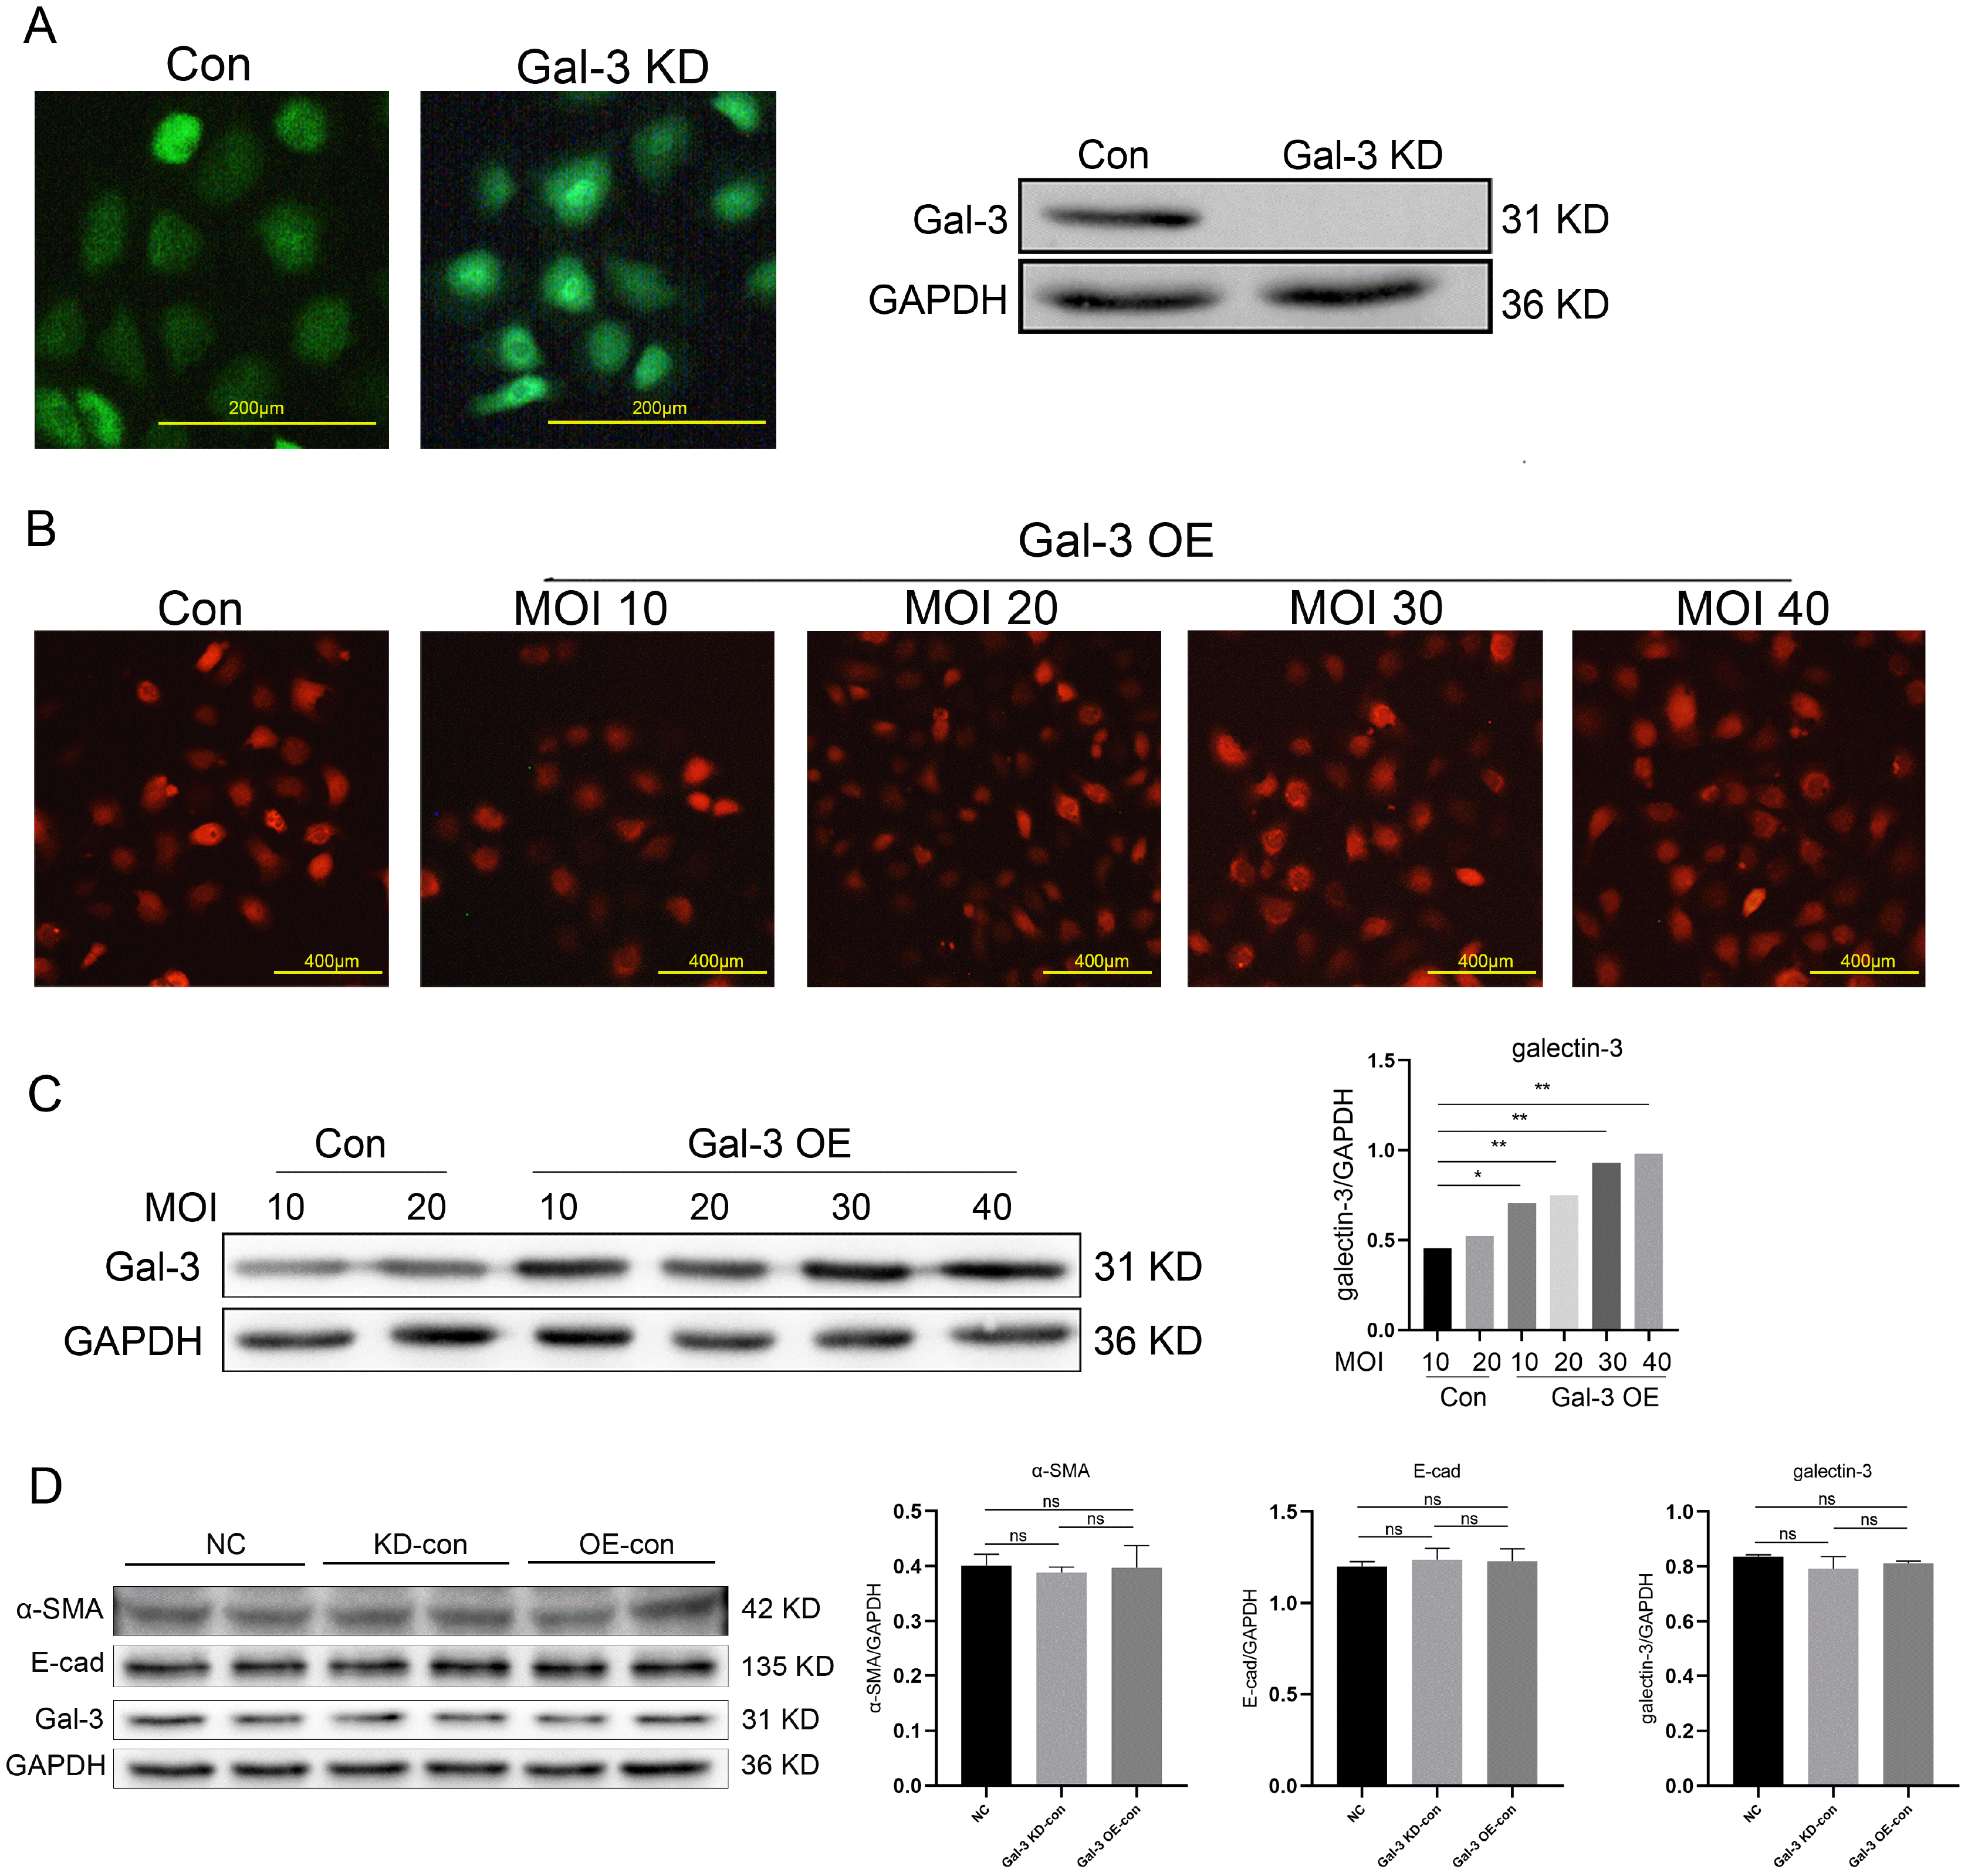
Fig. 6
Effects of SF-MSCs-CM on TGF-β 1-induced Gal-3 KD NRK-52E cells and Gal-3 OE NRK-52E cells fibrosis. The black and white bands illustrating the indicators identified through Western Blot (A), and statistical analysis of the ratio relative to GAPDH, including α-MSA (B), the ratio of TIMP1/MMP9 (C), FN (D), E-Cadherin (E), KIM-1 (F), Galectin-3 (G), the ratio of P-Akt/Akt (H) and P-GSK3β/GSK3β1 (I), and Snail (J). SF-MSCs-CM treatment significantly downregulated these indexes more surely than SF-DMEM treatment after TGF-β 1 treatment, except the expression of E-cad, which was upregulated. In the Gal-3 OE group, the indexes presented similar trends to those of the Gal-3 KD group, but higher than those of the same subgroups in the Gal-3 KD group. Results were normalized relative to the expression of GAPDH. N=3 (per group). Data are presented as mean±SD and analyzed by two-way ANOVA followed by Tukey post hoc testing. *p<0.05, vs. control group, ★p<0.05, vs. TGF-β 1+SF-MSCs-CM group, ▲p<0.05, vs. TGF-β 1+SF-DMEM group, ●p<0.05, vs. SF-MSCs-CM group; compared Gal-3 KD NRK-52E cells with Gal-3 OE NRK-52E cells, #p<0.05, vs. normal group, @p<0.05, vs. TGF-β 1 group, &p<0.05, vs. TGF-β 1+SF-MSCs-CM group, ◆p<0.05, vs. TGF-β 1+SF-DMEM group, ^p<0.05, vs. SF-MSCs-CM group.
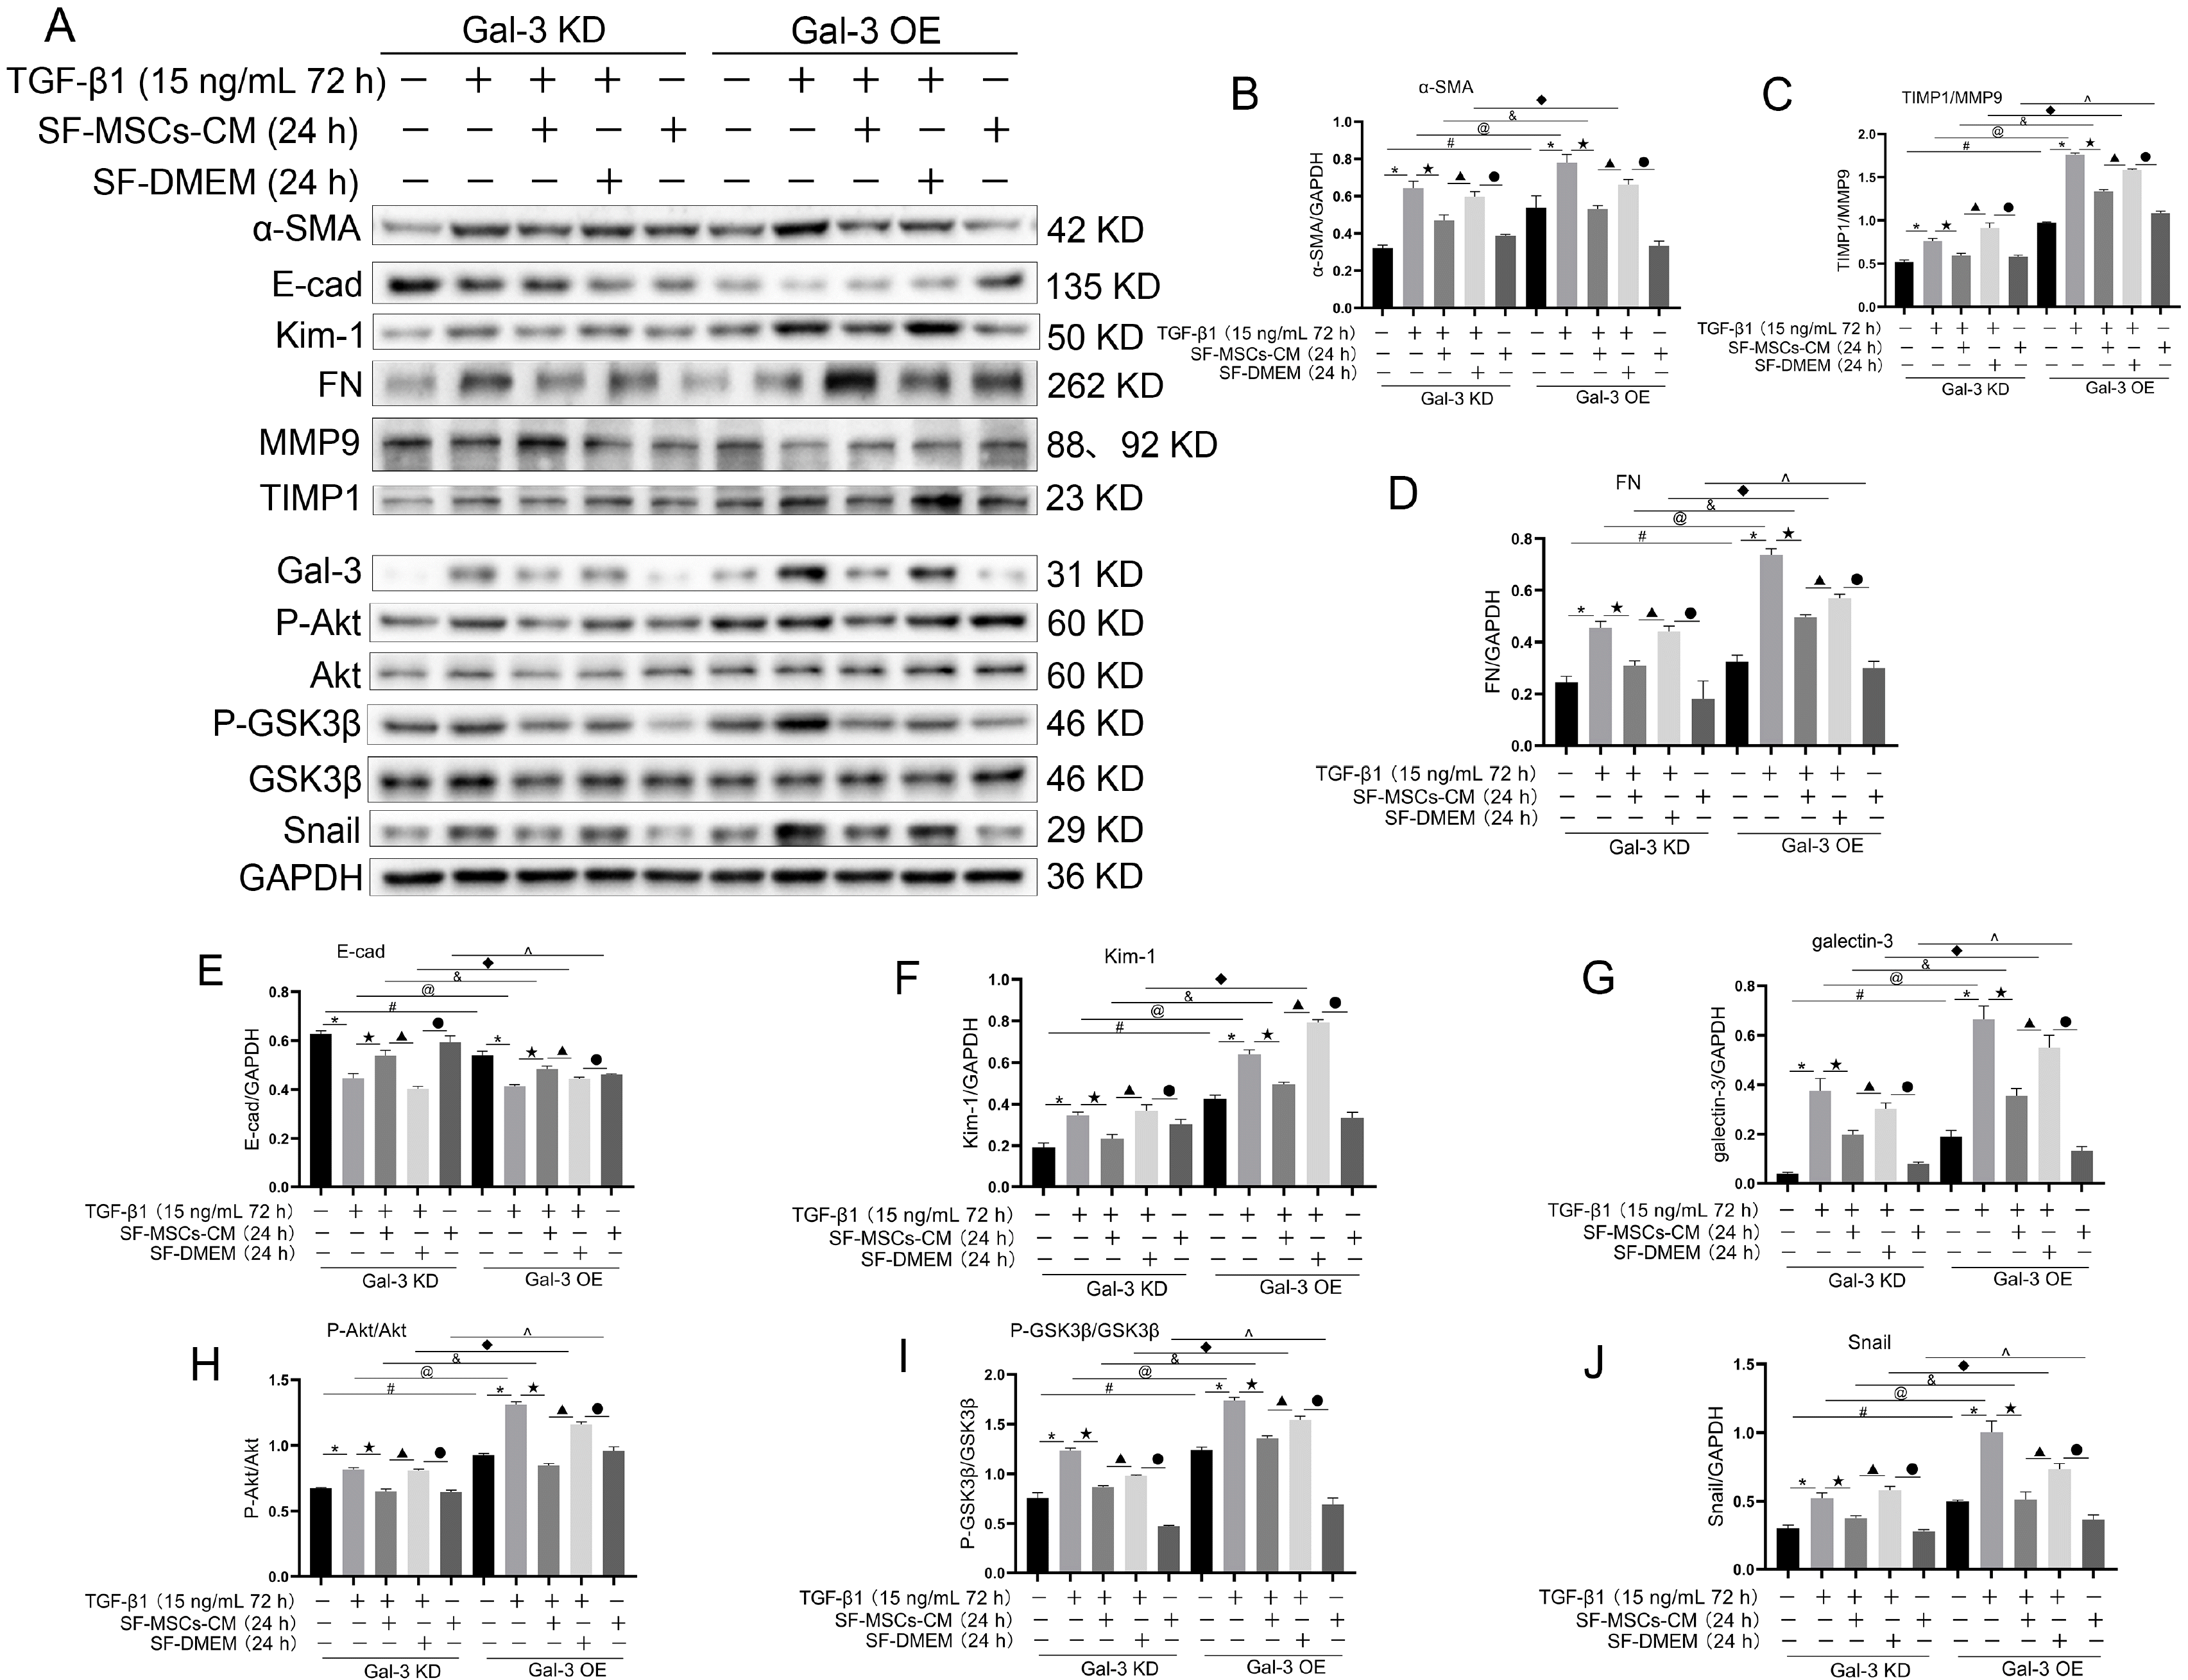
Fig. 7
Immunocytochemical staining of E-Cadherin and α-SMA in Gal-3 KD and Gal-3 OE NRK-52E cells. Gal-3 KD reduced the expre-ssion of α-SMA and increased the expression of E-Cadherin in NRK-52E cells, but an opposite trend appea-red in Gal-3 OE. TGF-β1 indeed increased the expression of α-SMA and decreased the expression of E-Cadherin in Gal-3 OE cell, which was more than in Gal-3 KD cells. The treatment of SF-MSCs-CM after TGF-β1 treatment reduced the expression of α-SMA and raised the expression of E-Cadherin in both Gal-3 KD cells and Gal-3 OE cells, but more obvious in Gal-3 KD cells than in Gal-3 OE cells. SF-DMEM treatment also downregulated the expression of α-SMA, worse than SF-MSCs-CM group. Bar=100 μm.
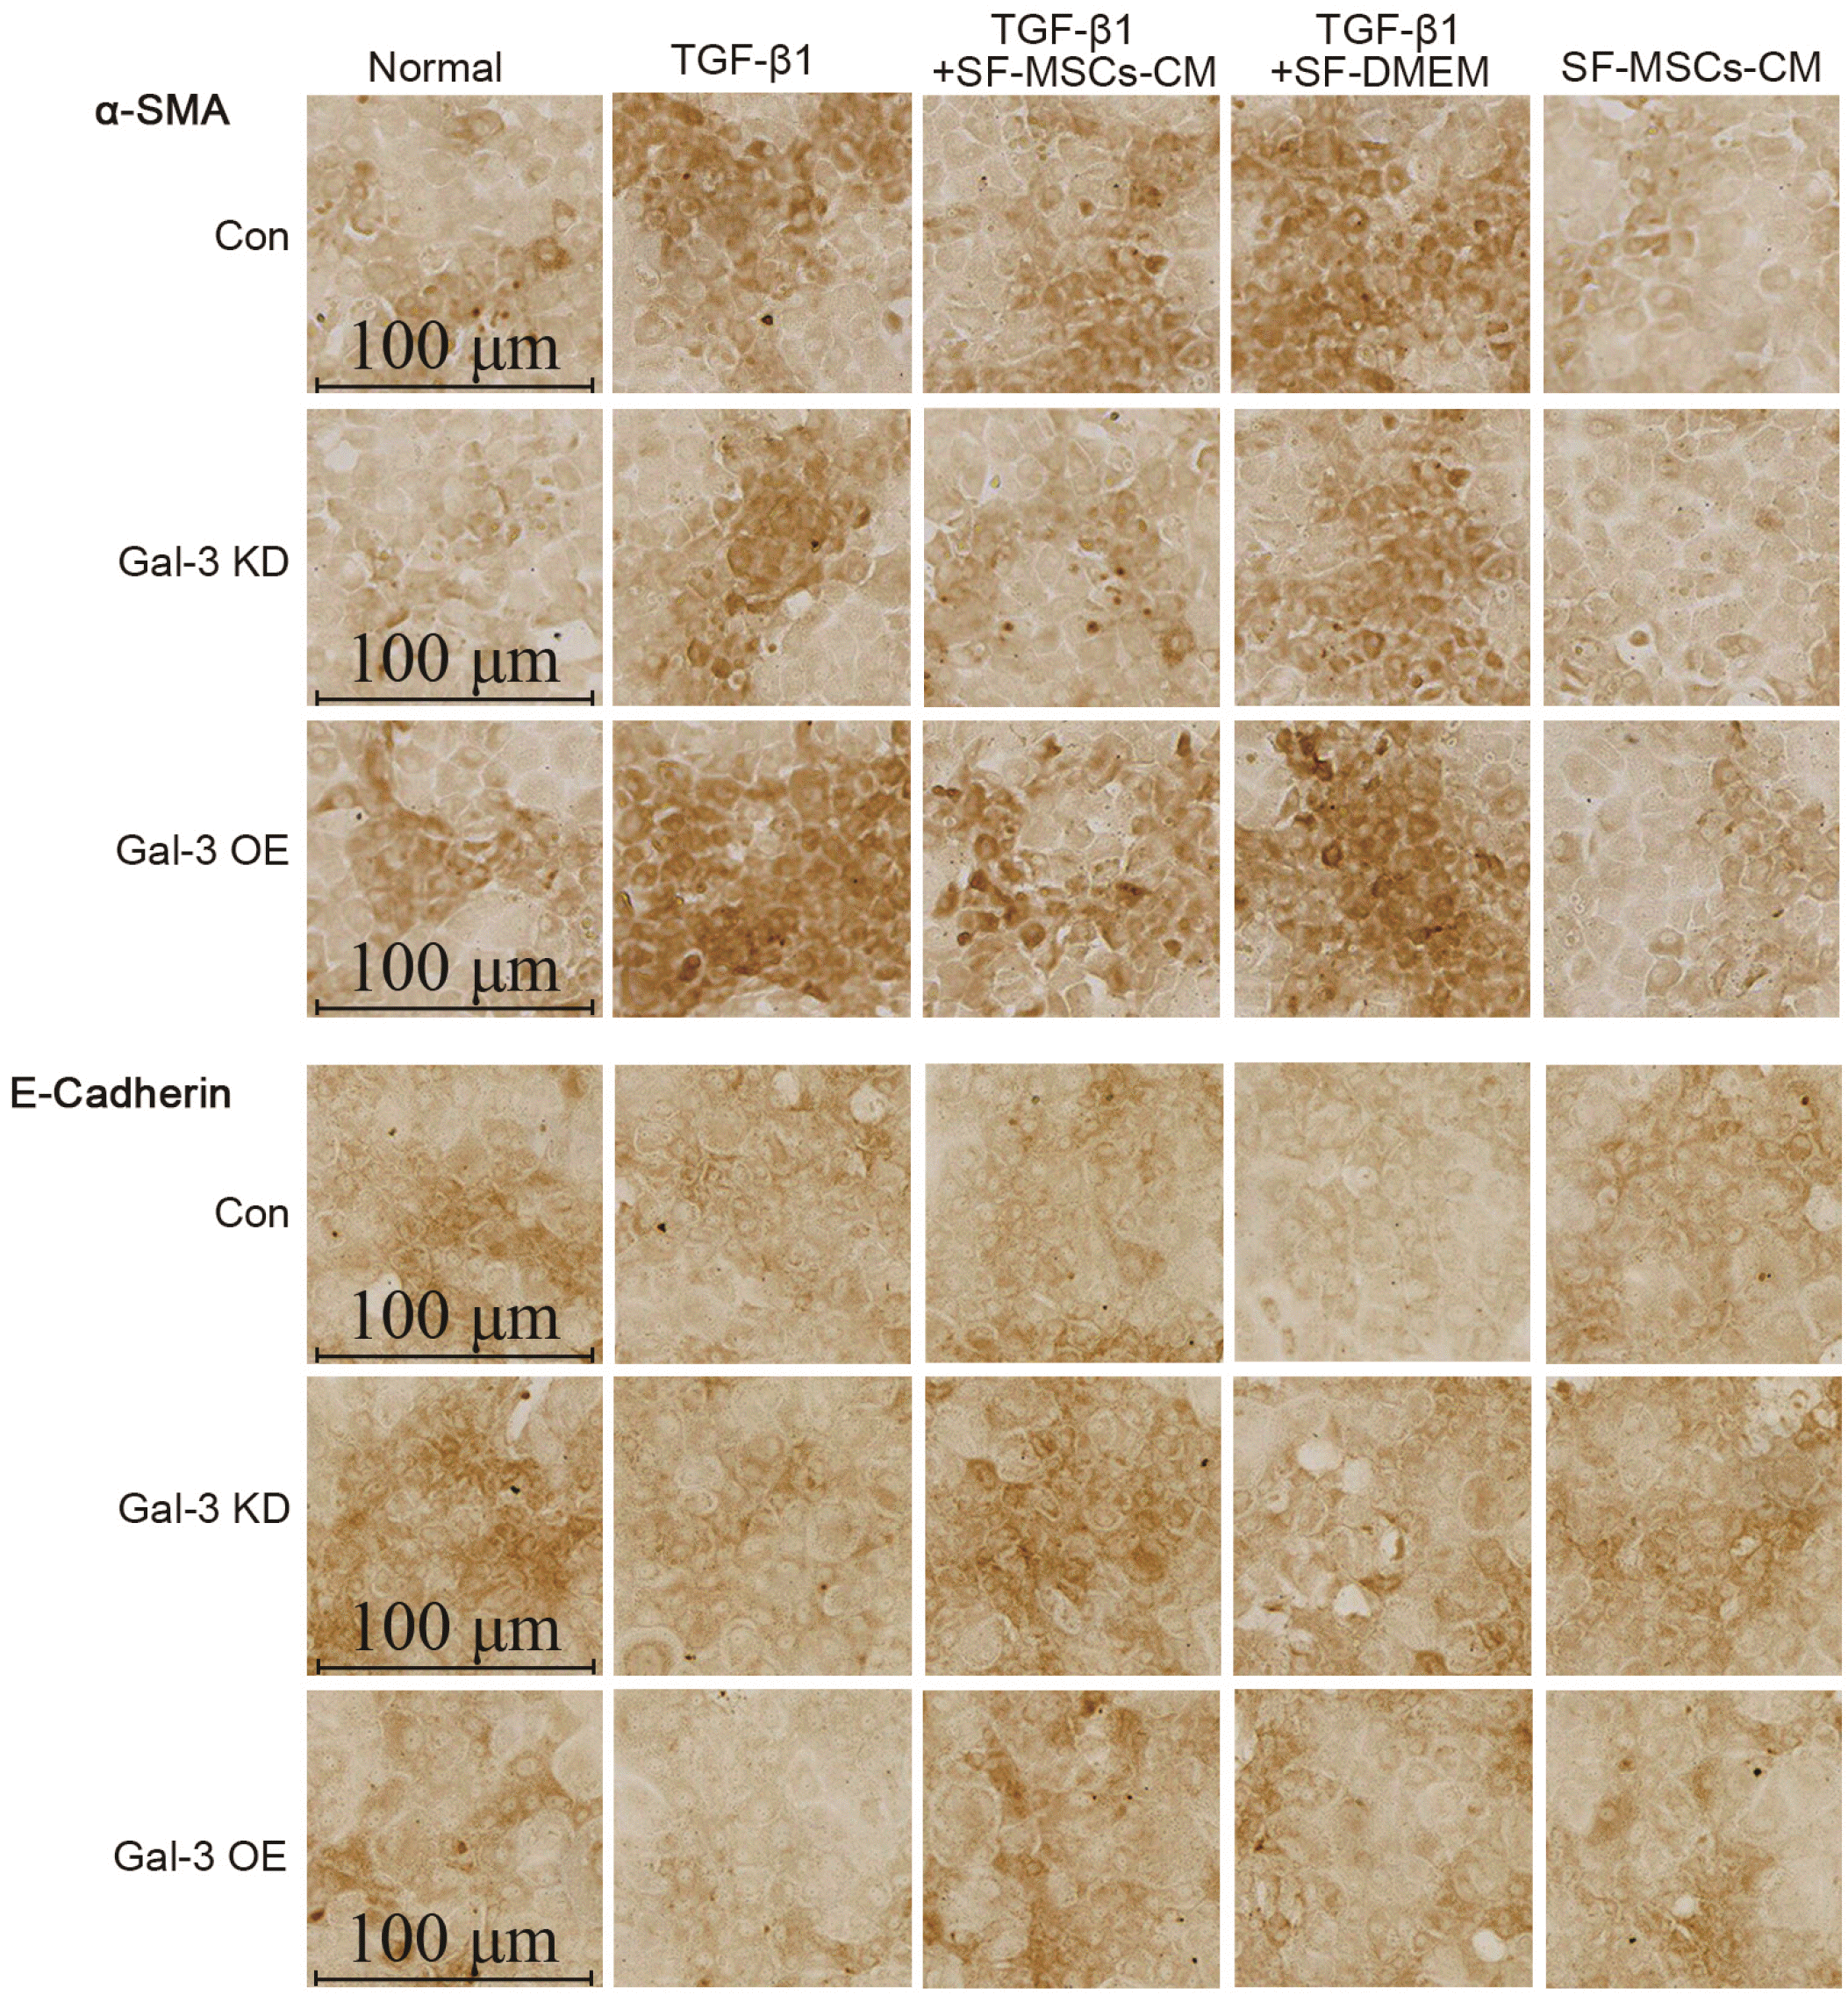
Fig. 8
Expression of autophagy related proteins. (A∼F), Whether in Gal-3 KD cells or in Gal-3 OE cells, SF-MSCs-CM treatment enhanced autophagy and simultaneously reduced fibrosis after TGF-β1 treatment. SF-DMEM treatment also appear the similar phenomenon, but less than those in TGF-β1+SF-MSCs-CM group, especially in Gal-3 OE cells. Results were normalized relative to the expression of GAPDH. N=3 (per group). Data are presented as mean±SD and analyzed by two-way ANOVA followed by Tukey post hoc testing. *p<0.05, vs. control group, ★p<0.05, vs. TGF-β1+SF-MSCs-CM group, ▲p<0.05, vs. TGF-β1 +SF-DMEM group, ●p<0.05, vs. SF-MSCs-CM group; compared Gal-3 KD NRK-52E cells with Gal-3 OE NRK-52E cells, #p<0.05, vs. normal group, @p<0.05, vs. TGF-β1 group, &p<0.05, vs. TGF-β1+SF-MSCs -CM group, ◆p<0.05, vs. TGF-β1+SF-DMEM group, ^p<0.05, vs. SF-MSCs-CM group.


 PDF
PDF Citation
 Print
Print


 XML Download