Journal List > Ann Rehabil Med > v.47(1) > 1516081584

KIM, Leigh, Choi, Lee, and Bang: Spinal Cord Injury Fact Sheet in Korea

Abstract

Spinal cord injury (SCI) has been recognized as a medically complex and life-disrupting condition. As the aging of the population accelerates, the trend of SCI has changed. This review aimed to provide comprehensive statistics and recent epidemiological changes in SCI and rehabilitation in Korea. All three insurance databases (National Health Insurance Service [NHIS], automobile insurance [AUI], and industrial accident compensation insurance [IACI]) were considered. These nationwide databases provide data on the current trends in term of incidence, etiology, and rehabilitation of SCI. Traumatic spinal cord injury (TSCI) was more frequent among the elderly in the NHIS compared to working age individuals in the AUI and IACI. In all three trauma-related insurance databases, male with TSCI outnumbered female. TSCI incidence per year was approximately 17 times higher among males than females, on average, in IACI. In all three insurances, the cervical level of TSCI was the most frequent. Although the ratio of SCI patients receiving rehabilitation treatment at primary and secondary hospitals increased for nine years, the increase in training on activities of daily living (ADL training) was found to be relatively small. This review provides a broader and comprehensive understanding of the incidence, etiology, and rehabilitation treatment of SCI in Korea.

INTRODUCTION

Spinal cord injury (SCI) has been recognized as a medically complex and life-disrupting condition that has been associated with high mortality rates in the past. However, in recent years, improvements in medical technology and social infrastructure have shifted the injury towards its perception as a personal and social problem that can be successfully overcome rather than as the end of a worthwhile or productive life [1]. The global SCI rate is estimated to be between 40 and 80 instances per million per year when summarizing studies on SCI rates by nation for all causes. This implies that each year, 250,000 to 500,000 people get SCI [1]. SCI patients are known to have many complications, such as neurogenic pain, stiffness, urination and defecation disorders, respiratory function depression, orthostatic hypotension, autonomic dysreflexia, heterotopic ossification, and osteoporosis, as well as motor function deterioration [2]. Conversely, SCI causes enormous socio-economic loss. According to a study conducted in the United States, the medical cost for quadriplegia patients with cervical 4 or higher is approximately $1.16 million per person in the first year, and the medical expenses and maintenance costs for daily life thereafter are approximately $200,000. Assuming the age of 25, it was analyzed that they would need $5.16 million over their lifetime [3]. SCI is a disease that cannot be cured once it occurs and requires continuous rehabilitation. In addition, associated scale of socio-economic loss is difficult for individuals and families to bear. Therefore, it is very important to prevent the occurrence of SCI; to this end, it is necessary to confirm epidemiological characteristics such as the cause, occurrence, and prevalence of SCI from a continuous perspective.
According to a study that uses data collected from one medical institution for 30 years, 3,395 patients were hospitalized with a diagnosis of traumatic spinal cord injury (TSCI). The age at which TSCI occurs has gradually increased from 32.4 years in 1990 to 40.1 years in 2000s and 47.1 years in 2010. In contrast, the main causes of SCI were road traffic accidents and falls. Among all SCI patients, traumatic SCI due to road traffic accident decreased from 65% in the 1990s to 41.9% in the 2010s, but injuries due to falls increased from 24.9% in the 1990s to 46.3% in the 2010s [4]. According to a retrospective study that used the Health Insurance Review and Assessment Service (HIRA), 12,137 people were diagnosed with acute SCI in South Korea from 2007 to 2017. The incidence of SCI was higher in males than that in females, and by age group, it was the highest in those in their 50s [5]. However, it is challenging to understand the full scale, because only patients who visited a single medical institution were included in the study, even if the study establishes a significant trend of SCI through a long-term retrospective study. To the contrary, studies using HIRA data were able to confirm the overall size of patients included in health insurance, but there were limitations because they did not include data on separately operated insurance such as automobile insurance (AUI) and industrial accident compensation insurance (IACI). Considering that each country’s medical system is different and the coverage of trauma patients included in each data is different, the previous studies included all patients with TSCI in South Korea without omission is unclear. These limitations make it difficult to identify the incidence rate of TSCI in South Korea. Globally, only a few countries have a national health insurance scheme and provide universal health coverage. In addition, even in countries with national health insurance schemes, coverage for traumatic injuries is often covered by different medical systems such as the German Statutory Accident Insurance or Swiss Accident Insurance. Therefore, to examine the incidence of trauma patients in a certain country, reliable national data must be obtained, and trauma patients must be identified from all trauma-related national data. In this respect, South Korea is renowned for having the best national health insurance system worldwide, providing lifetime universal medical coverage for all citizens through the national health insurance system. Furthermore, South Korea provides trauma patients with special medical coverage tailored to the characteristics of each trauma through the national industrial accident insurance and compulsory AUI. South Korea is a suitable country to estimate trauma incidence using national insurance databases.

EPIDEMIOLOGICAL TRENDS OF SPINAL CORD INJURY IN SOUTH KOREA

Traumatic spinal cord injury by age and sex

In general, spinal cord injuries do not happen very frequently. There are differences in incidence and prevalence between nations, and even within a single nation, there are regional and temporal variations in incidence. According to a study by Kumar et al. [6], approximately 768,473 new cases of TSCI occur each year, worldwide; accounting for 10.5 new cases per 100,000 people. At 3,771 medical facilities in Japan, TSCI that occurred between January 1 and December 31, 2018 were the subject of a multicenter retrospective analysis. According to reports, there are 49 cases of TSCI for every million people [7]. In Taiwan’s population-bases study, the average incidence of TSCI from 2000 to 2003 was 61.61 cases per 100,000 persons [8]. From 2001 to 2007, there were 82,720 cases of spinal trauma in China, or 82 cases per million people [9]. When the age-adjusted incidence of TSCI in South Korea’s health insurance data was compared between 2009 and 2018, it increased from 33.73 in 2009 to 38.14 per 1 million population in 2018. Additionally, in the case of AUI, the number decreased from 13.88 in 2014 to 11.57 in 2018, and in IACI, from 22.02 in 2014 to 28.92 in 2018 [10]. Approximately 1,103 people are diagnosed with acute SCI on average yearly, and the average number of cases of SCI in male is 805 per year, higher than that in female (297 cases). Although the number of SCI patients for 11 years from 2007 to 2017 repeatedly increases and decreases, the overall trend is increasing [5].
The age at the onset of SCI increased from 29 years in the 1970s to 43 years in 2015 in the United States; in Japan, people in their 70s were reported as the latest age group [7]. When examining the age at which TSCI occurs in South Korea according to insurance type, health insurance showed a trend of rapid aging, especially in the group after 40–49 years, and the highest value was shown in the group over 70 years. In the case of IACI and AUI, the incidence was high in the 50–59 years group; in the 30–39 years—the main working age group, but the occurrence of TSCI patients in AUI was higher than that in the IACI (Fig. 1) [10].
Regarding male to female ratio, 78% of SCI patients in the United States are male, whereas 22% of them are female—approximately 3.5 times as many male as female [3]. In Japan, the sex ratio of TSCI patients was reported to be 3:1 [7]. For the distribution of TSCI by insurance type in South Korea, in all three trauma-related insurance databases, the number of male with TSCI was higher than the number of female. In particular, in the case of IACI, male TSCI incidence was approximately 17 times higher than female TSCI incidence per year on average, showing the largest gap between sexs (Table 1) [10].

The level and severity of injuries

According to the National Spinal Cord Injury Statistical Center (NSCISC) report in United States, complete damage was more common than incomplete damage in the past, but complete damage is decreasing and incomplete damage is increasing recently. In particular, incomplete tetraplegia accounted for 28.1% in the 1970s, but increased to 42.2% during the 2015–2019 period. Furthermore, the case of complete tetraplegia was 25.3% in the 1970s, but decreased to 11.3% during the 2015–2019 period. Similar trends were seen in South Korea, where incomplete paraplegia slightly increased from 16.8% to 21.9% during the same time, while incomplete tetraplegia increased from 23.9% to 36.9% [11]. In Japan, 88.1% of all TSCI cases were cervical cord injuries, while 10.1% involved thoracic and lumbar injuries [7]. Concurrently according to a recent study based on South Korea’s trauma-related insurance database, the most common body region of SCI was the cervical spine in all the three insurances. Cervical spine coverage was 73.4% in AUI, 63.5% in IACI, and 55.6% in National Health Insurance Service (NHIS) when comparing each insurance (Table 2).

Etiology of spinal cord injury

The causes of SCI vary according to age. For the young age group, most of the causes are traumatic injuries such as road traffic accidents, work-related injuries, and sports-related injuries [12,13], however, for the elderly, non-traumatic lesions such as spinal cord vascular disease, spinal cord tumors, spinal cord inflammation, and spinal cord degenerative lesions are the causes. In some cases, SCI can occur even with minor trauma when accompanied by degenerative changes such as spinal stenosis [2]. Road traffic accidents were the most frequent cause of injuries in the United States, accounting for 38.6% of all cases, followed by falls (32.2%), gunshot wounds (14.4%), sports-related injuries (7.8%), medical injuries (4.2%), and other cases (3.2%) [3]. In the case of Japan, there was a clear difference in the cause of TSCI by age. Sports-related injuries had the highest incidence among those aged 10 to 19, whereas traffic accidents had the highest distribution among those aged 0 to 9. In contrast, the TSCI by fall indicated an increase in the proportion with rising age, with the exception of 0–9 years [7]. According to a study of 3,076 patients who were hospitalized for SCI over a 20-year period, from 1994 to 2014, 80.9% of all SCI patients were injured due to trauma, of which 55.3% were caused by car accidents, 32.1% by falls, 6.1% by sports injuries, and 0.9% by injuries from violence. In contrast, it was found that the leading cause of SCI shifted from road traffic accidents to falls when looking at the results of determining the source of injury by separating the findings from 1994–2000 and 2008–2014 [14].

Rehabilitation usage of patients with traumatic spinal cords injury

The present state of rehabilitation therapy for TSCI patients is shown in Table 3, based on database from the NHIS. By examining the rehabilitation treatment status of patients with traumatic SCI, the proportion of Rehabilitative Development Therapy for Disorder of Central Nervous System (RDT) performed at the beginning of hospitalization during rehabilitation treatment increased from 27.3% in 2009 to 39.2% in 2018. At the first hospitalization, the percentage of training on activities of daily living (ADL training) pertaining to patients’ return to their homes and social environments increased marginally from 18.4% in 2009 to 23.2% in 2017. The proportion of RDT in the 2nd inpatient hospital increases dramatically, while ADL training does not change. Table 4 shows the length of stay for patients with TSCI by sex and age group from 2009 to 2017. The length of stay for TSCI decreased in both male and female, but it was greater in male. A comparison of length of stay by age group showed a decrease in almost all age groups from 2009 to 2018.

CONCLUSION

Epidemiological statistics have only recently been released in South Korea, and all those that have been on a limited scale and retrospective in nature—the majority of them only containing information on patients who were hospitalized in certain areas or hospitals. It is challenging to utilize it to examine associated epidemiological traits. Furthermore, the causes of TSCI are changing. In the past, the main cause of TSCI in South Korea was traffic accident, accounting for 57.6% of all TSCI patients [15], however, it was found that TSCI caused by road traffic accidents gradually decreased and injuries caused by falls increased in the 2000s and 2010s. [4]. Also, while traumatic SCI is decreasing, nontraumatic SCI is increasing [16]. The rise in SCI by fall is associated with population aging [17,18], although domestic discussion on the relationship between aging and SCI are weak. Additionally, there is inadequate information on the type and amount of rehabilitation treatment given to SCI patients and how quickly therapeutic interventions are initiated after injury. Most SCI patients find it challenging to resume their pre-injury social life. For instance, 13.0% of 303 respondents to a 2012 study by the Korea Spinal Cord Injury Association reported to having a job before their injury, compared to 69.6% prior. Most of them were unable to return to their original jobs after being injured [14]. It is obvious that SCI is a condition that needs extensive rehabilitation over a long period of time. Early and appropriate rehabilitation treatment is important in preventing joint contractures, muscle weakness, and bone density loss in SCI patients [19]. The future social and economic consequences of SCI will be lowered, nevertheless, partly by enhancing the level of functional recovery via early, intense rehabilitation and assisting individuals in adjusting to society and family. In the future, a survey system for spinal cord injuries at the national level must be created as soon as possible in order to study epidemiological variables such as the cause, level and degree of injury in the context of changes in population structure. This review considered three trauma-related insurance databases to examine the incidence, causes, and rehabilitation of TSCI. However, it is essential to consider non-traumatic SCI with TSCI to obtain a comprehensive view of SCI in South Korea.

Notes

Jong Hwa Lee and Moon Suk Bang are Editorial Board members of Annals of Rehabilitation Medicine. The authors did not engage in any part of the review and decision- making process for this manuscript. Otherwise, no potential conflict of interest relevant to this article was reported.

Conceptualization: Bang MS, KIM HK, Leigh JH. Methodology: KIM HK, Leigh JH, Lee JH. Formal analysis: KIM HK, Choi Y. Funding acquisition: Bang MS. Project administration: Bang MS. Visualization: KIM HK, Leigh JH. Writing – original draft: KIM HK, Leigh JH, Bang MS, Lee JH. Writing – review and editing: Bang MS, Lee JH, KIM HK, Leigh JH. Approval of final manuscript: all authors.

REFERENCES

1. Bickenbach J, Officer A, Shakespeare T, von Groote P. International perspectives on spinal cord injury. Geneva: World Health Organization;2013.
2. Shin H. Etiology and epidemiology of spinal cord injury in Korea. J Korean Med Assoc. 2020; 63:589–95.
3. National Spinal Cord Injury Statistical Center. Spinal Cord Injury Model Systems. Complete public version. Birmingham: University of Alabama at Birmingham;2013.
4. Lee BS, Kim O, Ham D. Epidemiological changes in traumatic spinal cord injuries for the last 30 years (1990-2019) in South Korea. Spinal Cord. 2022; 60:612–7.
5. Choi SH, Sung CH, Heo DR, Jeong SY, Kang CN. Incidence of acute spinal cord injury and associated complications of methylprednisolone therapy: a national population-based study in South Korea. Spinal Cord. 2020; 58:232–7.
6. Kumar R, Lim J, Mekary RA, Rattani A, Dewan MC, Sharif SY, et al. Traumatic spinal injury: global epidemiology and worldwide volume. World Neurosurg. 2018; 113:e345–63.
7. Miyakoshi N, Suda K, Kudo D, Sakai H, Nakagawa Y, Mikami Y, et al. A nationwide survey on the incidence and characteristics of traumatic spinal cord injury in Japan in 2018. Spinal Cord. 2021; 59:626–34.
8. Yang NP, Deng CY, Lee YH, Lin CH, Kao CH, Chou P. The incidence and characterisation of hospitalised acute spinal trauma in Taiwan--a population-based study. Injury. 2008; 39:443–50.
9. Liu P, Yao Y, Liu MY, Fan WL, Chao R, Wang ZG, et al. Spinal trauma in mainland China from 2001 to 2007: an epidemiological study based on a nationwide database. Spine (Phila Pa 1976). 2012; 37:1310–5.
10. Choi Y, Kim YE, Leigh JH, Lee YS, Kim HK, Yi YG, et al. Comparison of trends in the incidence of traumatic spinal cord injury in daily life, automobile accidents, and industrial accidents: a national multi-insurance study in Korea. J Korean Med Sci. 2023; 38:e26.
11. Shin JC, Kim DH, Yu SJ, Yang HE, Yoon SY. Epidemiologic change of patients with spinal cord injury. Ann Rehabil Med. 2013; 37:50–6.
12. Jain NB, Ayers GD, Peterson EN, Harris MB, Morse L, O’Connor KC, et al. Traumatic spinal cord injury in the United States, 1993-2012. JAMA. 2015; 313:2236–43.
13. Cripps RA, Lee BB, Wing P, Weerts E, Mackay J, Brown D. A global map for traumatic spinal cord injury epidemiology: towards a living data repository for injury prevention. Spinal Cord. 2011; 49:493–501.
14. Han ZA, Lee BS, Kim W, Lee SJ, Im HJ, Kim C, et al. People with spinal cord injury in Korea. Am J Phys Med Rehabil. 2017; 96(2 Suppl 1):S83–5.
15. Park CI, Shin JC, Kim SW, Jang SH, Chung WT, Kim HJ. Epidemiologic study of spinal cord injury. J Korean Acad Rehabil Med. 1999; 23:267–75.
16. Lee BS, Kim O, Ham D. Epidemiologic changes in nontraumatic spinal cord injury for the last 30 years (1990-2019) in South Korea. Spinal Cord. 2022; 60:268–73.
17. Arul K, Ge L, Ikpeze T, Baldwin A, Mesfin A. Traumatic spinal cord injuries in geriatric population: etiology, management, and complications. J Spine Surg. 2019; 5:38–45.
18. Algahtany M, McFaull S, Chen L, Zhang S, Saarela O, Alqahtani F, et al. The changing etiology and epidemiology of traumatic spinal injury: a population-based study. World Neurosurg. 2021; 149:e116–27.
19. Nas K, Yazmalar L, Şah V, Aydın A, Öneş K. Rehabilitation of spinal cord injuries. World J Orthop. 2015; 6:8–16.
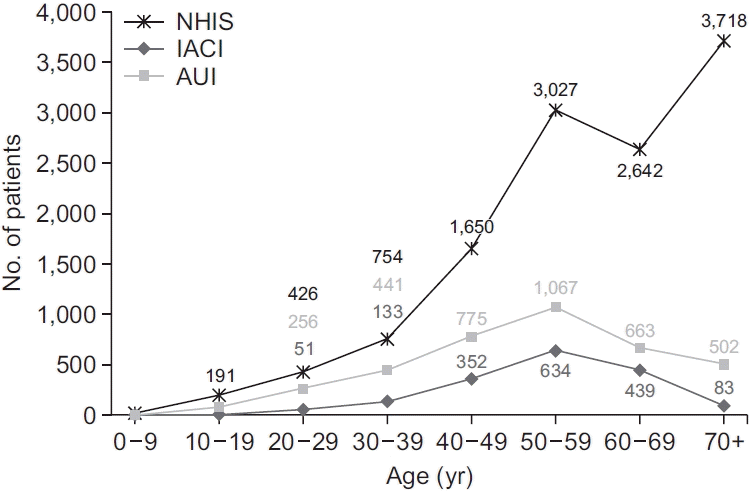
Fig. 1.
Number of patients with traumatic spinal cords injury by age groups, insurance type in Korea. NHIS, National Health Insurance Service; IACI, industrial accident compensation insurance; AUI, automobile insurance. Adapted from Choi et al. J Korean Med Sci 2023;38:e26 [10].
arm-23020f1.tif
Table 1.
Number of patients with traumatic spinal cords injury according to sex across the three trauma-related insurance database from 2014 to 2018 in Korea
Year NHIS
AUI
IACI
Male Female Male Female Male Female
2014 1,525 791 572 223 256 12
2015 1,583 738 569 226 308 18
2016 1,810 835 516 226 338 15
2017 1,731 745 525 198 336 22
2018 1,917 750 527 204 361 32

NHIS, National Health Insurance Service; AUI, automobile insurance; IACI, industrial accident compensation insurance.

Adapted from Choi et al. J Korean Med Sci 2023;38:e26 [10].

Table 2.
Distribution of injured body regions in patients with traumatic spinal cord injury across the three trauma-related insurance database from 2014 to 2018 in South Korea
Year NHIS
AUI
IACI
Cervical Thoracic Lumbar Multiple Unspecified Cervical Thoracic Lumbar Multiple Unspecified Cervical Thoracic Lumbar Multiple Unspecified
2014 1,302 181 231 13 592 568 40 77 4 106 174 19 36 0 39
2015 1,248 212 240 10 616 584 38 70 2 101 213 25 28 0 60
2016 1,447 235 231 15 720 554 21 62 2 103 224 27 30 2 70
2017 1,528 199 154 9 588 534 27 58 3 101 231 22 28 4 73
2018 1,619 217 196 14 624 539 22 50 5 115 236 18 39 2 98
Total (%) 7,144 (57.4) 1,044 (8.4) 1,052 (8.5) 61 (0.5) 3,140 (25.2) 2,779 (73.4) 148 (3.9) 317 (8.4) 16 (0.4) 526 (13.9) 1,078 (63.5) 111 (6.5) 161 (9.5) 8 (0.5) 340 (20.0)

NHIS, National Health Insurance Service; AUI, automobile insurance; IACI, industrial accident compensation insurance.

Adapted from Choi et al. J Korean Med Sci 2023;38:e26 [10].

Table 3.
Number and proportion of spinal cord injury patients who received rehabilitation treatment in 2009, 2013, and 2017 in Korea
Rehabilitation 2009
2013
2017
1st HI (n=1,829) 2nd HI (n=502) 1st HI (n=2,140) 2nd HI (n=644) 1st HI (n=2,476) 2nd HI (n=840)
Physical therapy
RDT (≥30 min) 499 (27.3) 275 (54.8) 792 (37.0) 435 (67.5) 1,002 (40.5) 601 (71.5)
Mobility/gait training (30 min) 712 (38.9) 330 (65.7) 915 (42.8) 475 (73.8) 1,098 (44.3) 633 (75.4)
Complex exercise (10 min) 254 (13.9) 102 (20.3) 220 (10.3) 62 (9.6) 225 (9.1) 81 (9.6)
Occupational therapy
ADL training 336 (18.4) 188 (37.5) 448 (20.9) 196 (30.4) 574 (23.2) 300 (35.7)
Special therapy (30 min) 289 (15.8) 150 (29.9) 404 (18.9) 219 (34.0) 481 (19.4) 341 (40.6)
Complex therapy (10 min) 256 (14.0) 171 (34.1) 385 (18.0) 217 (33.7) 495 (20.0) 299 (35.6)

Values are presented as number (%).

1st HI, first hospitalized institution; 2nd HI, second hospitalized institution; RDT, Rehabilitative Development Therapy for Disorder of Central Nervous System; ADL training, training on activities of daily living.

Table 4.
Hospital length of stay of patients with traumatic spinal cord injury in 2009, 2013, 2017, and 2018 in Korea
Variable Hospital length of stay of patients (day)
2009 2013 2017 2018
Sex
 Male 132.1 122.2 98.6 89.6
 Female 115.6 115.8 98.8 95.1
Age group (yr)
 20–29 142.1 108.9 84.5 96.4
 30–39 175.7 94.3 70.3 81.5
 40–49 154.3 121.0 78.5 76.2
 50–59 118.6 121.7 96.9 96.9
 60–69 114.2 125.4 104.2 84.9
 70–79 103.0 130.5 116.4 107.5
 80–89 101.2 132.8 100.7 84.5
 90+ 410.7 45.2 96.8 67.5

Values are presented as mean.

TOOLS
Similar articles