

 PDF
PDF Citation
 Print
Print


INTRODUCTION
Osteoporosis, which imposes a substantial medical and socioeconomic burden due to its relationship to age-related fractures [1], manifests as impaired bone mass and microarchitecture deterioration with an elevated risk of fragility fractures [2,3]. Postmenopausal osteoporosis caused by a lack of estrogen is the commonest type of osteoporosis [4]. Osteoblasts, bone-forming cells that derive from mesenchymal stem cells (MSCs), can induce bone matrix synthesis, control skeletal mineralization, and maintain bone formation through communicating with other organ systems [5,6]. It is of crucial importance to understand the bioenergetics of cell types such as osteoclasts, osteocytes, and adipocytes to achieve a systematic perspective on the maintenance of bone metabolism [7]. Both environmental and genetic factors are involved in the complicated pathogenesis of primary osteoporosis. The identification of osteoporosis-related factors in the last couple of decades has contributed to an in depth understanding of its pathogenesis and the development of more therapeutic options [8].
MicroRNAs (miRNAs) are a category of short noncoding RNAs (18 to 22 nucleotides in length) that can act as posttranscriptional regulators of gene expression [9,10]. Studies have elucidated the involvement of miRNAs in modulating osteoclast differentiation, bone homeostasis, and bone resorption, and also have suggested the promise of miRNA-based therapies for treating osteoporosis [11,12]. For instance, miR-139-3p represses the differentiation of osteoclasts (MC3T3-E1) [13], whereas miR-98-5p promotes osteoclast differentiation [14]. Microarray analyses and experimental validation have identified five upregulated miRNAs in the setting of healing fractures [15], among which miR-181a-5p can decelerate the osteogenic differentiation of human bone marrow MSCs through downregulating osteoblast markers [16]. Another study has proposed that estrogen deficiency-induced elevation of miR-181a post-menopause leads to Fas ligand deficiency, which attenuates osteoclast apoptosis and consequently drives hyperactive bone resorption and osteoporosis [17].
A prior study has identified Runt-related transcription factor 1 (Runx1) as a downstream target of miR-181a [18]. Runx1 is an enhancer of osteoblast differentiation and a positive regulator of osteoblast genes, ultimately contributing to bone formation [19]. Genetic knockout of Runx1 can inhibit bone mass while boosting osteoclastogenesis and bone resorption [20]. In light of the aforementioned findings, miR-181a-5p may target Runx1 to control the osteogenic differentiation and affect bone formation, thereby mediating the progression of osteoporosis. Therefore, we sought to verify this hypothesis in cellular and animal models of osteoporosis, by which more protective targets against osteoporosis may be unveiled.
METHODS
Ethics statement
All clinical procedures were approved by the ethics committee of the First Affiliated Hospital of Harbin Medical University (approval number: 2021003), and all participants provided written informed consent. All animal experiments were executed following the Guidelines for the Care and Use of Laboratory Animals and were approved by the Animal Care Ethics Committee of the First Affiliated Hospital of Harbin Medical University.
Clinical sample collection
Fasting venous blood samples (5 mL per individual) were collected from 56 patients who were diagnosed with osteoporosis and 48 healthy individuals who received physical examinations at the First Affiliated Hospital of Harbin Medical University. The fasting venous blood samples were placed in blood collection tubes and then centrifuged to obtain the upper serum, followed by storage at −80°C. The baseline clinical characteristics of the patients with osteoporosis and the healthy participants are displayed in Supplemental Table S1. There were no significant differences in sex, age, weight, height, and body mass index between the patients with osteoporosis and the healthy participants.
The inclusion criteria were as follows: (1) having been diagnosed with osteoporosis by dual-energy X-ray absorptiometry (osteoporosis: T-score ≤−2.5; osteopenia: −2.5< T-score <−1.0; normal: T-score ≥−1.0); (2) not receiving anti-osteoporosis treatment before sample collection; (3) having complete clinical data and imaging data; (4) not having any psychiatric disease, with ideal cooperation; and (5) voluntarily signing the informed consent form.
The following exclusion criteria were applied: (1) being unable to cooperate due to mental and cognitive impairment; (2) having received treatment for osteopenia or osteoporosis; (3) having malignant tumors, coagulation dysfunction, allergies, liver or kidney failure, hematological diseases, diabetes, and malabsorption syndromes affecting bone metabolism; and (4) having acute-stage diseases.
Cell culture
Pre-osteoblast MC3T3-E1 cells (from the cell bank of the Chinese Academy of Sciences [Shanghai, China]) were cultured in Dulbecco’s modified Eagle’s medium containing 10% fetal bovine serum (FBS, Gibco, Carlsbad, CA, USA). Osteoblastic differentiation of MC3T3-E1 cells was induced by supplementing a mixture of 10% FBS, dexamethasone (10−8 mol/L), L-ascorbic acid (10 mM), and β-glycerophosphate (10 mM) (Takara Bio, Shiga, Japan) every 2 days.
Cell transfection and grouping
The cells were grouped as follows: blank group, mimic-negative control (NC) group, inhibitor-NC group, shRNA-NC (sh-NC) group, miR-181a-5p-mimic group, miR-181a-5p-inhibitor group, sh-Runx1 group, miR-181a-5p-inhibitor+sh-NC group, miR-181a-5p-inhibitor+sh-Runx1 group, miR-181a-5p mimic+sh-NC group, mimic-NC+sh-allograft inflammatory factor-1 (AIF-1) group, miR-181a-5p mimic+sh-AIF-1 group, and mimic-NC+sh-NC group. The miR-181a-5p-mimic, miR-181a-5p-inhibitor, sh-Runx1, sh-AIF-1, and NCs were purchased from GeneChem (Shanghai, China). The transfection dose of the mimic was 50 nM, the transfection dose of the inhibitor was 100 nM, and the plasmid was transfected at a final concentration of 2 μg. Cells were transfected using the Lipofectamine 2000 reagent (Invitrogen, Carlsbad, CA, USA) according to the manufacturer’s instructions, and subsequent experiments were carried out 48 hours post-transfection.
Quantitative real-time polymerase chain reaction
The total RNA was extracted using the TRIzol reagent (Invitrogen), and reverse transcription was conducted with a reverse transcription kit (TaKaRa, Tokyo, Japan) referring to the kit’s requirements. Gene expression was detected using a LightCycler 480 fluorescence quantitative polymerase chain reaction (PCR) instrument (Roche, Indianapolis, IN, USA), and the reaction conditions were implemented based upon the instructions of the fluorescence quantitative PCR kit (SYBR Green Mix, Roche Diagnostics). Quantitative PCR was performed with three replicates per reaction. Glyceraldehyde-3-phosphate dehydrogenase (GAPDH) or U6 was utilized as a loading control. Data were quantified by the 2−ΔΔCt method. The primer sequences for genes are detailed in Supplemental Table S2.
Western blot assay
MC3T3-E1 cells were lysed with radio-immunoprecipitation assay lysis buffer (Beyotime, Shanghai, China) to obtain protein samples. Subsequently, the concentration of the protein samples was measured using a bicinchoninic acid kit (Beyotime), and the corresponding volume of protein was supplemented with loading buffer (Beyotime) to denature the protein. The protein was then subjected to separation using sodium dodecyl sulfate polyacrylamide gel electrophoresis, and the gel was electro-transferred onto a polyvinylidene fluoride membrane. The membrane was rinsed with washing solution for 1 to 2 minutes and blocked with blocking solution for 60 minutes. Next, the blot was immunoblotted for 2 hours with one of the following primary antibodies: rabbit-anti human GAPDH (ab9485, 1:5,000), Runx1 (ab92336, 1:1,000), AIF-1 (#17198, 1:500, Cell Signaling Technology, Beverly, MA, USA), collagen type I (Col1A1, ab134710, 1:5,000), osteopontin (OPN, ab214050, 1:1,000), alkaline phosphatase (ALP, ab229126, 1:2,000), and osteocalcin (OCN, ab133612, 1:4,000) (all from Abcam, Cambridge, UK except for AIF-1 antibody). Next, the blot was incubated for 1 hour with a secondary antibody: horseradish peroxidase-conjugated goat-anti rabbit immunoglobulin G (IgG) (1:5,000, Beijing ComWin Biotech Co. Ltd., Beijing, China). Lastly, the membrane was assessed with an enhanced chemiluminescence solution, and activity was detected using a chemiluminescence imaging system (Bio-Rad, Hercules, CA, USA).
Dual-luciferase reporter gene assay
The binding site between miR-181a-5p and Runx1 was predicted through the bioinformatics software StarBase. According to the predicted results, wild-type and mutant-type sequences (WT-Runx1 and MUT-Runx1) of the 3’-untranslated region of the binding site were designed, synthesized, inserted into the luciferase reporter gene vector pGL3-promoter (Promega, Madison, WI, USA), and then co-transfected into HEK293T cells with the miR-181a-5p mimic (30 nM) or its NC (30 nM) (Shanghai Sixin Biotechnology Co. Ltd., Shanghai, China).
The binding site of Runx1 and AIF-1 was predicted using the JASPAR database. The WT-AIF-1 and MUT-AIF-1 sequences of the AIF-1 promoter fragment containing the predicted Runx1 binding site were cloned into the pGL3-basic reporter vector (Promega) and co-transfected into HEK293T cells (Shanghai Sixin Biotechnology) with the overexpressed Runx1 vector or its NC. The activity of both firefly and renilla luciferase was measured with a luminescence detector (Promega) in cells posttransfection. Firefly luciferase activity was standardized based on renilla luciferase activity. Relative luciferase activity was presented as a percentage reflecting the proportion of firefly luciferase activity to renilla luciferase activity.
RNA immunoprecipitation
An RNA immunoprecipitation (RIP) assay was performed to detect the binding of miR-181a-5p to Runx1. In brief, the harvested cells were lysed with RIP lysis buffer. Next, RIP wash buffer (100 μL) was used to suspend magnetic beads, and the magnetic beads were coated with argonaute-2 (Ago2) antibody (5 μg, ab186733, 1:50, Abcam) or its NC IgG, followed by incubation overnight at 4°C on a rotator. The prepared cell lysate was quickly thawed, followed by 10 minutes of centrifugation (14,000 rpm, 4°C). After that, 100 μL of the supernatant was incubated with the magnetic bead-antibody complex at 4°C overnight and centrifuged briefly, after which the centrifuge tube was placed on a magnetic rack to remove the supernatant. The complex was then supplemented with RIP wash buffer (500 μL), and the centrifuge tube was vibrated and placed on a magnetic rack to remove the supernatant. After washing each sample six times, 150 μL of proteinase K buffer was added to resuspend the magnetic bead-antibody complex, followed by 30 minutes of incubation with the complex at 55°C; the sample was placed on a magnetic rack to obtain the supernatant. The purified RNAs were evaluated by quantitative real-time polymerase chain reaction (qRT-PCR) analysis.
Chromatin immunoprecipitation
A chromatin immunoprecipitation (ChIP) assay was implemented by using a ChIP detection kit (Millipore, Billerica, MA, USA). Briefly, cellular chromatin was cultured overnight at 4°C with Runx1 antibody (ab1109443, 1:100, Abcam) for full binding. Next, the complex of protein and DNA was precipitated by 1 hour of incubation at 4°C with the protein G agarose. After centrifugation at 5,000 ×g for 1 minute to remove the supernatant, the complex of protein and DNA was eluted. Subsequently, the cross-linking was de-linked at 65°C overnight, and the DNA fragments were then subjected to purification and recycling. The fragment region of the predicted site in the AIF-1 promoter region was amplified by PCR.
Flow cytometry
MC3T3-E1 cells were trypsinized, washed with phosphate-buffered saline (PBS), and centrifuged at 1,000 rpm for 5 minutes. Next, the MC3T3-E1 cells were resuspended in PBS, and dyed with an annexin V-fluorescein isothiocyanate (FITC) apoptosis detection kit (BioVision, Milpitas, CA, USA). The apoptosis rate was evaluated by a flow cytometer (BD Biosciences, San Jose, CA, USA).
Alizarin red S staining
Alizarin red S staining was conducted to identify the mineralized nodules of osteoblasts. In short, MC3T3-E1 cells at 8 days after consecutive culture were collected, and the cell culture medium was removed. Subsequently, the MC3T3-E1 cells were subjected to fixation with ethanol (95%), followed by the removal of ethanol and washing with PBS twice. The MC3T3-E1 cells were then dyed with 0.2% alizarin red S stain (2 mL) for 30 minutes, slightly washed in running water, blocked with a neutral gum, and captured under an optical microscope. The quantification and statistical analysis of the results were performed using ImageJ software (National Institutes of Health, Bethesda, MD, USA) and GraphPad Prism 8 software (GraphPad LLC, San Diego, CA, USA), respectively.
ALP staining
Cells at 0, 4, 8, and 12 days after induction were fixed, rinsed twice with double-distilled H2O, and then stained using a BCIP/NBT ALP chromogenic kit (Beyotime), referring to the manufacturer’s instructions. Next, the cells were washed and then photomicrographed (Olympus, Tokyo, Japan). The quantification and statistical analysis of the results were performed using ImageJ software and GraphPad Prism 8 software, respectively.
ALP enzyme assay
ALP kit (Nanjing Jiancheng Bioengineering Institute, Nanjing, China) was utilized to investigate the level of ALP in MC3T3-E1 cells based on the product manual.
Establishment of an ovariectomy-induced osteoporosis mouse model
Twenty-four female specific pathogen-free C57BL/6J mice (Beijing Vital River Laboratory Animal Technology Co. Ltd., Beijing, China) were reared under standard animal feeding conditions with a light-dark 12:12-hour alternation and free access to food and water. The mice were randomly assigned into the following four groups: the sham group (no ovariectomy [OVX] mice), the OVX group (OVX), antagomir-miR-181a-5p group (OVX+antagomir-miR-181a-5p), and antagomir-NC group (OVX+antagomir-NC) (n=6).
The mice were anesthetized with 2% pentobarbital sodium (45 mg/kg) for OVX or a sham operation at 8 weeks of age. At 16 weeks of age, each animal was injected with 0.2 mL of antagomir-miR-181a-5p or antagomir-NC via the tail vein at a dose of 80 mg/kg, and the mice in the control group were injected with the same volume of PBS every week, twice a week, for 4 consecutive weeks. Lastly, the mice were euthanized, and serum samples and femurs were collected.
Hematoxylin and eosin staining
Femur samples were decalcified in 10% ethylenediaminetetraacetic acid (EDTA) for 3 weeks, and then were dehydrated and embedded in paraffin. According to the product manual of the hematoxylin and eosin (H&E) staining kit (Beyotime), the prepared tissue sections (4 μm) were dewaxed with xylene, hydrated with gradient ethanol, dyed with hematoxylin for 5 minutes, differentiated with hydrochloric acid and ethanol for 30 seconds, and dyed with eosin for 2 minutes, followed by routine dehydration, permeabilization, blocking, and photographing under a microscope.
Micro-computed tomography detection
A SCANCO µCT 100 detector, with a scanning resolution of 8 µm and a scanning range of the entire femur, was utilized to analyze the cancellous bone area within 200 layers below the growth plate. The bone mineral density (BMD, mg/cm2), trabecular bone thickness (Tb.Th, mm), trabecular bone separation (Tb.Sp, mm), trabecular bone number (Tb.N, mm−1), bone volume fraction (BV/TV, %), and bone surface/bone volume (BS/ BV, mm−1) were analyzed.
Statistical analysis
Data were statistically analyzed using GraphPad Prism 6 software (GraphPad Software, San Diego, CA, USA), and all data were depicted as mean±standard deviation. Comparisons between two groups were analyzed using the t test, and comparisons among multiple groups were tested by one-way analysis of variance, followed by the Tukey multiple-comparison test. Statistical significance was set at P<0.05.
RESULTS
miR-181a-5p is upregulated in the serum of osteoporosis patients and downregulated during osteogenic differentiation
In this research, qRT-PCR was carried out to detect miR-181a-5p expression in the serum of osteoporosis patients and MC3T3-E cells during osteogenesis. The obtained results indicated that miR-181a-5p was more highly expressed in the serum of osteoporosis patients (n=56) than in healthy participants (n=48) (Fig. 1A).
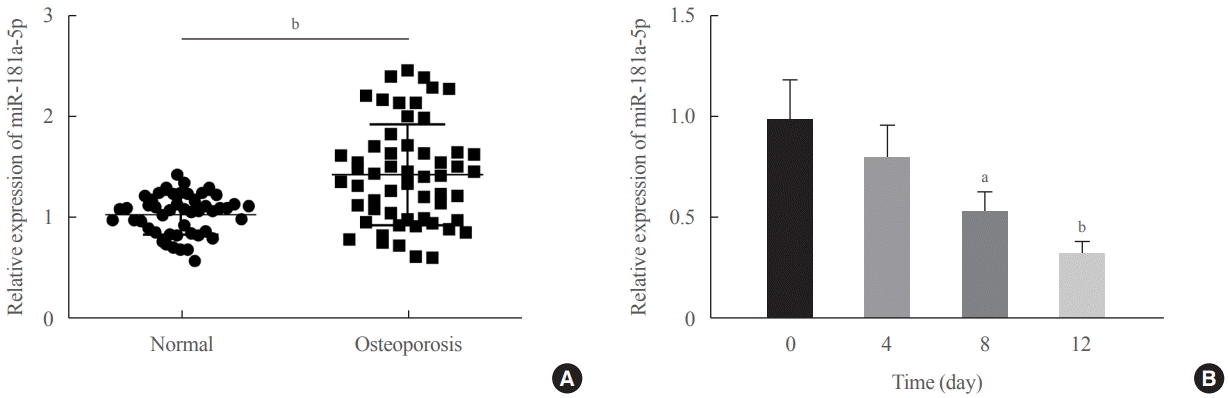
Fig. 1.
miR-181a-5p was upregulated in the serum of patients with osteoporosis and downregulated during osteogenic differentiation. (A) Quantitative real-time polymerase chain reaction (qRT-PCR) was carried out to detect miR-181a-5p expression in the serum of osteoporosis patients and normal controls (normal group, n=48; osteoporosis group, n=56). (B) qRT-PCR was used to detect miR-181a-5p expression in MC3T3-E cells during osteogenic differentiation. aP<0.05 vs. day 0 of induction; bP<0.01 vs. the normal group or day 0 of induction.
![]()
Osteogenic induction medium (OIM) decreased miR-181a-5p expression in MC3T3-E cells in a time-dependent manner in comparison to that at 0 day (Fig. 1B). The expression of osteogenesis-related proteins (OCN, OPN, Col1A1, and ALP) were determined via qRT-PCR and Western blot assays, which suggested that OIM increased the expression levels of OCN, OPN, Col1A1, and ALP in a time-dependent manner (Supplemental Fig. S1A, B). Meanwhile, alizarin red S staining was utilized to detect mineralization, and ALP staining and ALP enzyme analysis were conducted to test the osteogenic differentiation. The finding demonstrated an increased number of calcified nodules in MC3T3-E cells (Supplemental Fig. S1C), gradually deepened staining of MC3T3-E cells, and increased ALP activity in MC3T3-E cells (Supplemental Fig. S1D, E). It is suggested that miR-181a-5p may participate in osteoblast differentiation and bone development.
miR-181a-5p represses osteogenic differentiation of MC3T3-E1 cells
To explore the effect of miR-181a-5p on osteogenic differentiation of MC3T3-E1 cells, the miR-181a-5p mimic and inhibitor were transfected into cells, respectively, followed by culture in OIM. qRT-PCR results revealed that the miR-181a-5p mimic increased miR-181a-5p expression in MC3T3-E1 cells, and the miR-181a-5p inhibitor reduced its expression (Supplemental Fig. S2A), indicating good transfection efficiency.
After 8 days of induction in OIM, alizarin red S staining, ALP staining, and ALP activity detection showed that MC3T3-E1 cells overexpressing miR-181a-5p had a lower number of calcified nodules, less ALP activity, and lightened ALP staining. On the contrary, MC3T3-E1 cells showed an increased number of calcified nodules, more ALP activity, and deepened ALP staining after miR-181a-5p expression was downregulated (Fig. 2A-C). The qRT-PCR and Western blot assay results indicated that there were reduced expression levels of osteogenesis-related proteins (OCN, OPN, Col1A1, and ALP) in MC3T3-E1 cells in response to miR-181a-5p-mimic treatment, whereas the corresponding expression levels increased in MC3T3-E1 cells after treatment with the miR-181a-5p-inhibitor (Fig. 2D, E). Flow cytometry revealed elevated apoptosis in MC3T3-E1 cells overexpressing miR-181a-5p, whereas apoptosis was reduced in MC3T3-E1 cells with miR-181a-5p-inhibitor treatment (Fig. 2F). It is suggested that miR-181a-5p could promote apoptosis in MC3T3-E1 cells and inhibit their osteogenic differentiation and matrix mineralization.
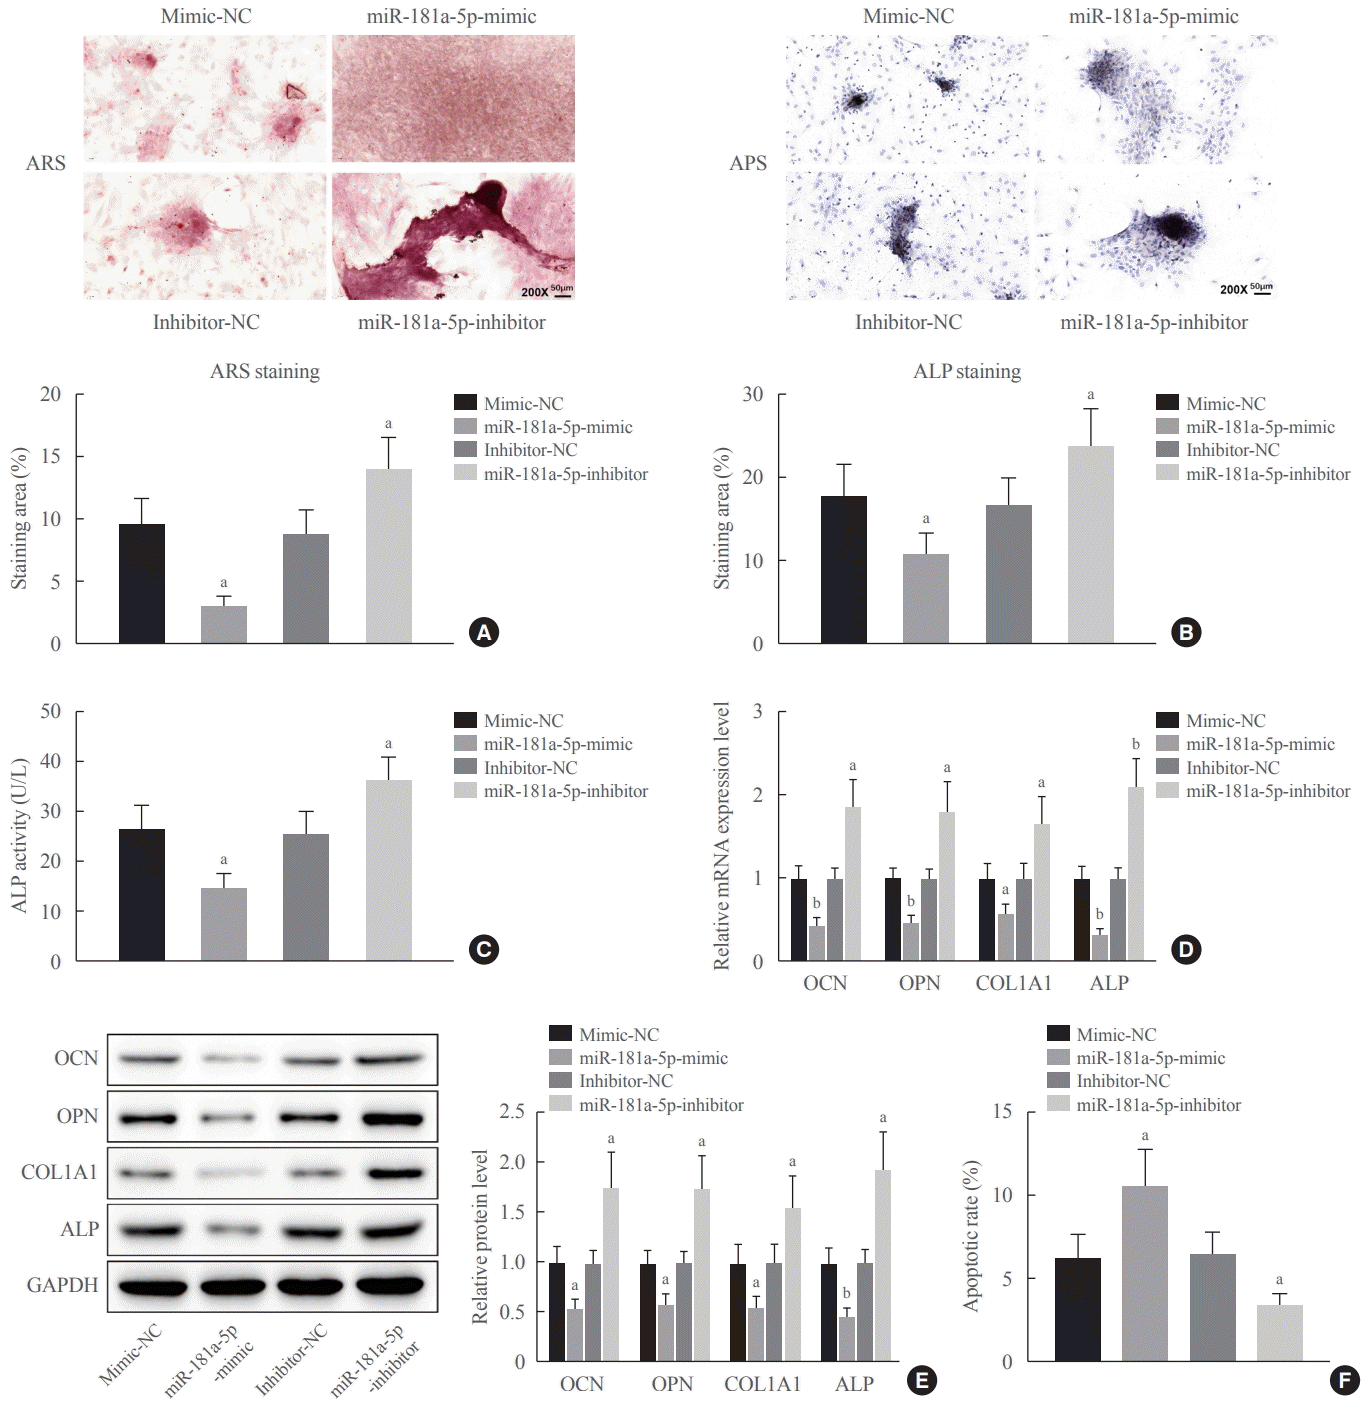
Fig. 2.
miR-181a-5p inhibited osteogenic differentiation in vitro. (A) Alizarin red S staining was used to detect mineralization in MC3T3-E1 cells transfected with miR-181a-5p-mimic and miR-181a-5p-inhibitor. (B, C) Alkaline phosphatase (ALP) staining and an ALP enzyme assay were conducted to detect osteogenic differentiation in MC3T3-E1 cells transfected with the miR-181a-5p-mimic and miR-181a-5p-inhibitor. (D, E) The expression levels of osteogenesis-related proteins (osteocalcin [OCN], osteopontin [OPN], collagen type I [Col1A1], and ALP) in MC3T3-E1 cells transfected with the miR-181a-5p-mimic and miR-181a-5p-inhibitor were determined by quantitative real-time polymerase chain reaction (qRT-PCR) and Western blot assays. (F) Flow cytometry analysis of cell apoptosis in MC3T3-E1 cells transfected with the miR-181a-5p-mimic and miR-181a-5p-inhibitor. Comparisons among multiple groups were conducted using one-way analysis of variance, followed by the Tukey multiple-comparison test. The experiment was repeated three times. GAPDH, glyceraldehyde-3-phosphate dehydrogenase. aP<0.05 vs. the mimic-negative control (NC) group or inhibitor-NC group; bP<0.01 vs. the mimic-NC group or inhibitor-NC group.
![]()
miR-181a-5p targets Runx1
To elucidate the molecular mechanisms of miR-181a-5p-mediated inhibition of osteogenic differentiation, we found that miR-181a-5p had a binding site with Runx1 via StarBase prediction (Fig. 3A). Evidence has shown that Runx1 positively regulates the differentiation of MSCs into osteoblasts [19]. In our study, the luciferase activity assay was carried out to elucidate the binding relationship between miR-181a-5p and Runx1, and the findings suggested that the luciferase activity of cells decreased with co-transfection of the miR-181a-5p-mimic and Runx1-WT (Fig. 3B). Next, the pull-down of Ago2 was tested by the RIP assay, which revealed that Ago2 pulled down more miR-181a-5p and Runx1 (Fig. 3C).
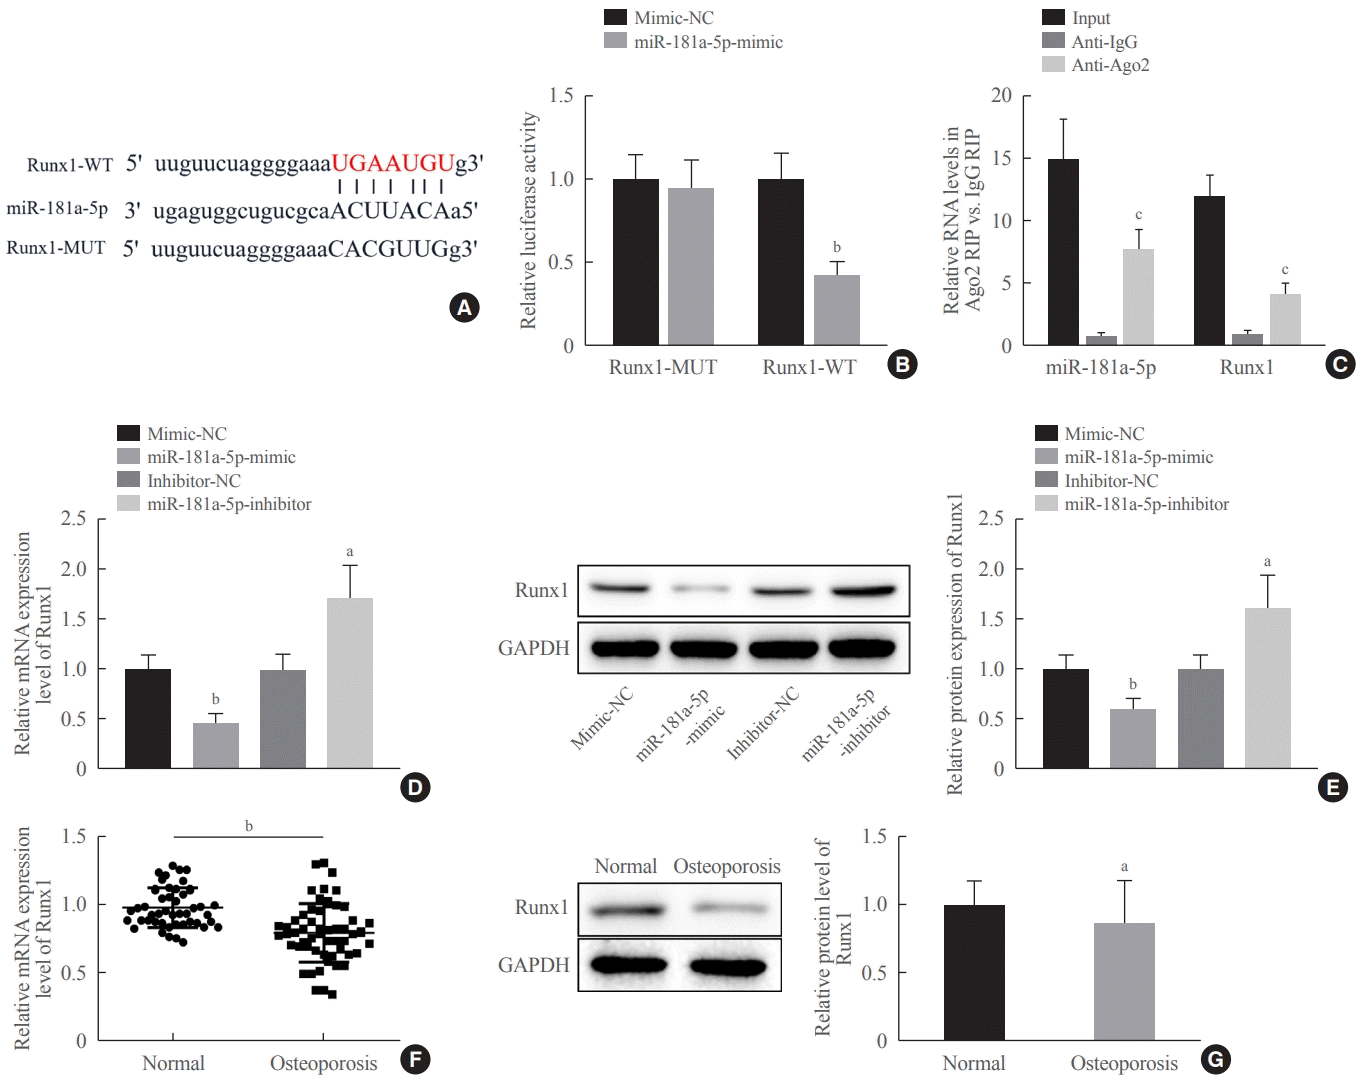
Fig. 3.
Runt-related transcription factor 1 (Runx1) was identified as a target gene of miR-181a-5p. (A) The binding site of miR-181a-5p to Runx1 was predicted by StarBase. (B, C) The binding relationship between miR-181a-5p and Runx1 was verified by a dual-luciferase reporter gene assay and an RNA immunoprecipitation assay. (D, E) Runx1 expression in MC3T3-E1 cells transfected with a miR-181a-5pmimic and miR-181a-5p-inhibitor was tested by quantitative real-time polymerase chain reaction (qRT-PCR) and Western blot assays. (F, G) Runx1 expression in the serum of osteoporosis patients and normal controls was tested by qRT-PCR and Western blot assays (normal group, n=48; osteoporosis group, n=56). Comparisons between two groups were performed using the t test, and comparisons among multiple groups were conducted using one-way analysis of variance, followed by the Tukey multiple-comparison test. The experiment was repeated three times. WT, wild-type; MUT, mutant; RIP, RNA immunoprecipitation; GAPDH, glyceraldehyde-3-phosphate dehydrogenase. aP<0.05 vs. the mimic-negative control (NC) group, inhibitor-NC group or normal group; bP<0.01 vs. the mimic-NC group or normal group; cP<0.001 vs. the immunoglobulin G (IgG) group.
![]()
Subsequently, Runx1 expression in miR-181a-5p-mimic- and miR-181a-5p-inhibitor-trasnfected MC3T3-E1 cells and in the serum of osteoporosis patients was tested by qRT-PCR and Western blot assay. Overexpressed miR-181a-5p reduced Runx1 expression, while downregulated miR-181a-5p elevated Runx1 expression (Fig. 3D, E). Compared with healthy participants, Runx1 was expressed at a low level in the serum of osteoporosis patients (Fig. 3F, G). In conclusion, we observed that miR-181a-5p targeted Runx1 expression.
Downregulation of Runx1 inhibits osteogenic differentiation
To probe into the function of Runx1 on the osteogenic differentiation of MC3T3-E cells, firstly, Runx1 expression in induced-differentiation of MC3T3-E1 cells was detected by qRT-PCR and Western blotting. Interestingly, OIM culture elevated Runx1 expression levels in a time-dependent manner compared to preinduction (Fig. 4A, B). Then, according to the National Center for Biotechnology Information (NCBI) database, an interference sequence specific to Runx1 was designed, and its interference efficiency was verified using qRT-PCR. The expression of Runx1 was significantly inhibited by sh-Runx1-1 and 3 in comparison to the sh-NC group, and the interference efficiency of sh-Runx1-3 was more significant; therefore, sh-Runx1-3 was subsequently selected for the transfection experiments of MC3T3-E1 cells (Supplemental Fig. S2B). Next, we transfected sh-Runx1 and sh-NC in MC3T3-E1 cells, and the results showed that, upon sh-Runx1 treatment, MC3T3-E1 cells exhibited reduced expression levels of Runx1 (Fig. 4C, D), indicating good transfection efficiency.
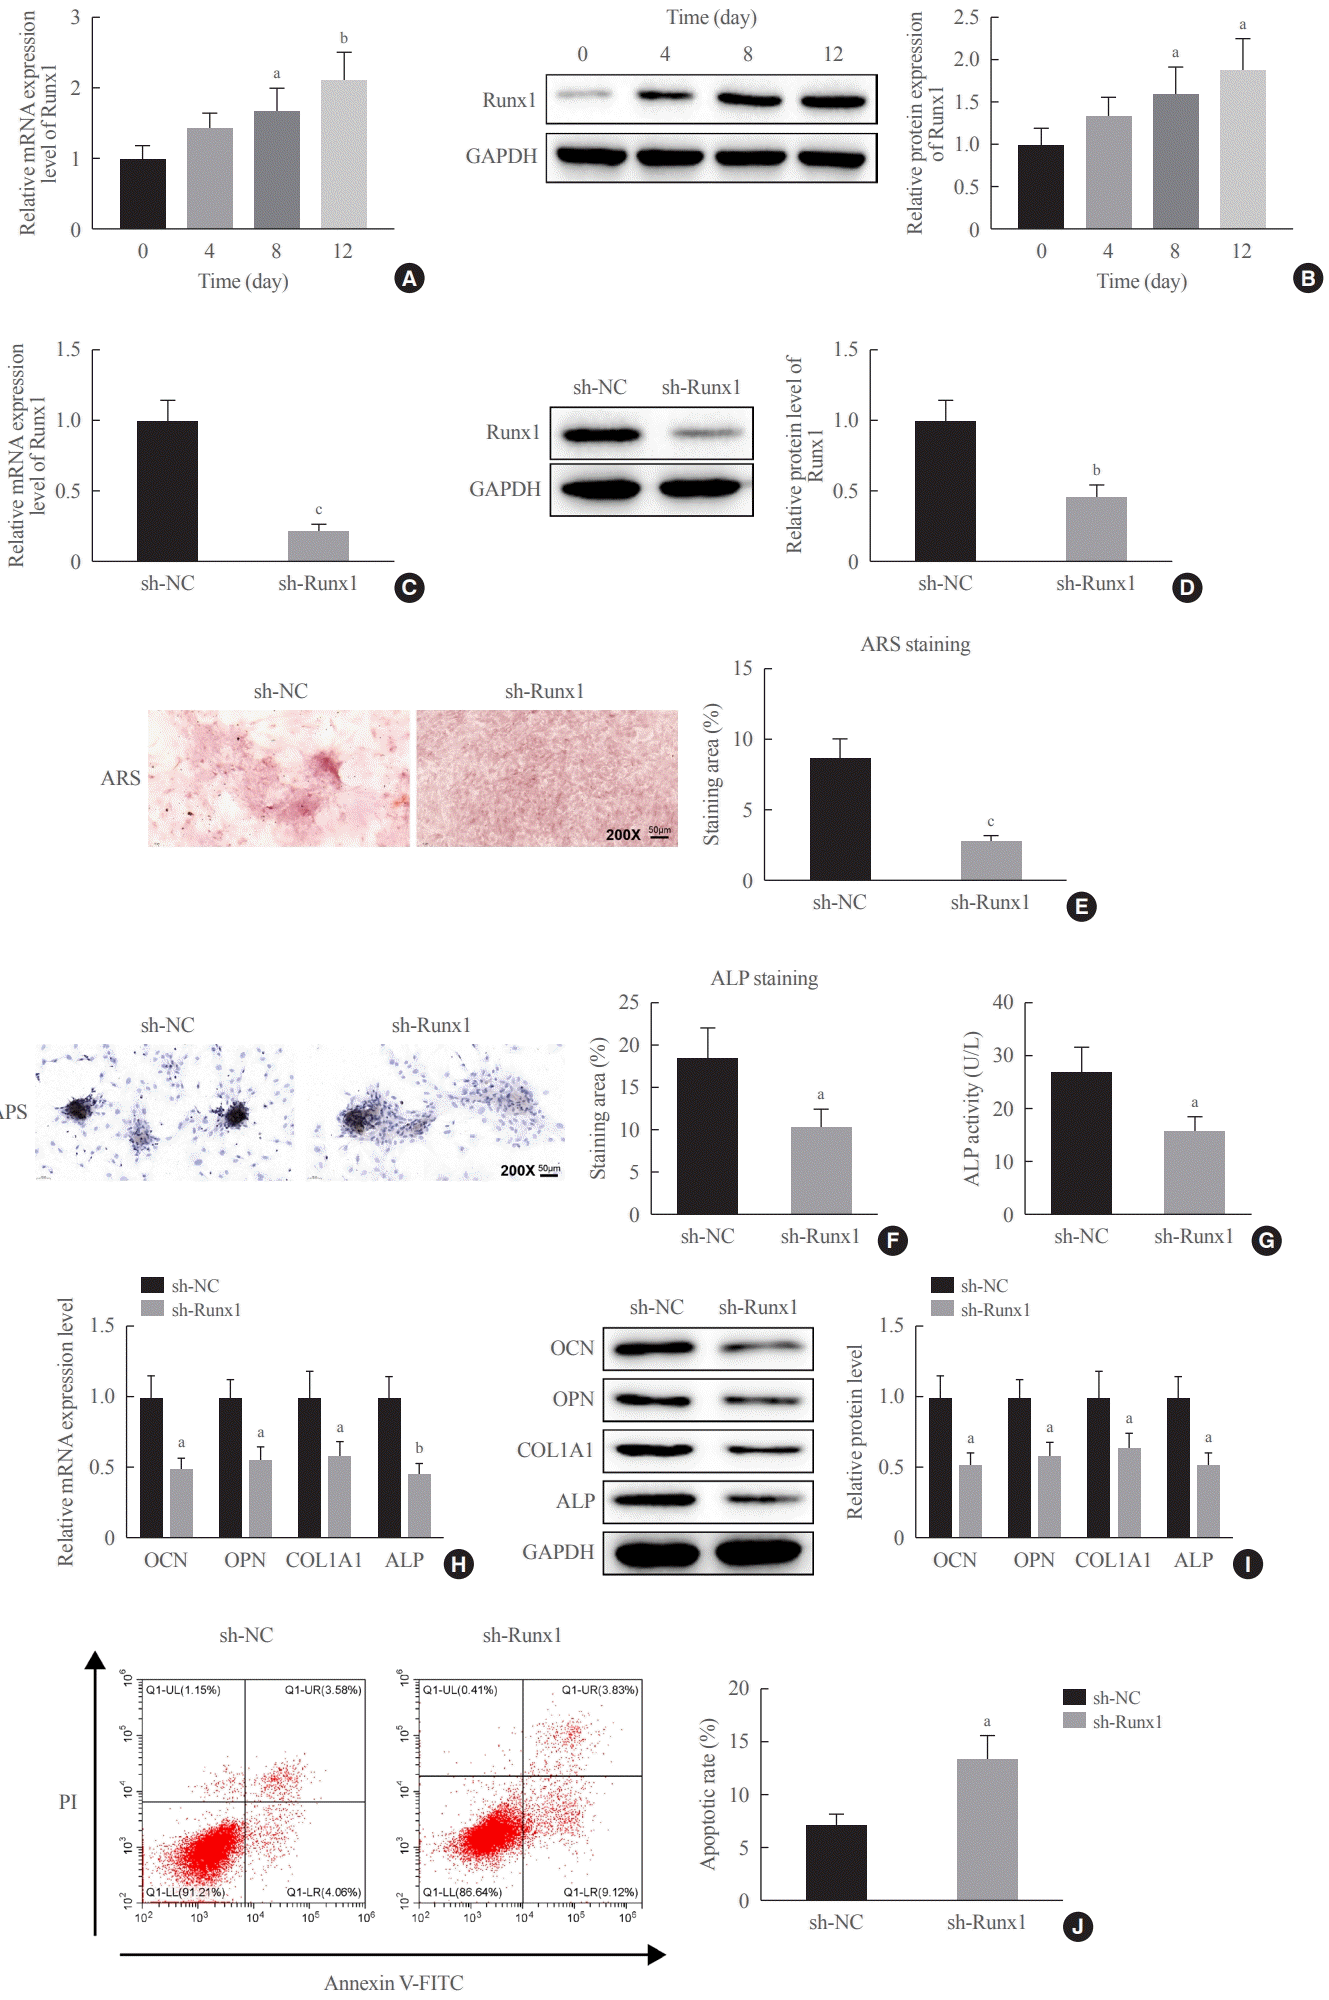
Fig. 4.
Downregulation of Runt-related transcription factor 1 (Runx1) inhibited osteogenic differentiation. (A, B) Quantitative real-time polymerase chain reaction (qRT-PCR) and Western blot assays for the detection of Runx1 expression during osteogenic differentiation induction. (C, D) Runx1 expression in MC3T3-E1 cells transfected with sh-Runx1 and sh-negative control (NC) was determined by qRT-PCR and Western blot assays. (E) Alizarin red S (ARS) staining was utilized to detect mineralization in MC3T3-E1 cells transfected with sh- Runx1 and sh-NC. (F, G) Alkaline phosphatase (ALP) staining and an ALP enzyme assay were performed to detect osteogenic differentiation in MC3T3-E1 cells transfected with sh-Runx1 and sh-NC. (H, I) The expression levels of osteogenesis-related proteins (osteocalcin [OCN], osteopontin [OPN], collagen type I [Col1A1], and ALP) in MC3T3-E1 cells transfected with sh-Runx1 and sh-NC were tested by qRT-PCR and Western blot assays. (J) Flow cytometry was carried out to detect apoptosis in MC3T3-E1 cells transfected with sh-Runx1 and sh-NC. Comparisons between two groups were performed using the t test, and comparisons among multiple groups were conducted using one-way analysis of variance, followed by the Tukey multiple-comparison test. The experiment was repeated three times. GAPDH, glyceraldehyde-3-phosphate dehydrogenase; APS, alkaline phosphatase staining; PI, propidium iodide; FITC, fluorescein isothiocyanate. aP<0.05 vs. day 0 of induction or sh-NC group; bP<0.01 vs. day 0 of induction or sh-NC group; cP<0.001 vs. the sh-NC group.
![]()
sh-Runx1-transfected MC3T3-E1 cells had a decreased number of calcified nodules and ALP activity and lightened ALP staining (Fig. 4E-G). Based on the findings of qRT-PCR and Western blotting, we observed that there were reduced expression levels of osteogenesis-related proteins (OCN, OPN, Col1A1, and ALP) in MC3T3-E1 cells in response to sh-Runx1 treatment (Fig. 4H, I). Flow cytometry showed elevated apoptosis in MC3T3-E1 cells upon sh-Runx1 treatment (Fig. 4J). To conclude, it is suggested that the downregulation of Runx1 could promote apoptosis and inhibit osteogenic differentiation and matrix mineralization in MC3T3-E1 cells.
miR-181a-5p can suppress osteogenic differentiation by downregulating Runx1
The next step was to confirm whether the modulation of osteogenic differentiation by miR-181a-5p was mediated by targeting Runx1, and we co-transfected miR-181a-5p-inhibitor and sh-Runx1, along with miR-181a-5p-inhibitor and sh-NC in MC3T3-E cells. The results of qRT-PCR and Western blotting revealed that the transfection of sh-Runx1 could partially reverse the miR-181a-5p-inhibitor-mediated upregulation of Runx1 in MC3T3-E cells (Fig. 5A, B). Additionally, decreases were observed in the number of calcified nodules, ALP staining and activity, and the expression levels of osteogenesis-related proteins (OCN, OPN, Col1A1, and ALP), as well as elevated apoptosis in MC3T3-E cells co-transfected with the miR-181a-5p-inhibitor and sh-Runx1 in comparison to co-transfection with the miR-181a-5p-inhibitor and sh-NC (Fig. 5C-H). The above results demonstrate that miR-181a-5p may inhibit osteogenic differentiation and promote apoptosis in MC3T3-E cells by downregulating Runx1.
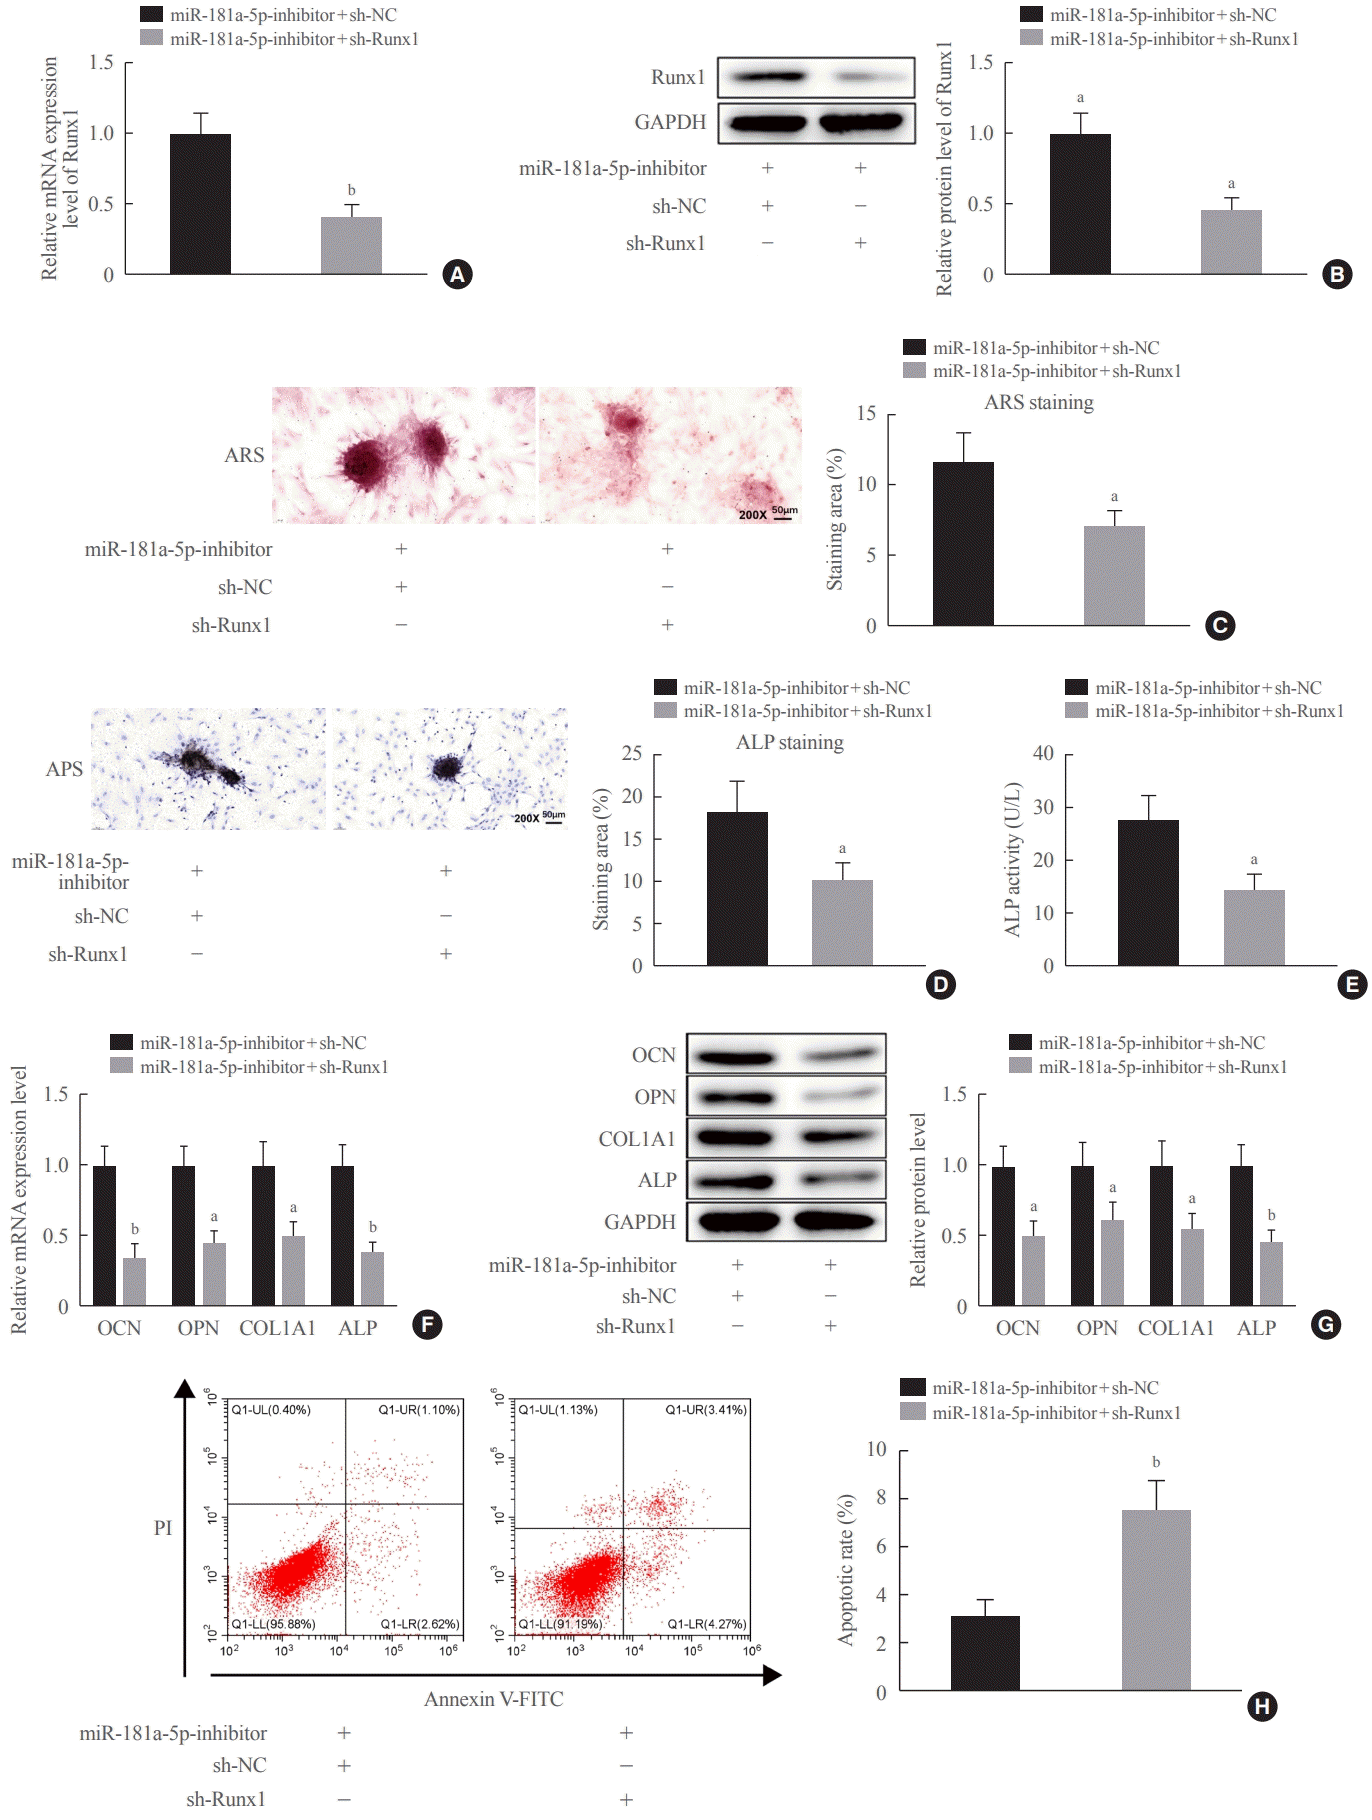
Fig. 5.
miR-181a-5p suppressed osteogenic differentiation partially by downregulating Runt-related transcription factor 1 (Runx1). (A, B) Runx1 expression in MC3T3-E1 cells co-transfected with a miR-181a-5p-inhibitor and sh-Runx1 was tested by quantitative real-time polymerase chain reaction (qRT-PCR) and Western blot assays. (C) Alizarin red S (ARS) staining was used to detect mineralization in MC3T3- E1 cells co-transfected with the miR-181a-5p-inhibitor and sh-Runx1 (×200). (D, E) Alkaline phosphatase (ALP) staining and an ALP enzyme assay were performed to measure osteogenic differentiation in MC3T3-E1 cells co-transfected with the miR-181a-5p-inhibitor and sh- Runx1. (F, G) The expression levels of osteogenesis-related proteins (osteocalcin [OCN], osteopontin [OPN], collagen type I [Col1A1], and ALP) in MC3T3-E1 cells co-transfected with the miR-181a-5p-inhibitor and sh-Runx1 were determined by qRT-PCR and Western blot assays. (H) Apoptosis in MC3T3-E1 cells co-transfected with miR-181a-5p-inhibitor and sh-Runx1 was measured by flow cytometry. Comparisons between two groups were performed using the t test. The experiment was repeated three times. GAPDH, glyceraldehyde-3-phosphate dehydrogenase; APS, alkaline phosphatase staining; PI, propidium iodide. aP<0.05 vs. the miR-181a-5p-inhibitor+sh-negative control (NC) group; bP<0.01 vs. the miR-181a-5p-inhibitor+sh-NC group.
![]()
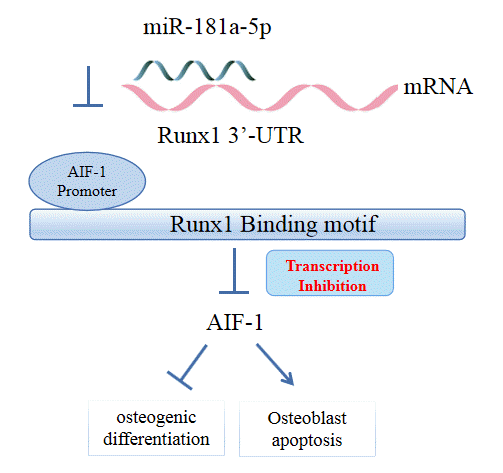
Transcription factor Runx1 targets AIF-1
Next, we predicted the binding site of Runx1 in the promoter region of AIF-1 using the JASPAR database, suggesting that Runx1 may be a candidate transcription factor that could bind to the promoter region of AIF-1 (Fig. 6A). To explore the relationship between Runx1 and AIF-1, we carried out the dual-luciferase reporter gene assay and ChIP assay, and the corresponding findings showed lower luciferase activity with the WT-AIF-1 promoter (AIF-1-WT) containing the Runx1 binding site than with the mutant one (AIF-1-MUT) (Fig. 6B), as well as tight binding of Runx1 to the promoter region of the AIF-1 gene (Fig. 6C). The expression of AIF-1 in sh-Runx1-transfected MC3T3-E1 cells and the serum of osteoporosis patients was tested by qRT-PCR and Western blot assays. The results demonstrated that the transfection of sh-Runx1 could elevate AIF-1 expression in MC3T3-E1 cells (Fig. 6D, E). Compared with healthy participants, AIF-1 was upregulated in the serum of osteoporosis patients (Fig. 6F, G). These results suggest that Runx1 acts as a transcription factor to attenuate the transcription of AIF-1.
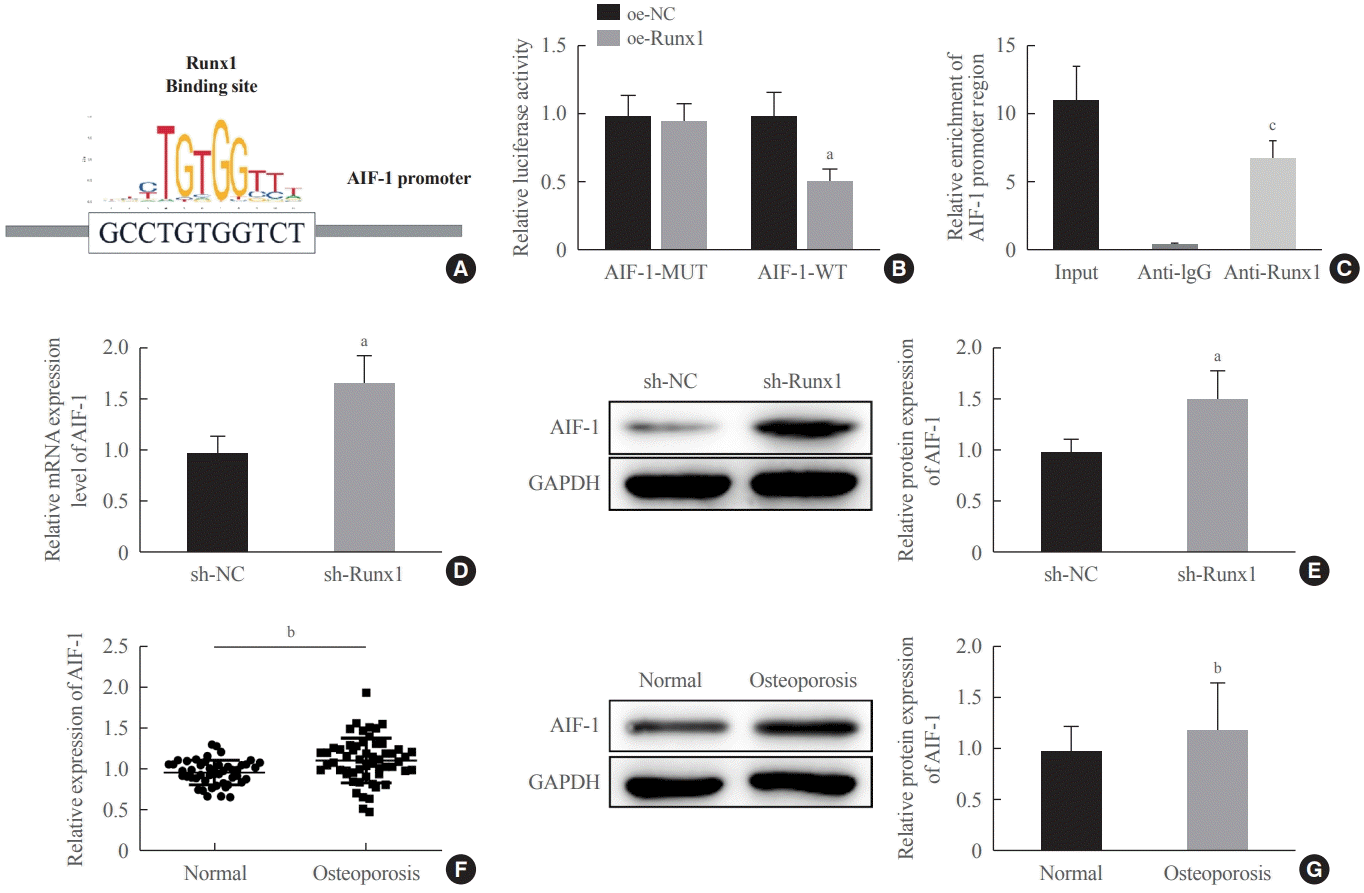
Fig. 6.
The transcription factor Runt-related transcription factor 1 (Runx1) suppressed the transcription of allograft inflammatory factor-1 (AIF-1). (A) The JASPAR database was used to predict the binding site of AIF-1 and Runx1. (B, C) The relationship between Runx1 and AIF- 1 was verified by a dual-luciferase reporter gene assay and a chromatin immunoprecipitation assay. (D, E) The expression of AIF-1 in MC3T3-E1 cells transfected with sh-Runx1 was tested by quantitative real-time polymerase chain reaction (qRT-PCR) and Western blot assays. (F, G) The expression of AIF-1 in the serum of osteoporosis patients and normal controls was tested by qRT-PCR and Western blot assays (normal group, n=48; osteoporosis group, n=56). Comparisons between two groups were performed using the t test. The experiment was repeated three times. MUT, mutant; WT, wild-type; GAPDH, glyceraldehyde-3-phosphate dehydrogenase. aP<0.05 vs. the overexpression (oe)-negative control (NC) group or the sh-NC group; bP<0.01 vs. the normal group; cP<0.001 vs. the immunoglobulin G (IgG) group.
![]()
miR-181a-5p results in suppression of the osteogenic differentiation partially by downregulating Runx1 and promoting the transcription of AIF-1
In order to further elucidate whether miR-181a-5p modulated osteogenic differentiation by targeting Runx1 and inducing the transcription of AIF-1, an interference sequence specific to AIF-1 was designed according to the NCBI database and qRT-PCR was performed to verify its interference efficiency. The expression of AIF-1 was significantly suppressed in the sh-AIF-1-1 and sh-AIF-1-2 groups versus the sh-NC group, and the interference efficiency of sh-AIF-1-1 was more significant; therefore, sh-AIF-1-1 was selected for the subsequent experiments (Supplemental Fig. S2C). We co-transfected MC3T3-E cells with the miR-181a-5p-mimic and sh-AIF-1, the miR-181a-5p-mimic and sh-NC, mimic-NC and sh-AIF-1, or mimic-NC and sh-NC. Compared with the mimic-NC+sh-NC group, miR-181a-5p and AIF-1 expression was upregulated and Runx1 expression was downregulated in the miR-181a-5p-mimic+sh-NC group. AIF-1 expression decreased, while miR-181a-5p and Runx1 expression levels did not change in the mimic-NC+sh-AIF-1 group versus the mimic-NC+sh-NC group. Furthermore, AIF-1 expression decreased, while miR-181a-5p and Runx1 expression levels did not change in the miR-181a-5p-mimic+sh-AIF-1 group versus the miR-181a-5p-mimic+sh-NC group (Fig. 7A-C), suggesting good transfection efficiency.
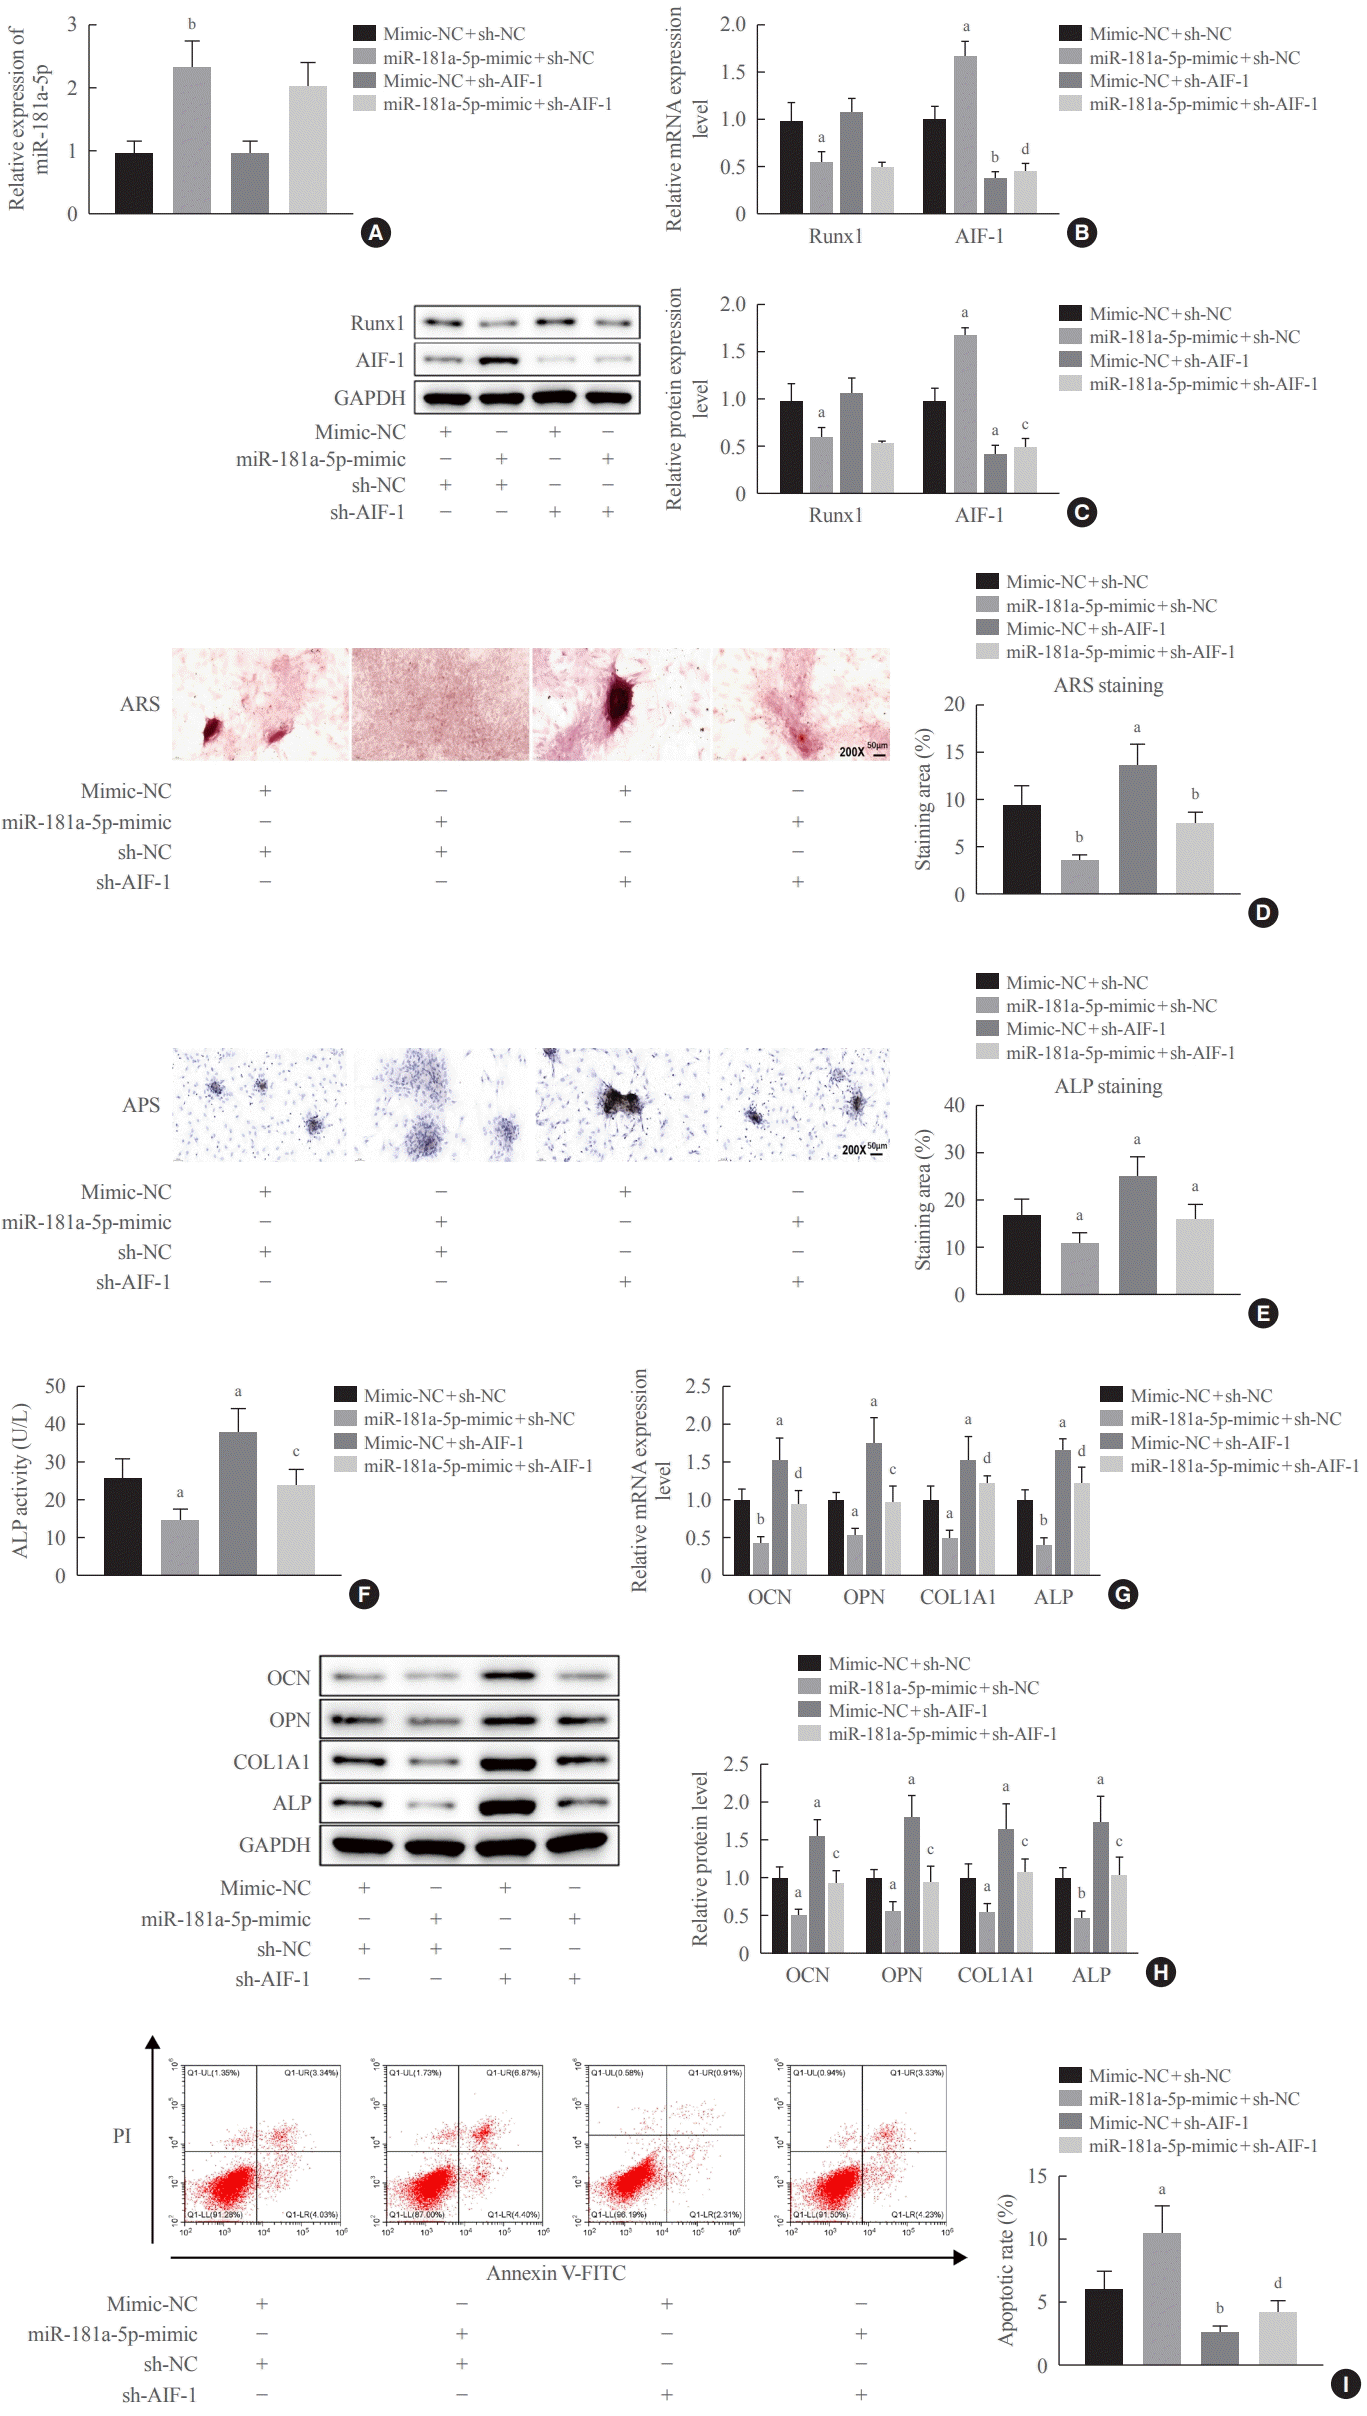
Fig. 7.
miR-181a-5p may promote allograft inflammatory factor-1 (AIF-1) transcription by downregulating Runt-related transcription factor 1 (Runx1), thereby inhibiting osteogenic differentiation and promoting apoptosis in MC3T3-E cells. MC3T3-E cells were co-transfected with a miR-181a-5p-mimic and sh-AIF-1, a miR-181a-5p-mimic and sh-negative control (NC), mimic-NC, and sh-AIF-1, as well as mimic-NC and sh-NC: (A) miR-181a-5p expression was tested using quantitative real-time polymerase chain reaction (qRT-PCR). (B, C) Runx1 and AIF-1 expression was determined using qRT-PCR and Western blot assays. (D, E, F) Alizarin red S (ARS) staining, alkaline phosphatase (ALP) staining, and an ALP enzyme assay (D, ×200). (G, H) The expression levels of osteogenesis-related proteins (osteocalcin [OCN], osteopontin [OPN], collagen type I [Col1A1], and and ALP) were determined by qRT-PCR and Western blot assays. (I) Apoptosis was measured using flow cytometry. Comparisons among multiple groups were conducted using one-way analysis of variance, followed by the Tukey multiple-comparison test. The experiment was repeated three times. GAPDH, glyceraldehyde-3-phosphate dehydrogenase; APS, alkaline phosphatase staining; PI, propidium iodide; FITC, fluorescein isothiocyanate. aP<0.05 vs. the mimic-NC+sh-NC group; bP<0.01 vs. the mimic-NC+sh-NC group; cP<0.05 vs. the miR-181a-5p-mimic+sh-NC group; dP<0.01 vs. the miR-181a-5p-mimic+sh-NC group.
![]()
The following experiments demonstrated that in comparison to the mimic-NC+sh-NC group, the MC3T3-E cells in the miR-181a-5p-mimic+sh-NC group showed decreases in the number of calcified nodules, ALP staining and activity, and the expression levels of osteogenesis-related proteins (OCN, OPN, Col1A1, and ALP), as well as elevated apoptosis; these patterns were all reversed in the mimic-NC+sh-AIF-1 group. Additionally, the miR-181a-5p overexpression-induced reductions in the calcified nodule number, ALP staining and activity, and the expression levels of osteogenesis-related proteins (OCN, OPN, Col1A1, and ALP), were reversed when AIF-1 was simultaneously silenced (Fig. 7D-I). The above results indicate that miR-181a-5p may promote AIF-1 transcription by downregulating Runx1, thereby inhibiting osteogenic differentiation and promoting apoptosis in MC3T3-E cells.
Downregulation of miR-181a-5p promotes bone formation in postmenopausal osteoporotic mice
To investigate whether downregulation of miR-181a-5p in vivo could increase bone formation, we established an OVX-induced mouse model in C57BL/6 mice to mimic postmenopausal osteoporosis in vivo. Antagomir-miR-181a-5p was injected via the tail vein in OVX-induced mice, designated as the antagomir-miR-181a-5p group. miR-181a-5p and AIF-1 expression increased, and Runx1 expression decreased in the OVX and antagomir-NC groups versus the sham group. Meanwhile, OVX-induced mice with the injection of antagomir-miR-181a-5p contributed to a reduction in miR-181a-5p and AIF-1 expression and an elevation in Runx1 expression (Fig. 8A-C).
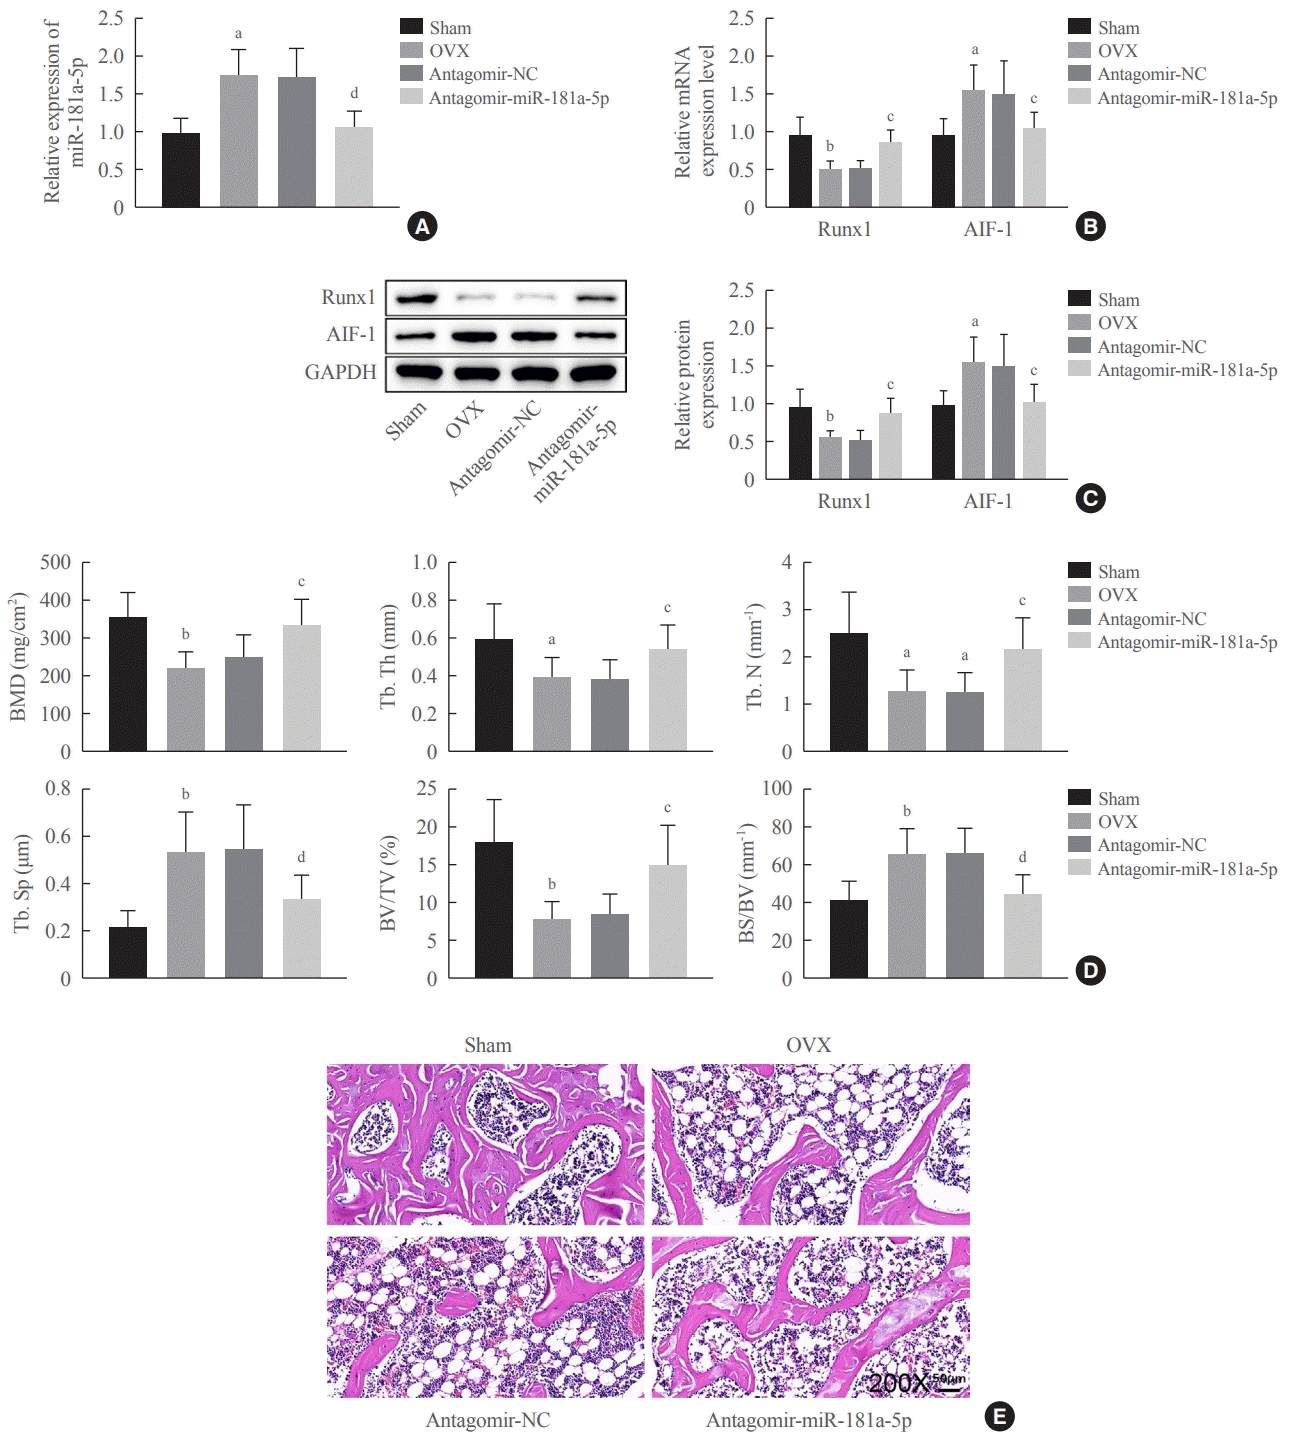
Fig. 8.
Downregulation of miR-181a-5p promoted bone formation in postmenopausal osteoporotic mice. (A, B, C) Expression of miR-181a- 5p, allograft inflammatory factor-1 (AIF-1), and Runt-related transcription factor 1 (Runx1) was detected by quantitative real-time polymerase chain reaction (qRT-PCR) and Western blot assays. (D) Micro-computed tomography for analyzing the changes in bone microstructure parameters of mouse femurs in each group. (E) Hematoxylin and eosin staining of mouse femurs (×200). Comparisons among multiple groups were conducted using one-way analysis of variance, followed by the Tukey multiple-comparison test (n=6). OVX, ovariectomy; GAPDH, glyceraldehyde-3-phosphate dehydrogenase; BMD, bone mineral density; Tb.Th, trabecular bone thickness; Tb.N, trabecular bone number; Tb.Sp., trabecular bone separation; BV/TV, bone volume fraction; BS/BV, bone surface/bone volume. aP<0.05 vs. the sham group; bP<0.01 vs. the sham group; cP<0.05 vs. the antagomir-NC group; dP<0.01 vs. the antagomir-negative control (NC) group.
![]()
Micro-computed tomography (micro-CT) was utilized to analyze the bone microstructure of the femurs of mice in each group. Micro-CT showed lower BMD, Tb.Th, Tb.N, and BV/TV, together with higher Tb.Sp and BS/BV in the OVX group, versus the sham group, indicating that the osteoporosis mouse model was successfully established. OVX-induced mice that received injections of antagomir-miR-181a-5p exhibited elevations of BMD, Tb.Th, Tb.N, BV/TV, and bone mass, and reductions of Tb.Sp and BS/BV (Fig. 8D). H&E staining of the mouse femurs showed that the structure of bone trabeculae was relatively complete, and bone was obviously preserved in the sham group. In the OVX and antagomir-NC groups, a large quantity of bone trabeculae was lost, and the bone loss was obvious. Bone loss in the bone trabeculae was alleviated, and most of its structure was preserved in the antagomir-miR-181a-5p group (Fig. 8E). These results imply that downregulating miR-181a-5p alleviates osteoporosis in postmenopausal mice by increasing bone formation.
DISCUSSION
Osteoporosis is a systemic skeletal disorder associated with bone fragility and elevated fracture risk [21]. miRNAs have emerged as regulators of bone development in multiple aspects and have shown promise as diagnostic markers for bone disorders, including osteoporosis [22,23]. In the context of bone formation, subsets of miRNAs exert roles in either early or late stages of osteoblast and osteoclast differentiation by targeting suppressors of pathways involving in these cells, thus mediating the progressive differentiation [24]. Our study principally unveiled that miR-181a-5p curbed the differentiation of pre-osteoblast MC3T3-E1 in vitro, partially through impairing Runx1-dependent inhibition of AIF-1 transcription. Of note, miR-181a-5p antagomir could alter the bone microarchitecture and augment bone formation, contributing to the prevention of postmenopausal osteoporosis.
First of all, this study reported upregulated miR-181a-5p in serum samples of patients with osteoporosis, which was in line with the findings of high-throughput sequencing data in a previous study [25]. Conversely, miR-181a-5p was reduced in a time-dependent fashion following the induction of MC3T3-E1 cell differentiation. Thus, a miR-181a-5p mimic was introduced into OIM-induced MC3T3-E1 cells, which rescued the expression of miR-181a-5p and consequently decelerated the osteoblast differentiation and matrix mineralization, accompanied by accelerated cell apoptosis. At the molecular levels, the mRNA and protein expression patterns of OCN, OPN, Col1A1, and ALP were reduced upon miR-181a-5p gain-of-function in MC3T3-E1 cells. Similarly, miR-181a-5p re-expression downregulates the levels of OPN, OCN, and Runt-related transcription factor 2 (Runx2) in human bone marrow MSCs, leading to limited osteogenic differentiation [25]. Another study has also demonstrated that miR-181a targets an osteoblast-related transcription factor (Msx2) and negatively modulates osteoblastic differentiation in induced pluripotent stem cells [26]. The animal experiments in our study offered additional evidence, suggesting that targeting miR-181a-5p could enhance bone formation in OVX-induced mice rendered with osteoporosis, showing its promise as a therapeutic strategy against postmenopausal osteoporosis. However, the mechanisms underpinning the inhibitory role of miR-181a-5p in osteogenic differentiation remain undefined, which prompted us to decipher possible downstream targets of miR-181a-5p during this process.
Our results from the StarBase database and dual-luciferase reporter gene assay uncovered that miR-181a-5p could directly bind to Runx1 and inversely modulated the expression of this gene. It has been proposed that Runx1 acts as a target of miR-181a based on the prediction results of TargetScan and validation results from a dual-luciferase reporter gene assay [18]. Furthermore, we experimentally determined that Runx1 was poorly expressed in the serum of patients with osteoporosis and it was time-dependently elevated during osteogenic differentiation. The relationship of Runx1 to osteogenic differentiation has been widely reported. Runx1 knockdown downregulates genes and proteins pertaining to osteogenic differentiation (osterix [OSX], OCN, and OPN), and Runx1 silencing also curbs osteogenesis in bone marrow MSCs by attenuating osteogenic differentiation and mineralization [27]. Not only can Runx1 loss in chondrocytes impede osteoblast differentiation, but its genetic deletion in mice can also downregulate osteogenic differentiation modulators (OSX, Runx2, activating transcription factor 4 [ATF4]) and osteoblast markers (OCN, OPN) in the osteoblasts, contributing to suppressed trabecular bone formation [28]. Consistently, another study has reported that Runx1 depletion induced reductions in OCN, OSX, ATF4, and Runx2 levels in osteoblasts [29]. This study likewise observed that shRNA-based silencing of Runx1 hindered osteogenic differentiation and matrix mineralization and facilitated the apoptosis of MC3T3-E1 cells, corresponding to reduced OCN, OPN, Col1A1, and ALP levels.
Last but not least, a mechanistic investigation by JASPAR further suggested that Runx1 could bind to the AIF-1 promoter. Thereafter, luciferase and ChIP assays validated the strong binding affinity between Runx1 and the AIF-1 promoter. Thus, Runx1 acted as a transcription factor to impair the transcription of AIF-1, which was abundantly expressed in the serum of patients with osteoporosis. AIF-1 is a 17-kDa cytoplasmic calcium-binding protein principally originating from monocytes, macrophages, and lymphocytes that is involved in chronic inflammation and potentially engaged in the pathogenesis of atherosclerosis, diabetes, and metabolic disturbances [30]. Silencing of AIF1 has been reported to restrain the differentiation of bone marrow cells or monocytes into macrophages and that of hematopoietic stem progenitors into dendritic cells [31,32]. In the current study, miR-181a-5p mimic elevated the expression of AIF-1, while AIF-1 knockdown caused enhanced deposition of calcified nodules and ALP activity in the presence of miR-181a-5p, indicating that miR-181a-5p might promote the transcription of AIF-1 by targeting Runx1 to repress osteogenic differentiation. Due to the lack of information relating AIF-1 to either osteogenic differentiation or osteoporosis, more studies are required to confirm the involvement of AIF-1 in the process of osteogenic differentiation.
Our study demonstrated that miR-181a-5p inhibition expedited osteogenic differentiation and bone formation partially by promoting Runx1 expression and subsequently inhibiting AIF-1 transcription. This study contributes to the development of miRNA-targeted therapeutics for osteoporosis and may broaden the current understanding of the miRNA-mRNA interactions involved in bone formation. Future research can explore other possible targets of miR-181a-5p and downstream factors of Runx1 responsible for the effects of miR-181a-5p.
 XML Download