

 PDF
PDF Citation
 Print
Print


INTRODUCTION
METHODS
Literature search strategy
Inclusion and exclusion criteria
Data extraction
Quality assessment
Data synthesis and analysis
RESULTS
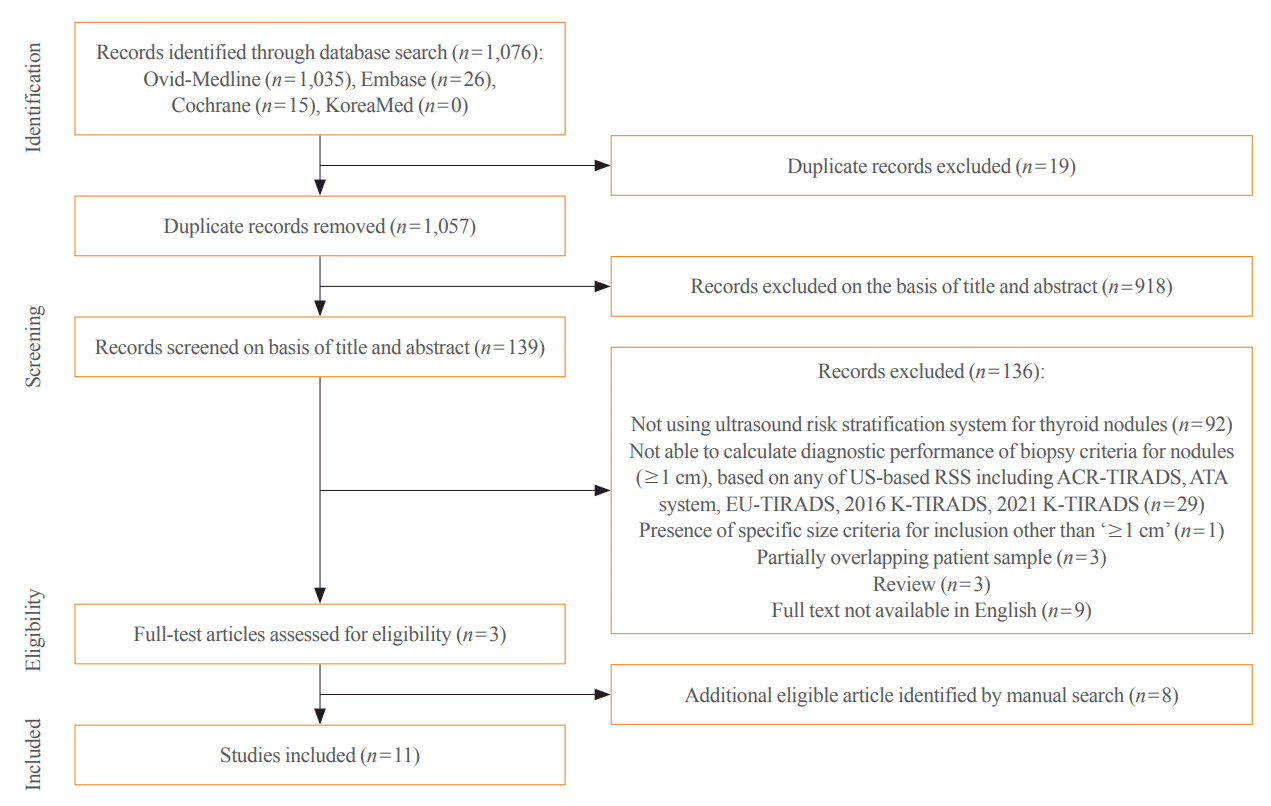
Literature search and eligibility criteria
Characteristics of the included studies
Table 1.
| Study | Country | Study design | Period | No. of included patients | Mean age (range), yr | No. of male patients (male proportion, %) | No. of nodules (≥1 cm) diagnosed with the reference standard | No. of malignant nodules (≥1 cm, malignancy rate, %) | Mean size (range), cm |
US-based RSSs |
Reference standard |
||||||
|---|---|---|---|---|---|---|---|---|---|---|---|---|---|---|---|---|---|
| ACR | ATA | EU | 2016 K | 2021 K | Surgery | Biopsy (FNA w/wo CNB) | US follow-upa | ||||||||||
| Chung et al. (2021) [33]b | Korea | Multicenter, retrospective | 06/2015–09/2015 | 5,081 | 53.2 (19–76) | 905 (17.8) | 5,708 | 1,111 (19.5) | 2.1 (1–10) | N | N | N | Y | Yc | Y | Y | N |
| Eidt et al. (2023) [32] | Brazil | Single, prospective | 01/2019–12/2021 | 149 | 55.0 (NA) | 20 (13.4) | 168 | 11 (6.5) | 2.6 (1.9–4.0)d | Y | N | Y | N | N | Y | Y | N |
| Grani et al. (2019) [16] | Italy | Single, prospective | 11/2015–05/2018 | 477 | 55.9 (NA) | 119 (24.9) | 502 | 36 (7.2) | NA | Y | Y | Y | Y | N | Y | Y | N |
| Ha et al. (2018) [20] | Korea | Multicenter, retrospective | 06/2013–05/2015 | 750 | 49.2 (9–81)e | 156 (20.8) | 586f | 101 (17.2)f | 1.5 (NA) | Y | Y | N | Y | N | Y | Y | N |
| Ha et al. (2018) [15] | Korea | Multicenter, retrospective | 01/2010–05/2011 | 1,802 | 51.2 (13–79) | 415 (23.0) | 2,000 | 454 (22.7) | 2 (1–NA) | Y | Y | N | Y | N | Y | Y | Y |
| Ha et al. (2021) [29]b | Korea | Multicenter, retrospective | 06/2015–09/2015 | 5,081 | 53.2 (19–93) | 905 (17.8) | 5,708 | 1,111 (19.5) | 2.1 (1–10) | Y | N | Y | N | Yg | Y | Y | N |
| Ha et al. (2019) [17] | Korea | Single, retrospective | 01/2013–12/2013 | 3,190 | 53.4 (14–94) | 673 (21.1) | 3,323 | 856 (25.8) | 1.4 (0.3–9.6) | Y | Y | N | Y | N | Y | Y | Y |
| Huh et al. (2021) [30] | Korea | Single, retrospective | 03/2017–01/2019 | 2,084 | 50.4 (19–92) | 433 (20.8) | 2,106 | 522 (24.8) | 2.3 (1–10) | Y | N | N | N | N | Y | Y | N |
| Middleton et al. (2018) [21] | USA | Multicenter, retrospective | 01/2006–12/2010 | 3,315 | 54.4 (18–97) | NA | 3,179h | 288 (9.1)f | NA | Y | Y | N | Y | N | Y | Y | N |
| Na et al. (2021) [31] | Korea | Single, retrospective | 01/2011–12/2019 | 3,088 | 56.0 (47–64)h | 591 (19.1) | 3,826 | 549 (14.3) | 1.7 (1–10)c | Y | Y | Y | Y | N | Y | Y | N |
| Tan et al. (2020) [28] | Malaysia | Single, retrospective | 08/2017–01/2020 | 128 | 51.8 (NA) | 21 (16.7) | 144 | 7 (4.9) | 2.1 (NA) | Y | N | Y | Y | N | N | Y | N |
RSS, risk stratification system; ACR, American College of Radiology; ATA, American Thyroid Association; EU, European; K, Korean; FNA, fine-needle aspiration; w/wo, with or without; CNB, core needle biopsy; US, ultrasonography; NA, not available.
a In studies that regarded follow-up as a reference standard, thyroid nodules with initial benign results on biopsy and decreased or stable size on follow-up US at more than 12 months were finally diagnosed as benign;
b These two studies shared the same study cohort with different purposes (2021 Korean Thyroid Imaging Reporting and Data System [K-TIRADS] vs. 2016 K-TIRADS [33]; 2021 K-TIRADS vs. foreign RSSs [29]). We representatively cited Chung et al. [33] for the outcomes from the 2021 K-TIRADS (2021 K-TIRADS1.0 or 2021 K-TIRADS1.5) throughout this study, unless it was necessary to specifically cite the study of Ha et al. [29];
c Modified K-TIRADS 1 and modified K-TIRADS 3 correspond to the 2021 K-TIRADS1.0 and 2021 K-TIRADS1.5, respectively;
f These numbers only represent those of thyroid nodules measuring ≥1 cm in each study, after excluding sub-centimeter nodules that were originally included in these study cohorts;
![]()
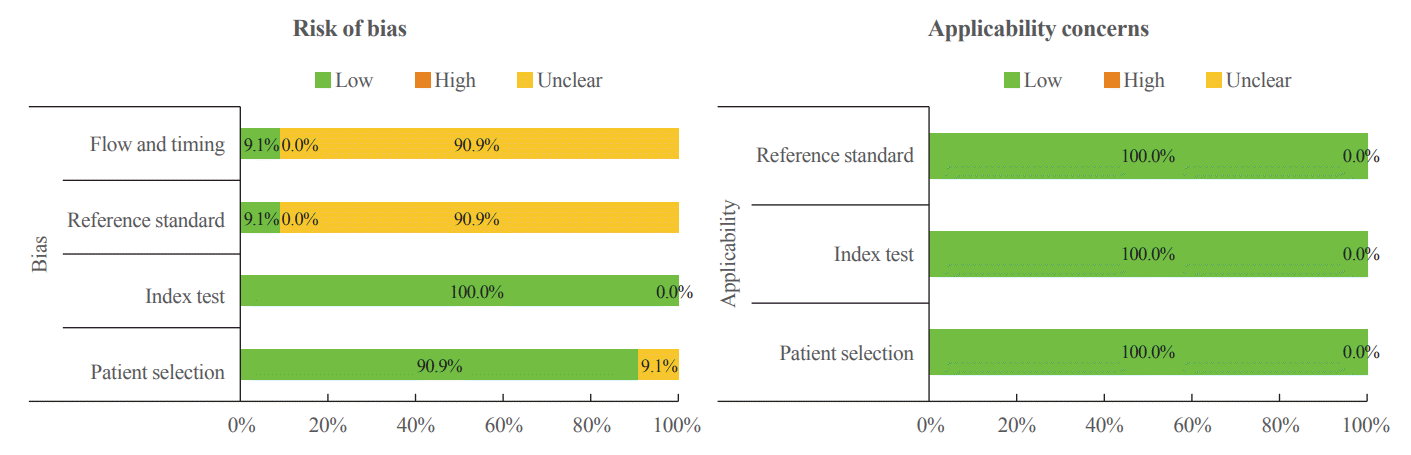
Quality assessment
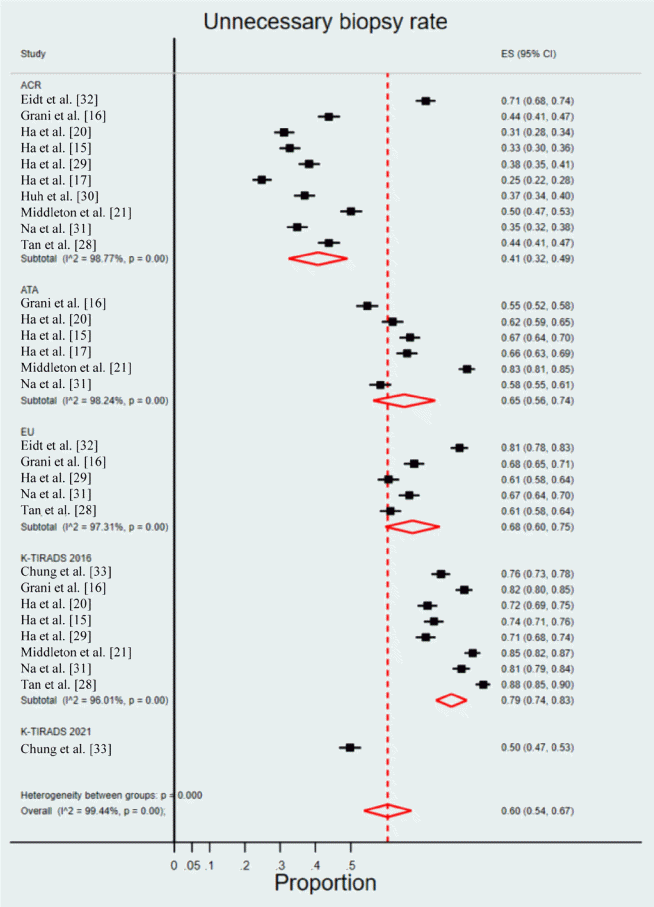
Diagnostic performance
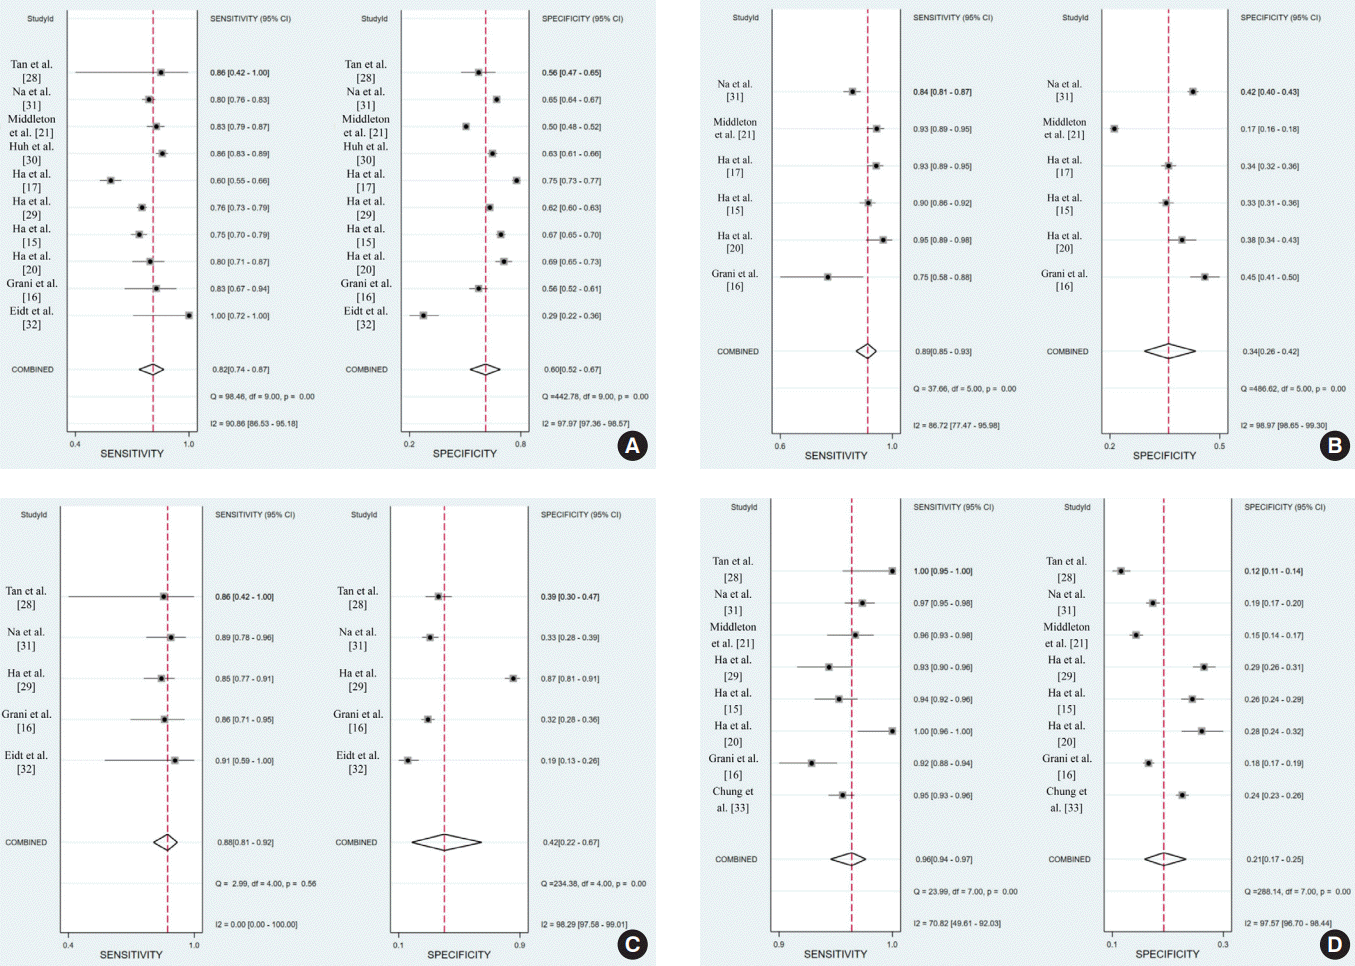 | Figure 3.Sensitivity and specificity of the (A) American College of Radiology (ACR)-Thyroid Imaging Reporting and Data System (TIRADS), (B) American Thyroid Association (ATA) system, (C) European (EU)-TIRADS, and (D) 2016 Korean (K)-TIRADS. CI, confidence interval.
|
Table 2.
| RSS | Study | No. of included nodules (≥1 cm, malignant/total) | Sensitivity | Specificity | Positive predictive value | Negative predictive value | Accuracy | Unnecessary biopsy rate (1-specificity) |
|---|---|---|---|---|---|---|---|---|
| ACR-TIRADS | Eidt et al. (2023) [32] | 11/168 | 100 (100–100.0) | 28.7 (21.6–35.7) | 8.9 (3.9–14.0) | 100.0 (100–100.0) | 33.3 (26.3–41.0) | 71.3 |
| Grani et al. (2019) [16] | 36/502 | 83.3 (67.2–93.6) | 56.2 (51.6–60.8) | 12.8 (8.8–17.8) | 97.8 (95.2–99.2) | 58.2 (53.7–62.5) | 43.8 | |
| Ha et al. (2018) [20] | 101/586 | 80.2 (71.1–87.5) | 68.9 (64.5–73.0) | 34.9 (31.3–38.7) | 94.4 (91.8–96.1) | 70.8 (67.0–74.5) | 31.1 | |
| Ha et al. (2018) [15] | 454/2,000 | 74.7 (70.7–78.7) | 67.3 (65.0–69.7) | 40.2 (36.9–43.5) | 90.1 (88.3–91.8) | 69.0 (67.0–71.0) | 32.7 | |
| Ha et al. (2021) [29] | 1,111/5,708 | 76.1 (73.5–78.5) | 61.8 (60.4–63.2) | 32.5 (30.7–34.3) | 91.4 (90.4–92.4) | 64.6 (63.3–65.8) | 38.2 (36.8–39.6) | |
| Ha et al. (2019) [17] | 321/1,938 | 60.1 (54.5–65.5) | 75.2 (73.0–77.3) | 32.5 (29.9–35.3) | 90.5 (89.2–91.6) | 72.7 (70.7–74.7) | 24.8 | |
| Huh et al. (2021) [30] | 522/2,106 | 86.4 (83.5–89.3) | 63.1 (60.8–65.5) | 43.6 (40.6–46.6) | 93.4 (91.9–94.9) | 68.9 (66.9–70.9) | 36.9 | |
| Middleton et al. (2018) [21] | 288/3,179 | 83.3 (78.5–87.5) | 49.9 (48.1–52.8) | 14.2 (13.5–15.0) | 96.8 (95.9–97.5) | 53.0 (51.2–54.7) | 50.1 | |
| Na et al. (2021) [31] | 549/3,826 | 79.6 (76.0–82.9) | 65.2 (63.6–66.9) | 27.7 (25.5–30.0) | 95.0 (94.0–95.9) | 67.3 (65.8–68.8) | 34.8 | |
| Tan et al. (2020) [28] | 7/144 | 85.7 (42.7–97.4) | 56.2 (47.8–64.2) | 9.1 (6.5–12.5) | 98.7 (92.6–99.8) | 57.6 (49.1–65.8) | 43.8 | |
| ATA system | Grani et al. (2019) [16] | 36/502 | 75.0 (57.8–87.9) | 45.3 (40.7–49.9) | 9.6 (6.4–13.6) | 95.9 (92.4–98.1) | 47.4 (43.0–51.9) | 54.7 |
| Ha et al. (2018) [20] | 101/586 | 95.0 (88.8–98.4) | 38.1 (33.8–42.6) | 24.2 (22.8–25.8) | 97.4 (94.0–98.9) | 48.0 (43.8–52.1) | 61.9 | |
| Ha et al. (2018) [15] | 454/2,000 | 89.6 (86.9–92.5) | 33.2 (30.8–35.5) | 28.3 (25.9–30.6) | 91.6 (89.3–93.9) | 46.0 (43.8–48.2) | 66.8 | |
| Ha et al. (2019) [17] | 321/1,938 | 92.5 (89.1–95.2) | 34.0 (31.6–36.3) | 21.8 (21.0–22.6) | 95.8 (93.9–97.1) | 43.7 (41.4–45.9) | 66.0 | |
| Middleton et al. (2018) [21] | 288/3,179 | 92.7 (89.1–95.4) | 17.0 (15.7–18.4) | 10.0 (9.7–10.4) | 95.9 (93.9–97.3) | 23.9 (22.4–25.4) | 83.0 | |
| Na et al. (2021) [31] | 549/3,826 | 84.0 (80.6–86.9) | 41.6 (39.9–43.3) | 19.4 (17.8–21.1) | 93.9 (92.6–95.1) | 47.7 (46.0–49.2) | 58.4 | |
| EU-TIRADS | Eidt et al. (2023) [32] | 11/168 | 90.9 (73.9–99.9) | 19.1 (13.0–25.3) | 7.3 (2.9–11.7) | 96.8 (90.6–100.0) | 23.8 (17.6–31.0) | 80.9 |
| Grani et al. (2019) [16] | 36/502 | 86.1 (70.5–95.3) | 32.0 (27.8–36.4) | 8.9 (6.1–12.4) | 96.7 (92.6–98.9) | 35.9 (31.7–40.2) | 68.0 | |
| Ha et al. (2021) [29] | 1,111/5,708 | 84.6 (82.4–86.6) | 39.3 (37.9–40.7) | 25.2 (23.8–26.6) | 91.4 (90.0–92.5) | 48.1 (46.8–49.4) | 60.7 (59.3–62.1) | |
| Na et al. (2021) [31] | 549/3,826 | 88.3 (85.4–90.9) | 33.4 (31.7–35.0) | 18.2 (16.7–19.7) | 94.5 (93.0–95.7) | 41.2 (39.7–42.8) | 66.6 | |
| Tan et al. (2020) [28]a | 7/144 | 85.7 (42.1–99.6) | 38.7 (30.5–47.4) | 6.7 (4.9–9.0) | 98.2 (89.5–99.7) | 41.0 (32.9–49.5) | 61.3 | |
| 2016 K-TIRADS | Chung et al. (2021) [33] | 1,111/5,708 | 94.9 (93.4−96.0) | 24.4 (23.2−25.7) | 23.3 (22.1−24.5) | 95.2 (93.8−96.3) | 38.1 (36.9−39.4) | 75.6 |
| Grani et al. (2019) [16] | 36/502 | 91.7 (77.5–98.2) | 17.8 (14.4–21.6) | 7.9 (5.5–11) | 96.5 (90.2–99.3) | 23.1 (19.5–27.1) | 82.2 | |
| Ha et al. (2018) [20] | 101/586 | 100 (96.4–100) | 28.2 (24.3–32.5) | 22.5 (21.5–23.5) | 100 | 40.6 (36.6–44.7) | 71.8 | |
| Ha et al. (2018) [15] | 454/2,000 | 94.5 (92.4, 96.6) | 26.4 (24.2–28.6) | 27.4 (25.2–29.6) | 94.2 (92.0–96.4) | 41.9 (39.7–44.0) | 73.6 | |
| Ha et al. (2021) [29] | 321/1,938 | 93.5 (90.2–95.9) | 28.7 (26.5–31.0) | 20.6 (20.0–21.4) | 95.7 (93.6–97.1) | 39.4 (37.2–41.6) | 71.3 | |
| Middleton et al. (2018) [21] | 288/3,179 | 96.2 (93.3–98.1) | 15.4 (14.1–16.7) | 10.2 (9.9–10.4) | 97.6 (95.7–98.6) | 22.7 (21.2–24.2) | 84.6 | |
| Na et al. (2021) [31] | 549/3,826 | 96.9 (95.1–98.2) | 18.6 (17.3–20.0) | 16.6 (15.4–18.0) | 97.3 (95.7–98.4) | 29.9 (28.4–31.4) | 81.4 | |
| Tan et al. (2020) [28] | 7/144 | 100 (59.0–100) | 12.4 (7.4–19.1) | 5.5 (5.2–5.9) | 100 (100–100.0) | 16.7 (11.0–23.8) | 87.6 | |
| 2021 K-TIRADS1.0a | Chung et al. (2021) [33] | 1,111/5,708 | 91.0 (89.2−92.5) | 39.7 (38.3−41.1) | 26.7 (25.3−28.2) | 94.8 (93.7−95.7) | 49.7 (48.4−51.0) | 60.3 (58.9−61.7) |
| 2021 K-TIRADS1.5b | Chung et al. (2021) [33] | 1,111/5,708 | 76.1 (73.6−78.6) | 50.2 (48.7−51.6) | 27.0 (25.5−28.6) | 89.7 (88.5−90.8) | 55.2 (53.9−56.5) | 49.8 (48.4–51.3) |
![]()
 XML Download