Journal List > Intest Res > v.20(3) > 1516081362

Kim, Kim, Lee, Lee, Yoon, Kim, Myung, and Moon: Evaluation of nutritional status using bioelectrical impedance analysis in patients with inflammatory bowel disease

Abstract

Background/Aims

Nutritional status influences quality of life among patients with inflammatory bowel disease (IBD), although there is no clear method to evaluate nutritional status in this setting. Therefore, this study examined whether bioelectrical impedance analysis (BIA) could be used to evaluate the nutritional status of patients with IBD.

Methods

We retrospectively analyzed data from 139 Korean patients with IBD who were treated between November 2018 and November 2019. Patients were categorized as having active or inactive IBD based on the Harvey-Bradshaw index (a score of ≥5 indicates active Crohn’s disease) and the partial Mayo scoring index (a score of ≥2 indicates active ulcerative colitis). BIA results and serum nutritional markers were analyzed according to disease activity.

Results

The mean patient age was 45.11±17.71 years. The study included 47 patients with ulcerative colitis and 92 patients with Crohn’s disease. Relative to the group with active disease (n=72), the group with inactive disease (n=67) had significantly higher values for hemoglobin (P<0.001), total protein (P<0.001), and albumin (P<0.001). Furthermore, the group with inactive disease had higher BIA values for body moisture (P=0.047), muscle mass (P=0.046), skeletal muscle mass (P=0.042), body mass index (P=0.027), and mineral content (P=0.034). Moreover, the serum nutritional markers were positively correlated with the BIA results.

Conclusions

Nutritional markers evaluated using BIA were correlated with serum nutritional markers and inversely correlated with disease activity. Therefore, we suggest that BIA may be a useful tool that can help existing nutritional tests monitor the nutritional status of IBD patients.

INTRODUCTION

The number of patients with inflammatory bowel disease (IBD) is increasing worldwide [1]. Furthermore, increasing Westernization of lifestyle has led to increasing prevalence of IBD (including ulcerative colitis [UC] and Crohn’s disease [CD]) in Korea and other Asian countries [2-4]. Cases of IBD involve chronic inflammation and ulcers in the small bowel and colon, with repeated cycles of improvement and recurrence [5]. Therefore, malnutrition is common among IBD patients and is affected by various factors, including poor food choices, malabsorption, and disease activity [6-9]. Nutritional management has very important effects on the patient’s quality of life [10-12], and is traditionally evaluated using blood tests, the Malnutrition Universal Screening Tool, and the Mini-Nutritional Assessment [13]. However, there is no clear way to monitor the nutritional status of IBD patients.
Bioelectrical impedance analysis (BIA) is a simple and non-invasive test (unlike blood testing) that can be used to evaluate the physical condition of the human body [14,15]. This test can be used to evaluate various aspects of the body based on the resistance encountered when a small electrical current passes from the measuring device through the body. This strategy relies on the principle that the electric current encounters less resistance in muscles with substantial water content and greater resistance in fat tissues with low water content [15]. Commonly measured parameters include body mass index (BMI), body moisture, muscle mass, skeletal muscle mass, body fat, and minerals. Thus, BIA is an important part of nutritional evaluation [16,17], although only a few studies have evaluated BIA in patients with IBD [18,19]. The present study aimed to evaluate the nutritional status of IBD patients using blood tests and BIA, with analyses stratified according to disease activity, and to determine whether the results from the blood tests and BIA were correlated.

METHODS

1. Patients

This retrospective study evaluated the medical records of 139 patients (including outpatients and inpatients) with IBD who tested the BIA between November 2018 and November 2019. Patients were excluded if they had a history of disease that might affect nutritional status, such as chronic kidney disease (CKD) and heart failure (HF). Cases of CKD were identified based on a glomerular filtration rate of < 60 mL/min/1.73 m2, outpatient treatment for CKD, or use of hemodialysis or peritoneal dialysis for CKD. Cases of HF were identified based on outpatient treatment for HF or echocardiography results that indicated systolic or diastolic heart dysfunction. Patients were considered eligible if they underwent blood testing and BIA within a 14-day period, and patients were excluded if there was an interval of > 14 days between the 2 tests. Data were collected regarding clinical features, laboratory results, and BIA results. The study’s retrospective protocol was approved by the Institutional Review Board of Seoul Paik Hospital (IRB No. 2020-02-006-001), which waived the requirement for informed consent.

2. Nutritional Markers

Nutritional status was evaluated using extensive BIA and traditional blood-based biochemical markers. The blood tests evaluated serum concentrations of protein, albumin, hemoglobin, cholesterol, triglycerides, and C-reactive protein (CRP), as well as the erythrocyte sedimentation rate (ESR). The BIA was performed using an INBODY 770 device (InBody Co. Ltd., Seoul, Korea), which measured BMI, body fat percentage, skeletal muscle mass, body moisture, muscle mass, mineral content, and body fat. The muscles of the human body are largely divided into 3 types such as the myocardium that makes up the heart wall, the visceral muscle related to visceral movement, and the skeletal muscle that moves the body by attaching to the bones. Muscle mass is the amount of muscle that contains myocardium, visceral muscle, and skeletal muscle.

3. Disease Activity

The patients were classified as having active or inactive disease, and the nutritional markers were compared according to disease activity status. Disease activity was assessed using the partial Mayo score and Harvey-Bradshaw index (HBI) for UC and CD, respectively. The partial Mayo score includes reported stool frequency, presence of rectal bleeding, and a global assessment of the physician. A partial Mayo score of 2 or higher was defined as active UC [20]. The HBI includes general well-being, number of liquid stools per day, abdominal pain, abdominal mass, and complications. An HBI score of 5 or higher was defined as active CD [21].

4. Statistical Analysis

The values for each item were compared between the active and inactive groups. Analyses were performed using the independent samples t-test, Levene test, and bivariate correlation analysis. Levene test was used to check whether each group satisfies the equal variance. Independent samples t-test was used to compare the results of the active group and the inactive group. The bivariate correlation (Pearson) analysis was used to determine the correlation of each nutritional marker. The confidence interval (CI) was considered statistically significant when the 95% CI was satisfied. Differences were considered statistically significant at a P-value of < 0.05. All analyses were performed using SPSS software version 25.0 (IBM Corp., Armonk, NY, USA).

RESULTS

1. Patient Characteristics

A review of the medical records identified 146 patients with IBD, although 7 patients were excluded because of CKD (4 patients), HF (1 patient), or a > 14-day interval between the blood testing and BIA (2 patients). Thus, the study evaluated data from 139 patients (mean age, 45.11 ± 17.71 years; range, 16–85 years), including 47 patients with UC and 92 patients with CD (Fig. 1). The UC patients included 21 patients with extensive colitis, 8 patients with left-sided colitis, and 18 patients with proctitis. The CD patients included 38 patients with inflammatory behavior (Montreal classification B1), 54 patients with stricturing behavior (Montreal classification B2), and 0 patient with penetrating behavior (Montreal classification B3). Relative to patients with active disease (n=72), patients with inactive disease (n=67) had higher values for hemoglobin (P<0.001), total protein (P<0.001), and albumin (P<0.001). No significant differences were observed for cholesterol and triglyceride concentrations (Table 1).

2. Bioelectrical Impedance Analysis Results

BIA revealed that the patients with inactive disease had significantly higher values for body moisture (P=0.047), muscle mass (P=0.046), skeletal muscle mass (P=0.042), BMI (P=0.027), and mineral (P=0.034). However, there were no significant inter-group differences in terms of body fat and body fat percentage (Table 2).

3. Correlations between the Different Variables

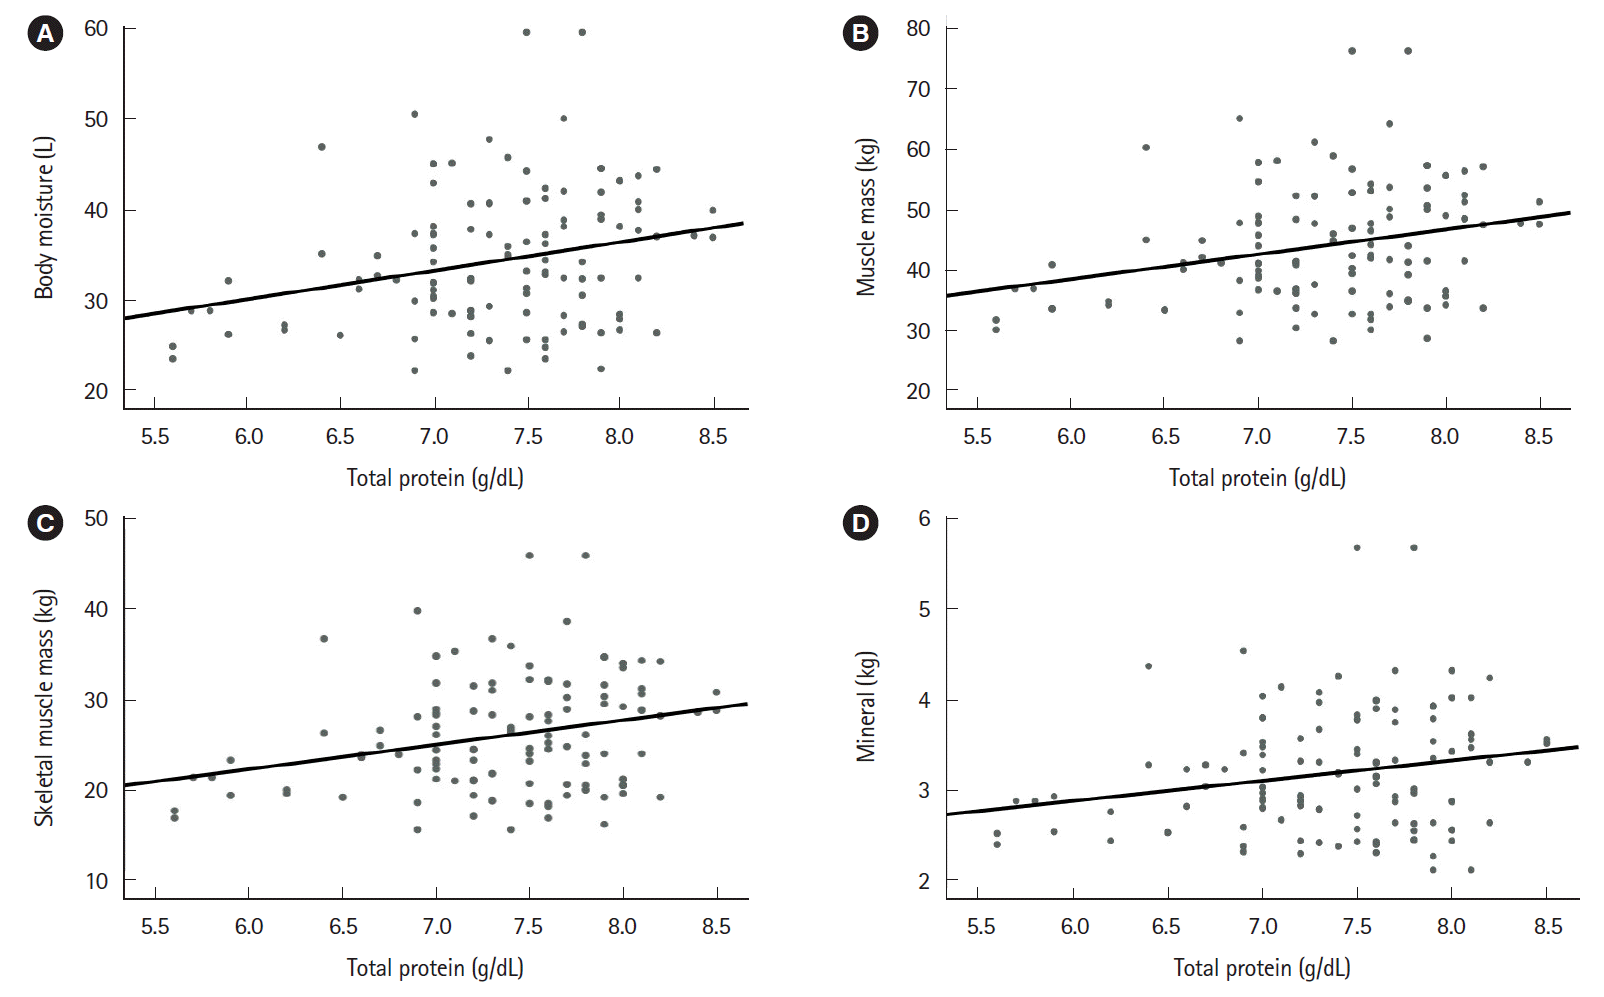
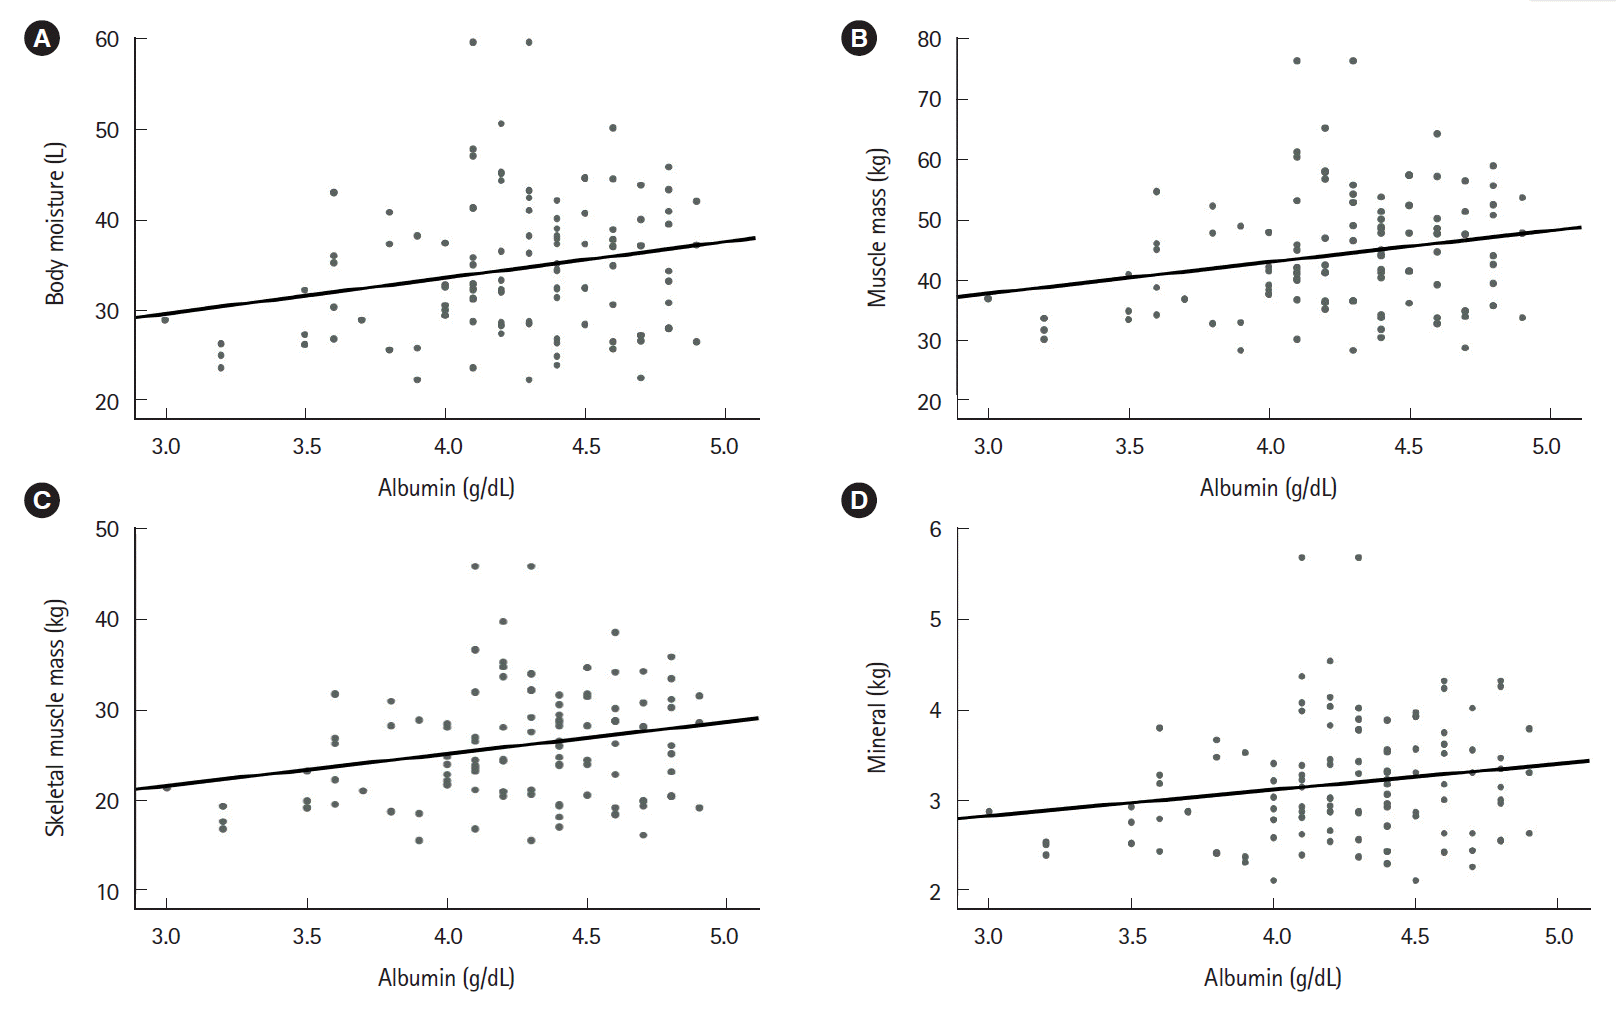
Positive correlations were observed between various blood-based nutritional markers, including hemoglobin, total protein, albumin, and cholesterol concentrations. Furthermore, the nutritional markers were negatively correlated with the inflammatory markers (ESR and CRP). The ESR was negatively correlated with hemoglobin level (Pearson correlation coefficient, r=–0.288; 95% CI, –0.429 to –0.142; P=0.001), and albumin level (r=–0.251; 95% CI, –0.411 to –0.094; P=0.005). CRP was negatively correlated with albumin level (r=–0.190; 95% CI, –0.327 to –0.034; P=0.026), and cholesterol level (r=–0.175; 95% CI, –0.282 to –0.094; P=0.049). Positive correlations were observed between various BIA items, including BMI, mineral, skeletal muscle mass, muscle mass, and body fat. In addition, the blood-based nutritional markers (hemoglobin, total protein, and albumin) were positively correlated with various BIA results (body moisture, muscle mass, skeletal muscle mass, and mineral content) (Figs. 2-4).

DISCUSSION

Malnutrition has negative effects on IBD patients and can reduce their quality of life [22,23]. Therefore, nutritional management is very important for IBD patients, although traditional evaluation methods involve blood tests and questionnaires, which are limited by cost, invasiveness, and complex process. Recent studies have evaluated whether body composition testing can supplement the traditional blood tests and questionnaires in this setting [24]. The present study aimed to expand on that research by using BIA to evaluate a larger number of parameters, relative to previous studies. The results indicate that BIA is a reliable way to evaluate nutritional status, as the results were correlated with the results from the traditional blood-based testing. In this context, BIA can be used to evaluate patients with CKD, HF, and IBD [25,26] and the results are gradually being accepted to guide the medical treatment of these patients. Based on our results, BIA appears to be a simple and useful technique for evaluating the nutritional status of patients with IBD.
The present study revealed that patients with inactive disease had significantly elevated serum nutritional markers (hemoglobin, albumin, and total protein), which agrees with previously reported results [27,28]. These markers are useful for evaluating a patient’s nutritional status, although blood testing is invasive and often expensive, which makes it undesirable for frequent testing. In contrast, BIA is a simple, rapid, and non-invasive testing method that might be useful for frequent testing. In addition, disease activity was associated with significant differences in the BIA results. Diarrhea is the main symptom of active IBD and causes dehydration, which leads to lower body water values [29,30], which can influence the results of BIA. Furthermore, active IBD is associated with poor nutrient absorption and metabolism, because of the excessive inflammatory reactions, which might explain our observation that patients with active disease had significantly lower values for mineral content, muscle mass, skeletal muscle mass, and BMI [31-33]. Moreover, the present study also confirmed that the BIA results were significantly correlated with the traditional blood-based nutritional markers. The current guidelines for monitoring patients with IBD recommend laboratory testing (e.g., CRP as an inflammatory marker) to understand the patient’s condition [34], and some studies have also indicated that protein, albumin, and cholesterol levels are useful for guiding the management of IBD patients [35,36]. Therefore, BIA correlates with nutritional indicators of blood tests, and has the advantage of being simple, rapid, and non-invasive, so it can be useful in evaluating the nutritional status of IBD patients if used in conjunction with the existing evaluation. It is expected that for IBD patients like CKD patients, BIA will be helpful in predicting the current state of the patient by comparing the current value with the previous value in the future. This combined strategy may permit more objective and effective management of patients with IBD.
The present study has several limitations. First, this retrospective study only included a small number of patients in a single center. Second, we could not evaluate the correlations between the BIA results and results from commonly used questionnaires, such as the Malnutrition Universal Screening Tool and the Mini-Nutritional Assessment.
In conclusion, BIA was useful for evaluating the nutritional status of IBD patients, and the results were significantly different according to disease activity status. Thus, this test may be useful for evaluating nutritional status and IBD activity, and might complement the traditional evaluation methods, such as blood tests and questionnaires. Therefore, BIA may be a useful tool that can help existing nutritional tests which monitor the nutritional status of IBD patients.

Notes

Funding Source

This work was supported by the Research Program, funded by the Korea Disease Control and Prevention Agency (2019-ER-6905-02).

Conflict of Interest

Kim YS is an editorial board member of the journal but was not involved in the peer reviewer selection, evaluation, or decision process of this article. No other potential conflicts of interest relevant to this article were reported.

Data Availability Statement

Not applicable.

Author Contribution

Conceptualization: Kim YS, Kim Seung Hyuk. Data curation: Kim YS, Kim Seung Hyuk. Formal analysis: Kim Seung Hyuk. Investigation: Kim YS, Kim Seung Hyuk, Lee SH, Lee HM. Methodology: Kim YS, Kim Seung Hyuk, Lee SH. Project administration: Kim YS. Resources: Kim YS, Kim Seung Hyuk. Software: Kim Seung Hyuk. Supervision: Kim YS. Validation: Kim Seung Hyuk, Moon JS. Visualization: Kim Seung Hyuk, Kim Seo Hyun, Myung HJ, Yoon WE. Writing - original draft: Kim YS, Kim Seung Hyuk. Writing - review & editing: Kim YS, Kim Seung Hyuk. Approval of final manuscript: all authors.

REFERENCES

1. Alatab S, Sepanlou SG, Ikuta K, et al. The global, regional, and national burden of inflammatory bowel disease in 195 countries and territories, 1990-2017: a systematic analysis for the Global Burden of Disease Study 2017. Lancet Gastroenterol Hepatol. 2020; 5:17–30.
2. Kim ES, Kim WH. Inflammatory bowel disease in Korea: epidemiological, genomic, clinical, and therapeutic characteristics. Gut Liver. 2010; 4:1–14.
crossref
3. Ng WK, Wong SH, Ng SC. Changing epidemiological trends of inflammatory bowel disease in Asia. Intest Res. 2016; 14:111–119.
crossref
4. Kaibullayeva J, Ualiyeva A, Oshibayeva A, Dushpanova A, Marshall JK. Prevalence and patient awareness of inflammatory bowel disease in Kazakhstan: a cross-sectional study. Intest Res. 2020; 18:430–437.
crossref
5. Zhang YZ, Li YY. Inflammatory bowel disease: pathogenesis. World J Gastroenterol. 2014; 20:91–99.
crossref
6. Owczarek D, Rodacki T, Domagała-Rodacka R, Cibor D, Mach T. Diet and nutritional factors in inflammatory bowel diseases. World J Gastroenterol. 2016; 22:895–905.
crossref
7. Cohen AB, Lee D, Long MD, et al. Dietary patterns and self-reported associations of diet with symptoms of inflammatory bowel disease. Dig Dis Sci. 2013; 58:1322–1328.
crossref
8. Yoon JY. Nutritional approach as therapeutic manipulation in inflammatory bowel disease. Intest Res. 2019; 17:463–475.
crossref
9. Shafiee NH, Manaf ZA, Mokhtar NM, Raja Ali RA. An assessment of dietary intake, food avoidance and food beliefs in patients with ulcerative colitis of different disease status. Intest Res. 2020; 18:447–458.
crossref
10. Ko KH, Kim YS, Lee BK, et al. Vitamin D deficiency is associated with disease activity in patients with Crohn’s disease. Intest Res. 2019; 17:70–77.
crossref
11. Green N, Miller T, Suskind D, Lee D. A review of dietary therapy for IBD and a vision for the future. Nutrients. 2019; 11:947.
crossref
12. Mentella MC, Scaldaferri F, Pizzoferrato M, Gasbarrini A, Miggiano GA. Nutrition, IBD and gut microbiota: a review. Nutrients. 2020; 12:944.
crossref
13. Kim SE. Nutritional screening and assessment in hospitalized patients. Korean J Gastroenterol. 2015; 65:336–341.
crossref
14. Antonio J, Kenyon M, Ellerbroek A, et al. Body composition assessment: a comparison of the bod pod, InBody 770, and DXA. J Exerc Nutr. 2019; 2:11.
15. Marra M, Sammarco R, De Lorenzo A, et al. Assessment of body composition in health and disease using bioelectrical impedance analysis (BIA) and dual energy X-ray absorptiometry (DXA): a critical overview. Contrast Media Mol Imaging. 2019; 2019:3548284.
crossref
16. Bhattacharya A, Pal B, Mukherjee S, Roy SK. Assessment of nutritional status using anthropometric variables by multivariate analysis. BMC Public Health. 2019; 19:1045.
crossref
17. Krel C, Piko N, Tomazic J, Bevc S. Bioelectrical impedance analysis as a marker of nutritional status in chronically ill patients. Aust J Adv Nurs. 2019; 36:14–21.
18. Bryant RV, Trott MJ, Bartholomeusz FD, Andrews JM. Systematic review: body composition in adults with inflammatory bowel disease. Aliment Pharmacol Ther. 2013; 38:213–225.
crossref
19. Zalizko P, Roshofa TH, Meija L, Bodnieks E, Pukitis A. The role of body muscle mass as an indicator of activity in inflammatory bowel disease patients. Clin Nutr ESPEN. 2020; 40:193–200.
crossref
20. Schroeder KW, Tremaine WJ, Ilstrup DM. Coated oral 5-aminosalicylic acid therapy for mildly to moderately active ulcerative colitis: a randomized study. N Engl J Med. 1987; 317:1625–1629.
crossref
21. Harvey RF, Bradshaw JM. A simple index of Crohn’s-disease activity. Lancet. 1980; 1:514.
crossref
22. Alhagamhmad MH, Day AS, Lemberg DA, Leach ST. An update of the role of nutritional therapy in the management of Crohn’s disease. J Gastroenterol. 2012; 47:872–882.
crossref
23. Cioffi I, Imperatore N, Di Vincenzo O, et al. Association between health-related quality of life and nutritional status in adult patients with Crohn’s disease. Nutrients. 2020; 12:746.
crossref
24. Mijac DD, Janković GL, Jorga J, Krstić MN. Nutritional status in patients with active inflammatory bowel disease: prevalence of malnutrition and methods for routine nutritional assessment. Eur J Intern Med. 2010; 21:315–319.
crossref
25. Kuchnia A, Earthman C, Teigen L, et al. Evaluation of bioelectrical impedance analysis in critically ill patients: results of a multicenter prospective study. JPEN J Parenter Enteral Nutr. 2017; 41:1131–1138.
crossref
26. Wilson FP, Xie D, Anderson AH, et al. Urinary creatinine excretion, bioelectrical impedance analysis, and clinical outcomes in patients with CKD: the CRIC study. Clin J Am Soc Nephrol. 2014; 9:2095–2103.
crossref
27. Kaitha S, Bashir M, Ali T. Iron deficiency anemia in inflammatory bowel disease. World J Gastrointest Pathophysiol. 2015; 6:62–72.
crossref
28. Powell-Tuck J. Protein metabolism in inflammatory bowel disease. Gut. 1986; 27 Suppl 1(Suppl 1):67–71.
crossref
29. Kelsen J, Baldassano RN. Inflammatory bowel disease: the difference between children and adults. Inflamm Bowel Dis. 2008; 14 Suppl 2:S9–S11.
crossref
30. Farthing M, Salam MA, Lindberg G, et al. Acute diarrhea in adults and children: a global perspective. J Clin Gastroenterol. 2013; 47:12–20.
31. Alkhouri RH, Hashmi H, Baker RD, Gelfond D, Baker SS. Vitamin and mineral status in patients with inflammatory bowel disease. J Pediatr Gastroenterol Nutr. 2013; 56:89–92.
crossref
32. Ohlund I, Hernell O, Hörnell A, Stenlund H, Lind T. BMI at 4 years of age is associated with previous and current protein intake and with paternal BMI. Eur J Clin Nutr. 2010; 64:138–145.
crossref
33. Bijelic R, Balaban J, Milicevic S. Correlation of the lipid profile, BMI and bone mineral density in postmenopausal women. Mater Sociomed. 2016; 28:412–415.
crossref
34. Maaser C, Sturm A, Vavricka SR, et al. ECCO-ESGAR Guideline for Diagnostic Assessment in IBD Part 1: initial diagnosis, monitoring of known IBD, detection of complications. J Crohns Colitis. 2019; 13:144–164.
crossref
35. Shiga H, Abe I, Onodera M, et al. Serum C-reactive protein and albumin are useful biomarkers for tight control management of Crohn’s disease in Japan. Sci Rep. 2020; 10:511.
crossref
36. Agouridis AP, Elisaf M, Milionis HJ. An overview of lipid abnormalities in patients with inflammatory bowel disease. Ann Gastroenterol. 2011; 24:181–187.
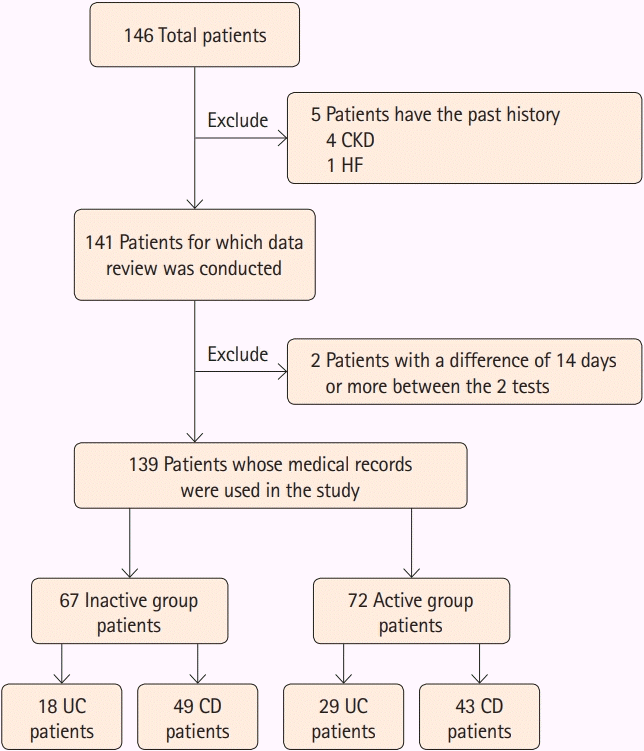
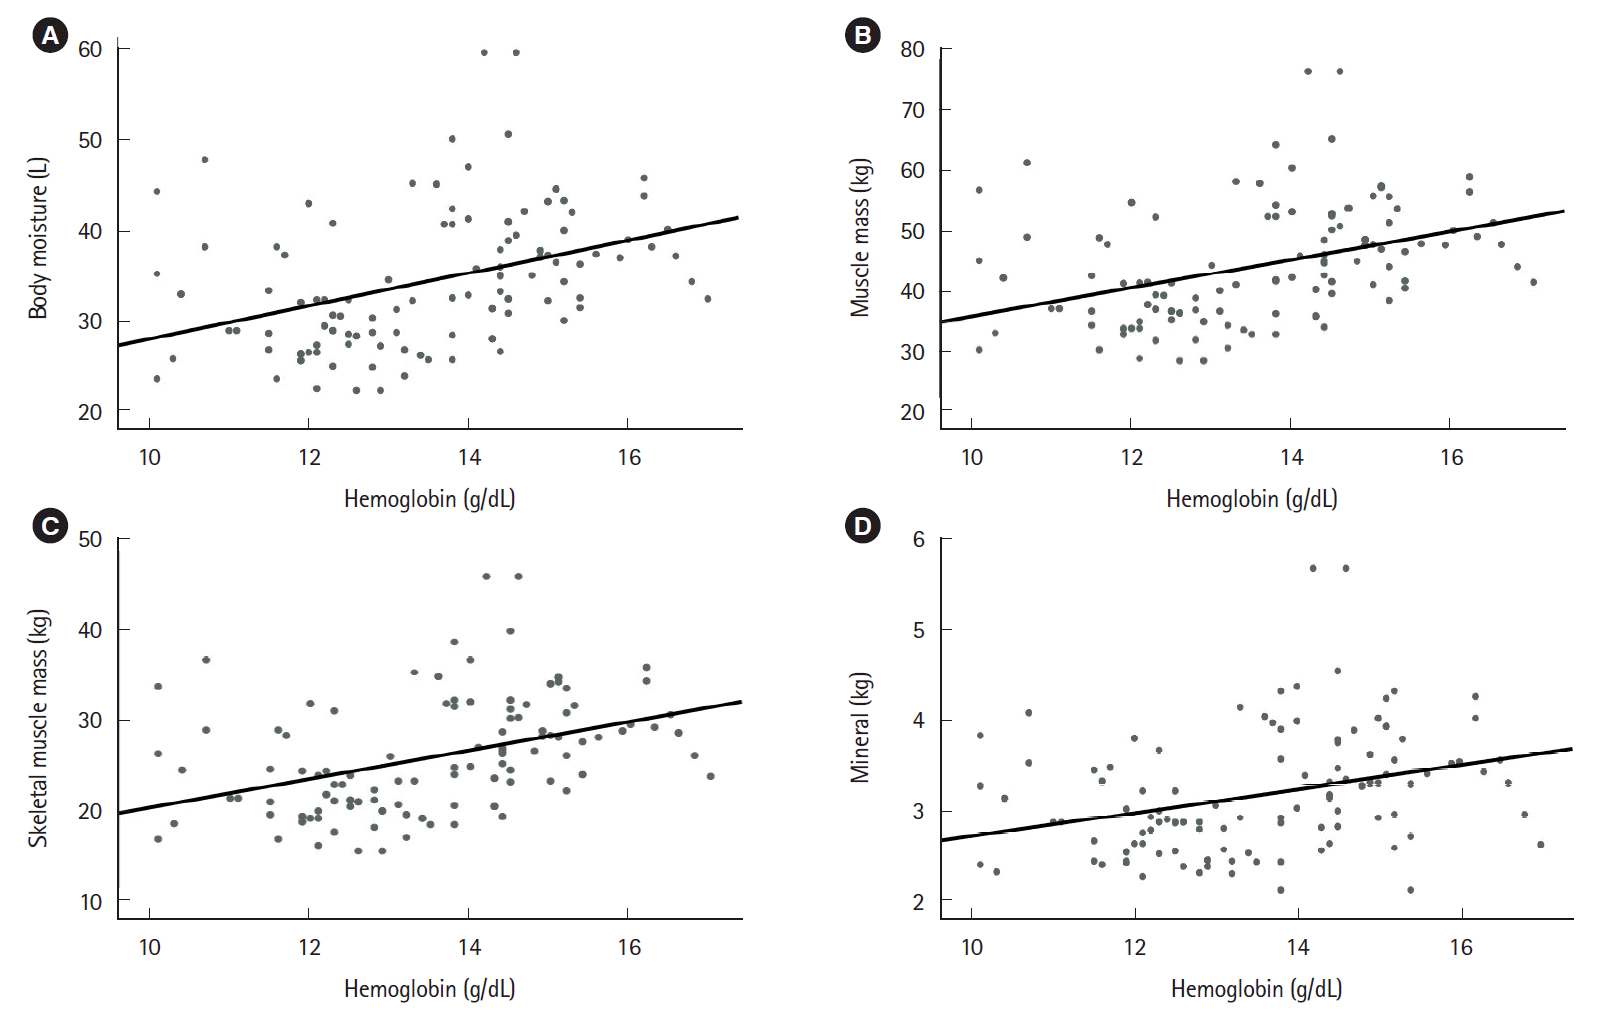
Fig. 1.
Flowchart of the selection process for research subjects among inflammatory bowel disease patients. CKD, chronic kidney disease; HF, heart failure; UC, ulcerative colitis; CD, Crohn’s disease.
ir-2021-00022f1.tif
Fig. 2.
The level of hemoglobin showed good correlation with the nutritional factors of bioelectrical impedance analysis. (A) Correlation between hemoglobin and body moisture (r=0.396; 95% CI, 0.258–0.527; P<0.001). (B) Correlation between hemoglobin and muscle mass (r=0.400; 95% CI, 0.262–0.530; P<0.001). (C) Correlation between hemoglobin and skeletal muscle mass (r=0.412; 95% CI, 0.277–0.539; P<0.001). (D) Correlation between hemoglobin and mineral (r=0.319; 95% CI, 0.187–0.348; P<0.001). r, Pearson correlation coefficient; CI, confidence interval. Statistically significant, P<0.05.
ir-2021-00022f2.tif
Fig. 3.
The level of total protein showed good correlation with the nutritional factors of bioelectrical impedance analysis. (A) Correlation between total protein and body moisture (r=0.265; 95% CI, 0.127–0.403; P=0.002). (B) Correlation between total protein and muscle mass (r=0.268; 95% CI, 0.130–0.404; P=0.002). (C) Correlation between total protein and skeletal muscle mass (r=0.274; 95% CI, 0.138–0.406; P=0.001). (D) Correlation between total protein and mineral (r=0.214; 95% CI, 0.081–0.348; P=0.013). r, Pearson correlation coefficient; CI, confidence interval. Statistically significant, P<0.05.
ir-2021-00022f3.tif
Fig. 4.
The level of albumin showed good correlation with the nutritional factors of bioelectrical impedance analysis. (A) Correlation between albumin and body moisture (r=0.226; 95% CI, 0.075–0.368; P=0.008). (B) Correlation between albumin and muscle mass (r=0.230; 95% CI, 0.077–0.370; P=0.007). (C) Correlation between albumin and skeletal muscle mass (r=0.242; 95% CI, 0.088–0.382; P=0.005). (D) Correlation between albumin and mineral (r=0.185; 95% CI, 0.048–0.321, P=0.031). r, Pearson correlation coefficient; CI, confidence interval. Statistically significant, P<0.05.
ir-2021-00022f4.tif
Table 1.
Baseline Characteristics of Patients with Inflammatory Bowel Disease
Characteristic Inactive (n = 67) Active (n = 72) P-valuea
Age (yr) 48.55 ± 17.35 41.90 ± 17.56 0.026
 Range 17–78 16–85
Sex
 Female 22 (15.8) 31 (22.3)
 Male 45 (32.3) 41 (29.5)
Disease
 UC 18 (12.9) 29 (20.9)
 CD 49 (35.3) 43 (30.9)
Hemoglobin (g/dL) 14.20 ± 1.48 13.07 ± 1.58 < 0.001
Total protein (g/dL) 7.60 ± 0.44 7.18 ± 0.69 < 0.001
Albumin (g/L) 4.46 ± 0.27 4.05 ± 0.44 < 0.001
Cholesterol (mg/dL) 183.73 ± 33.80 172.38 ± 40.89 0.095
Triglyceride (mg/dL) 153.65 ± 135.49 129.56 ± 46.70 0.244
ESR (mm/hr) 17.73 ± 13.80 31.13 ± 20.45 < 0.001
CRP (mg/dL) 0.26 ± 0.20b 1.63 ± 2.91c < 0.001

Values are presented as mean±standard deviation or number (%).

a Statistically significant, P<0.05.

b Median (interquartile range), 0.2 (0.1–0.3).

c Median (interquartile range), 0.4 (0.1–1.2).

UC, ulcerative colitis; CD, Crohn`s disease; ESR, erythrocyte sedimentation rate; CRP, C-reactive protein.

Table 2.
Bioelectrical Impedance Analysis Results of Patients with Inflammatory Bowel Disease
Item Inactive (n = 67) Active (n = 72) P-valuea
Body mass index (kg/m2) 23.63 ± 3.82 22.23 ± 3.53 0.027
Body moisture (L) 35.69 ± 7.72 33.18 ± 7.72 0.047
Muscle mass (kg) 45.85 ± 9.98 42.60 ± 8.93 0.046
Skeletal muscle mass (kg) 26.90 ± 6.41 24.77 ± 5.74 0.042
Mineral (kg) 3.30 ± 0.69 3.07 ± 0.60 0.034
Body fat (kg) 17.26 ± 8.28 15.69 ± 6.34 0.212

Values are presented as mean±standard deviation.

a Statistically significant, P<0.05.

TOOLS
Similar articles