Journal List > J Korean Med Sci > v.38(7) > 1516081329

Lee, Jung, Lee, Kim, Lee, and Shin: Relationship Between the Serum FGF21 Level and Growth in Children of Short Stature

Abstract

Background

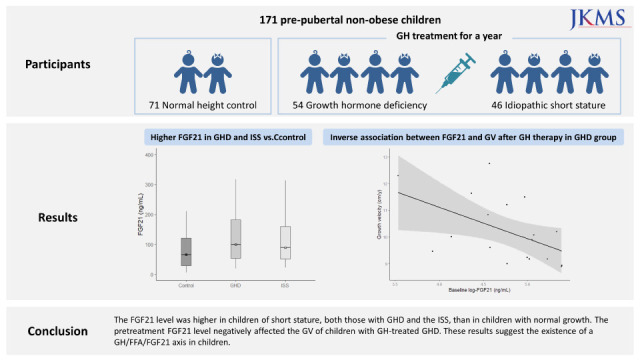
This study investigated the relationship between fibroblast growth factor 21 (FGF21) levels and growth in children with growth hormone deficiency (GHD) and idiopathic short stature (ISS), and the effects of the FGF21 level on response to growth hormone (GH) treatment.

Methods

We included 171 pre-pubertal children with a GHD (n = 54), ISS (n = 46), and normal height (n = 71). Fasting FGF21 levels were measured at baseline and every 6 months during GH treatment. Factors associated with growth velocity (GV) after GH therapy were investigated.

Results

The FGF21 level was higher in short children than in the controls without significant difference between the GHD and ISS groups. In the GHD group, the FGF21 level was inversely associated with the free fatty acid (FFA) level at baseline (r = −0.28, P = 0.039), however, was positively correlated with the FFA level at 12 months (r = 0.62, P = 0.016). The GV over 12 months of GH therapy was positively associated with the delta insulin-like growth factor 1 level (β = 0.003, P = 0.020). The baseline log-transformed FGF21 level was inversely associated with GV with marginal significance (β = −0.64, P = 0.070).

Conclusion

The FGF21 level was higher in children of short stature, both those with GHD and the ISS, than in children with normal growth. The pretreatment FGF21 level negatively affected the GV of children with GH-treated GHD. These results suggest the existence of a GH/FFA/FGF21 axis in children.

Graphical Abstract

jkms-38-e63-abf001.jpg

INTRODUCTION

Short stature is defined as a height below the third percentile or more than 2 standard deviation scores (SDSs) below the mean in a sex-and age-matched cohort. In pediatric endocrine practice, based on the results of growth hormone (GH) stimulation tests, short children without anomalies or dysmorphism are divided into those with GH deficiency and those with normal GH levels. Most children in the latter group are considered to have idiopathic short stature (ISS).1
Fibroblast growth factor 21 (FGF21) is a metabolism-regulating hormone produced mainly by the liver. It has beneficial effects on glucose and lipid metabolism and has been shown to increase insulin sensitivity, promote weight loss in obese experimental animals and humans, and improve abnormal circulating and hepatic lipid levels.2 Prolonged fasting induces hepatic production of FGF21, which in turn stimulates gluconeogenesis, fatty acid oxidation, and ketogenesis.23 Low-protein, high-carbohydrate diets and a high lipid intake also increase circulating FGF21 levels.45 However, a higher circulating FGF21 level is associated with pathologic conditions, such as obesity,67 metabolic syndrome,89 diabetes,1011 insulin resistance,612 non-alcoholic fatty liver disease,1314 and dyslipidemia.1516 The paradoxical increase in FGF21 during metabolic stress is explained by FGF21 resistance.
FGF21 also has an inhibitory effect on skeletal growth. Transgenic mice overexpressing FGF21 are smaller than wild-type mice.17 FGF21 reduces the insulin-like growth factor 1 (IGF1) level without decreasing the GH level. Among the effects of FGF21 overexpression is a reduction in the concentration of signal transducer and activator of transcription 5 (STAT5), a transcription factor that regulates IGF1 in response to GH, and reduces expression of the suppressor of cytokine signaling 2 (SOCS2), which downregulates GH signaling.17 Conversely, in FGF21 knockout mice with food restriction, the body and tibial lengths were increased compared with wild type mice, and FGF21 injection eliminated both of these increases.18 Several human studies have shown the inhibitory effects of FGF21 on growth. The FGF21 level was inversely correlated with the linear growth rate during infancy,1920 or positively associated with GH resistance in girls with anorexia nervosa.21 However, only few studies have examined the effects of FGF21 on the GH axis in children.
Thus, in this study, we investigated whether GH deficiency (GHD) and ISS are related to the growth-inhibiting effects of FGF21, and whether FGF21 is related to the response to GH treatment.

METHODS

Study participants

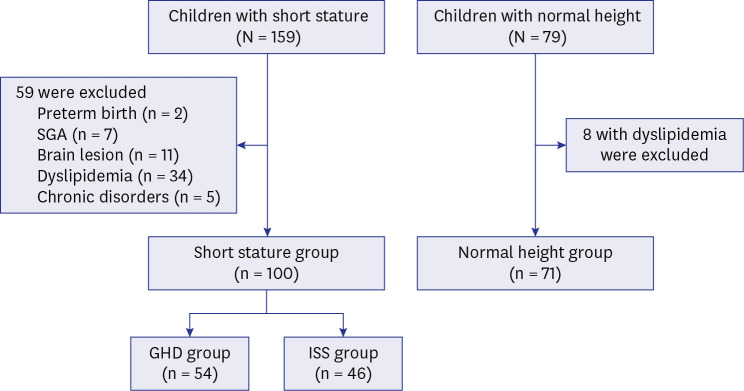
This study enrolled 238 pre-pubertal non-obese children who visited pediatric endocrinology clinics between April, 2018, and July, 2021, in three hospitals affiliated with Seoul National University (SNU) for growth evaluations. The children were categorized as short children (height < 3rd percentile, n = 159) and normal controls (3rd percentile ≤ height < 97th percentile, n = 79) according to their height. After excluding 59 short children with organic brain lesions (n = 11), small for gestational age (SGA, n = 7), preterm birth (n = 2), dyslipidemia (n = 34), or other chronic diseases (n = 5), and 8 normal height children with dyslipidemia, 100 children of short stature and 71 of normal height were included (Fig. 1).
Fig. 1

Flowchart of the participants.

SGA = small for gestational age, GHD = growth hormone deficiency, ISS = idiopathic short stature.
jkms-38-e63-g001

Evaluation of short children and GH treatment

GH stimulation tests were performed in children of short stature whose BA was delayed by > 1 year. GH stimulants included insulin, L-dopa, clonidine, and arginine. GHD was defined as a peak GH level < 10 ng/mL, as determined by two different GH stimulation tests, and 54 were diagnosed with GHD and 46 with ISS (Fig. 1). All children with GHD began GH therapy after sellar magnetic resonance imaging to evaluate organic brain lesions. GH treatment was initiated in 19 children with ISS according to their needs with consent of their guardians. The effects of GH therapy were investigated in 24 GHD and 9 ISS children who received GH treatment for 6 months and 18 GHD and 6 ISS children who received it for 1 year.

Clinical and biochemical measurements

Height was measured to the nearest 0.1 cm using a Harpenden stadiometer (Holtain, Pembs, UK), and weight was measured to the nearest 0.1 kg using an electronic scale (CAS, Seoul, Korea). Body mass index (BMI) was calculated as weight (kg) divided by height squared (m2). SDSs for height, weight, and BMI were calculated using the 2017 Korean National Growth Chart.22 Bone age (BA) was evaluated using the Greulich–Pyle method.
Blood serum samples were obtained after 12 hours of fasting to measure FGF21, IGF1, insulin, glucose, lipid profiles, and free fatty acid (FFA) levels at baseline and every 6 months during GH treatment. FGF21 levels in blood samples were measured using a commercially available ELISA kit (R&D Systems, Minneapolis, MN, USA). IGF1, GH, and insulin concentrations were determined by immunoradiometric assay kits (IGF1: Immunotech, Prague, Czech Republic; GH: Institute of Isotopes, Budapest, Hungary; insulin: DIAsource ImmunoAssays, Louvain-la-Neuve, Belgium). FFA levels were measured using an enzymatic method (WAKO Chemicals, Neuss, Germany) and the Beckman Coulter AU 680. Total cholesterol, high-density lipoprotein cholesterol (HDL-C), triglyceride (TG), and glucose levels were analyzed by standard enzymatic methods using the Roche COBAS 8000 c702. The low-density lipoprotein cholesterol (LDL-C) level was determined according to the Friedewald equation: LDL-C = Total cholesterol − HDL-C − TG/5. Dyslipidemia was defined as total cholesterol ≥ 200 mg/dL, TG ≥ 150 mg/dL, or LDL-C ≥ 130 mg/dL. The insulin resistance index was calculated according to the homeostatic model assessment for insulin resistance (HOMA-IR) = Glucose (mg/dL) × Insulin (IU/L)/405.

Statistical analysis

Statistical analyses were performed using SPSS software (ver. 26.0; IBM Corp., Armonk, NY, USA). The variables are presented as the median (interquartile range). A nonparametric analysis using the Wilcoxon rank sum test was used to compare the results of two groups. A Bonferroni-corrected P value of 0.017 was applied for multiple comparisons. Spearman correlation analysis was used to evaluate the associations with clinical variables. Linear regression analysis was performed to identify predictors of growth velocity (GV) after GH treatment. A multivariate model was constructed using the variables with P < 0.05 in the univariate analyses. A P value < 0.05 was considered to indicate statistical significance.

Ethics statement

This study adhered to the Declaration of Helsinki and was approved by the Institutional Review Boards of Seoul Metropolitan Government-Seoul National University Boramae Medical Center (approval No. 20-2018-4), Seoul National University Children’s Hospital (approval No. 1805-012-942), and Seoul National University Bundang Hospital (approval No. B-1805-471-403). Written informed consent was obtained from the study participants and their guardians.

RESULTS

Clinical characteristics of the participants among the three groups

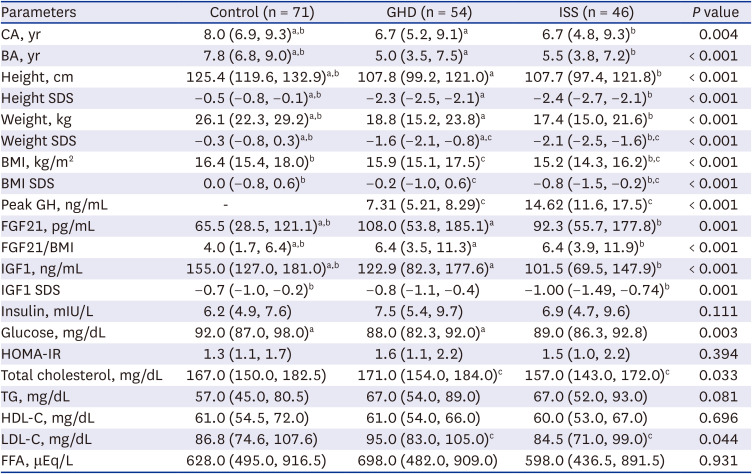
Table 1 compares the clinical characteristics of the three groups. The anthropometrics, FGF21, IGF1, serum glucose, total cholesterol, and LDL-C levels differed significantly among the groups. Since the control group was older than the short group (median age, 8.0 vs. 6.7 years), we performed a sensitivity analysis and compared the clinical characteristics after excluding those younger than 5 years of age (11 with GHD and 14 with ISS), which gave similar results (Supplementary Table 1).
Table 1

Comparison of clinical characteristics among the groups

jkms-38-e63-i001
Parameters Control (n = 71) GHD (n = 54) ISS (n = 46) P value
CA, yr 8.0 (6.9, 9.3)a,b 6.7 (5.2, 9.1)a 6.7 (4.8, 9.3)b 0.004
BA, yr 7.8 (6.8, 9.0)a,b 5.0 (3.5, 7.5)a 5.5 (3.8, 7.2)b < 0.001
Height, cm 125.4 (119.6, 132.9)a,b 107.8 (99.2, 121.0)a 107.7 (97.4, 121.8)b < 0.001
Height SDS −0.5 (−0.8, −0.1)a,b −2.3 (−2.5, −2.1)a −2.4 (−2.7, −2.1)b < 0.001
Weight, kg 26.1 (22.3, 29.2)a,b 18.8 (15.2, 23.8)a 17.4 (15.0, 21.6)b < 0.001
Weight SDS −0.3 (−0.8, 0.3)a,b −1.6 (−2.1, −0.8)a,c −2.1 (−2.5, −1.6)b,c < 0.001
BMI, kg/m2 16.4 (15.4, 18.0)b 15.9 (15.1, 17.5)c 15.2 (14.3, 16.2)b,c < 0.001
BMI SDS 0.0 (−0.8, 0.6)b −0.2 (−1.0, 0.6)c −0.8 (−1.5, −0.2)b,c < 0.001
Peak GH, ng/mL - 7.31 (5.21, 8.29)c 14.62 (11.6, 17.5)c < 0.001
FGF21, pg/mL 65.5 (28.5, 121.1)a,b 108.0 (53.8, 185.1)a 92.3 (55.7, 177.8)b 0.001
FGF21/BMI 4.0 (1.7, 6.4)a,b 6.4 (3.5, 11.3)a 6.4 (3.9, 11.9)b < 0.001
IGF1, ng/mL 155.0 (127.0, 181.0)a,b 122.9 (82.3, 177.6)a 101.5 (69.5, 147.9)b < 0.001
IGF1 SDS −0.7 (−1.0, −0.2)b −0.8 (−1.1, −0.4) −1.00 (−1.49, −0.74)b 0.001
Insulin, mIU/L 6.2 (4.9, 7.6) 7.5 (5.4, 9.7) 6.9 (4.7, 9.6) 0.111
Glucose, mg/dL 92.0 (87.0, 98.0)a 88.0 (82.3, 92.0)a 89.0 (86.3, 92.8) 0.003
HOMA-IR 1.3 (1.1, 1.7) 1.6 (1.1, 2.2) 1.5 (1.0, 2.2) 0.394
Total cholesterol, mg/dL 167.0 (150.0, 182.5) 171.0 (154.0, 184.0)c 157.0 (143.0, 172.0)c 0.033
TG, mg/dL 57.0 (45.0, 80.5) 67.0 (54.0, 89.0) 67.0 (52.0, 93.0) 0.081
HDL-C, mg/dL 61.0 (54.5, 72.0) 61.0 (54.0, 66.0) 60.0 (53.0, 67.0) 0.696
LDL-C, mg/dL 86.8 (74.6, 107.6) 95.0 (83.0, 105.0)c 84.5 (71.0, 99.0)c 0.044
FFA, μEq/L 628.0 (495.0, 916.5) 698.0 (482.0, 909.0) 598.0 (436.5, 891.5) 0.931
Data are expressed as median and interquartile range. Bonferroni correction was applied for multiple comparison with the significance level of P < 0.017.
GHD = growth hormone deficiency, ISS = idiopathic short stature, CA = chronologic age, BA = bone age, SDS = standard deviation score, BMI = body mass index, FGF21 = fibroblast growth factor 21, IGF1 = insulin-like growth factor 1, HOMA-IR = homeostatic model assessment-insulin resistance, TG = triglyceride, HDL-C = high-density lipoprotein cholesterol, LDL-C = low-density lipoprotein cholesterol, FFA = free fatty acid.
aP < 0.017 between the GHD and control group; bP < 0.017 between the ISS and control group; cP < 0.017 between the GHD and ISS group.
Compared to the controls, both the GHD and ISS groups had younger BA, lower height SDS (−0.5 vs. −2.3 vs. −2.4, respectively) and weight SDS (−0.3 vs. −1.6 vs. −2.1, respectively). The ISS group had a lower BMI SDS than the controls (0.0 vs. −0.2, P < 0.001). The GHD and ISS groups had significantly higher FGF21 levels than the controls (108 and 92.3 vs. 65.5 pg/mL, respectively; both P < 0.017). The IGF1 levels were lower in the GHD and ISS groups than in the controls (122.9 and 101.5 vs. 155.0 ng/mL, respectively; both P < 0.017). Similar results were found on comparing the BMI-adjusted FGF21 (FGF21/BMI) levels. There were no significant differences in HOMA-IR, lipid profiles, or FFA levels between the control and short (GHD and ISS) groups.
Comparing the GHD and ISS groups, the GHD group had higher weight (−1.6 vs. −2.1, P = 0.002) and BMI (−0.2 vs. −0.8, P = 0.007) SDSs, with no differences in BA or height SDS. There were no differences in FGF21 level, FGF21/BMI, IGF1 level, or IGF1 SDS between the GHD and ISS groups. The GHD group had higher total cholesterol (177 vs. 157 mg/dL, P = 0.009) and LDL-C (95.0 vs. 84.5 mg/dL, P = 0.010) levels than the ISS group. The HOMA-IR, TG, and FFA levels did not differ between the two short groups.

Correlations between the FGF21 level and the clinical parameters

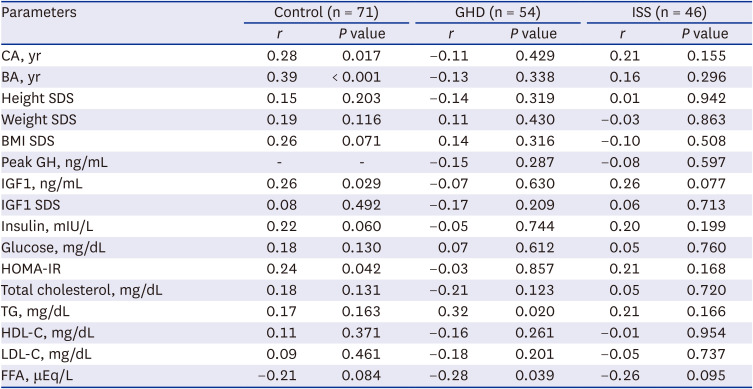
In the children with normal growth, the FGF21 level was positively correlated with chronologic age (CA), BA, the IGF1 level (but not with the IGF1 SDS), and HOMA-IR. In addition, the FGF21 level was positively correlated with the BMI SDS (r = 0.22, P = 0.071) and negatively correlated with the FFA level (r = −0.21, P = 0.084), both with marginal significance (Table 2). A partial correlation analysis showed that the FGF21 level was correlated with the BMI SDS in children matched for CA (P = 0.039, data not shown). In children with GHD and ISS, the FGF21 level was not related with CA, BA, BMI SDS, IGF1 SDS and HOMA-IR. In the children with GHD, the FGF21 level was positively and negatively correlated with the TG and FFA levels, respectively. In the children with ISS, the FGF21 level showed a weak negative correlation with the FFA level with marginal significance (r = −0.26, P = 0.095) (Table 2).
Table 2

Correlations between clinical parameters and the FGF21 levels

jkms-38-e63-i002
Parameters Control (n = 71) GHD (n = 54) ISS (n = 46)
r P value r P value r P value
CA, yr 0.28 0.017 −0.11 0.429 0.21 0.155
BA, yr 0.39 < 0.001 −0.13 0.338 0.16 0.296
Height SDS 0.15 0.203 −0.14 0.319 0.01 0.942
Weight SDS 0.19 0.116 0.11 0.430 −0.03 0.863
BMI SDS 0.26 0.071 0.14 0.316 −0.10 0.508
Peak GH, ng/mL - - −0.15 0.287 −0.08 0.597
IGF1, ng/mL 0.26 0.029 −0.07 0.630 0.26 0.077
IGF1 SDS 0.08 0.492 −0.17 0.209 0.06 0.713
Insulin, mIU/L 0.22 0.060 −0.05 0.744 0.20 0.199
Glucose, mg/dL 0.18 0.130 0.07 0.612 0.05 0.760
HOMA-IR 0.24 0.042 −0.03 0.857 0.21 0.168
Total cholesterol, mg/dL 0.18 0.131 −0.21 0.123 0.05 0.720
TG, mg/dL 0.17 0.163 0.32 0.020 0.21 0.166
HDL-C, mg/dL 0.11 0.371 −0.16 0.261 −0.01 0.954
LDL-C, mg/dL 0.09 0.461 −0.18 0.201 −0.05 0.737
FFA, μEq/L −0.21 0.084 −0.28 0.039 −0.26 0.095
FGF21 = fibroblast growth factor 21, GHD = growth hormone deficiency, ISS = idiopathic short stature, CA = chronologic age, BA = bone age, SDS = standard deviation score, BMI = body mass index, GH = growth hormone, IGF1 = insulin-like growth factor 1, HOMA-IR = homeostatic model assessment-insulin resistance, TG = triglyceride, HDL-C = high-density lipoprotein cholesterol, LDL-C = low-density lipoprotein cholesterol, FFA = free fatty acid.

Factors associated with GV in the GHD group after GH treatment

The effects of GH treatment were evaluated in 24 and 18 children with GHD treated for 6 and 12 months. respectively. Height, weight, IGF1, TG and FFA levels, and the HOMA-IR increased, while LDL-C level decreased, after GH therapy. The FGF21 level increased as well but not significantly (Table 3).
Table 3

Changes in clinical characteristics and FGF21 levels before and after GH treatment in children with GHD

jkms-38-e63-i003
Parameters GH treatment for 6 months (n = 24) GH treatment for 12 months (n = 18)
Before After P value Before After P value
Height SDS −2.1 (−2.4, −2.0) −1.7 (−1.9, −1.4) < 0.001 −2.1 (−2.4, −2.0) −1.3 (−1.5, −1.2) < 0.001
Weight SDS −1.3 (−1.8, −0.7) −1.0 (−1.6, −0.4) < 0.001 −0.9 (−1.6, −0.5) −0.3 (−1.0, 0.0) < 0.001
BMI SDS −0.1 (−0.7, 0.7) −0.1 (−0.6, 0.6) 0.954 0.2 (−0.6, 0.9) 0.2 (−0.5, 1.1) 0.215
FGF21, pg/mL 134.1 (101.4, 188.6) 178.3 (83.7, 256.4) 0.424 149.7 (105.9, 187.7) 164.8 (82.5, 237.0) 0.446
IGF1, ng/mL 174.6 (104.6, 226.0) 316.0 (232.0, 399.0) < 0.001 190.0 (107.0, 253.8) 429.0 (301.0, 520.3) < 0.001
IGF1 SDS −0.6 (−1.1, −0.2) 1.1 (0.1, 2.6) < 0.001 −0.5 (−0.9, 0.1) 1.6 (0.9, 2.6) < 0.001
HOMA-IR 1.9 (1.4, 2.6) 2.5 (2.1, 4.1) 0.041 1.6 (1.4, 1.9) 3.5 (2.6, 5.5) 0.001
Cholesterol, mg/dL 162.0 (153.0, 175.0) 163.0 (146.0, 171.0) 0.201 165.0 (152.8, 178.5) 164.0 (145.0, 169.3) 0.301
TG, mg/dL 67.5 (58.8, 102.5) 80.5 (65.0, 94.5) 0.552 67.0 (56.3, 86.0) 97.5 (72.3, 127.3) 0.019
HDL-C, mg/dL 60.0 (51.8, 63.5) 59.0 (54.0, 66.3) 0.289 61.0 (55.5, 65.8) 59 (55.3, 61.8) 0.223
LDL-C, mg/dL 91.0 (82.3, 101.3) 85.8 (67.0, 91.0) 0.049 91.0 (84.0, 99.5) 81.2 (63.9, 87.7) 0.048
FFA, μEq/L 512.0 (377.0, 844.3) 783.0 (644.8, 1,008.8) 0.018 465.0 (374.5, 717.5) 674.0 (594.0, 1,049.5) 0.041
Data are expressed as medians and interquartile range.
FGF21 = fibroblast growth factor 21, GH = growth hormone, GHD = growth hormone deficiency, SDS = standard deviation score, BMI = body mass index, IGF1 = insulin-like growth factor 1, HOMA-IR homeostatic model assessment-insulin resistance, TG = triglyceride, HDL-C = high-density lipoprotein cholesterol, LDL-C = low-density lipoprotein cholesterol, FFA = free fatty acid.
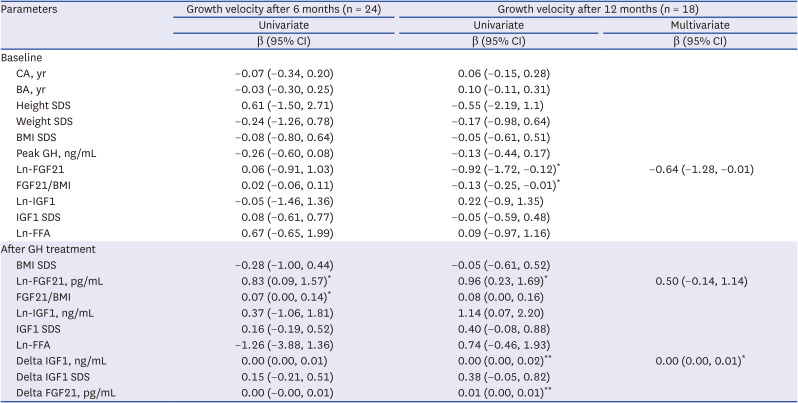
We evaluated the factors associated with GV during GH therapy (Table 4). After 6 months of GH treatment, GV was associated with the 6-month natural log-transformed FGF21 (ln-FGF21) level (β = 0.83, P = 0.039), but not with the basal ln-FGF21 level. GV during 12 months of GH therapy was negatively related to the basal ln-FGF21 level (β = −0.92, P = 0.039). It was positively correlated with the ln-FGF21 level at 12 months (β = 0.96, P = 0.020) and delta IGF1 (β = 0.005, P = 0.007) and delta FGF21 (β = 0.004, P = 0.008) for 12 months. In the multivariate regression model, delta IGF1 (β = 0.003, P = 0.020) independently affected the GV during 12 months of GH treatment. The baseline ln-FGF21 level was inversely associated with GV for 12 months after adjustment with marginal significance (β = −0.64, P = 0.070).
Table 4

Factors associated with growth velocity after GH treatment in children with GHD

jkms-38-e63-i004
Parameters Growth velocity after 6 months (n = 24) Growth velocity after 12 months (n = 18)
Univariate Univariate Multivariate
β (95% CI) β (95% CI) β (95% CI)
Baseline
CA, yr −0.07 (−0.34, 0.20) 0.06 (−0.15, 0.28)
BA, yr −0.03 (−0.30, 0.25) 0.10 (−0.11, 0.31)
Height SDS 0.61 (−1.50, 2.71) −0.55 (−2.19, 1.1)
Weight SDS −0.24 (−1.26, 0.78) −0.17 (−0.98, 0.64)
BMI SDS −0.08 (−0.80, 0.64) −0.05 (−0.61, 0.51)
Peak GH, ng/mL −0.26 (−0.60, 0.08) −0.13 (−0.44, 0.17)
Ln-FGF21 0.06 (−0.91, 1.03) −0.92 (−1.72, −0.12)* −0.64 (−1.28, −0.01)
FGF21/BMI 0.02 (−0.06, 0.11) −0.13 (−0.25, −0.01)*
Ln-IGF1 −0.05 (−1.46, 1.36) 0.22 (−0.9, 1.35)
IGF1 SDS 0.08 (−0.61, 0.77) −0.05 (−0.59, 0.48)
Ln-FFA 0.67 (−0.65, 1.99) 0.09 (−0.97, 1.16)
After GH treatment
BMI SDS −0.28 (−1.00, 0.44) −0.05 (−0.61, 0.52)
Ln-FGF21, pg/mL 0.83 (0.09, 1.57)* 0.96 (0.23, 1.69)* 0.50 (−0.14, 1.14)
FGF21/BMI 0.07 (0.00, 0.14)* 0.08 (0.00, 0.16)
Ln-IGF1, ng/mL 0.37 (−1.06, 1.81) 1.14 (0.07, 2.20)
IGF1 SDS 0.16 (−0.19, 0.52) 0.40 (−0.08, 0.88)
Ln-FFA −1.26 (−3.88, 1.36) 0.74 (−0.46, 1.93)
Delta IGF1, ng/mL 0.00 (0.00, 0.01) 0.00 (0.00, 0.02)** 0.00 (0.00, 0.01)*
Delta IGF1 SDS 0.15 (−0.21, 0.51) 0.38 (−0.05, 0.82)
Delta FGF21, pg/mL 0.00 (−0.00, 0.01) 0.01 (0.00, 0.01)**
A multivariate model was constructed using variables with P < 0.05 in the univariate analyses. Delta FGF21 was excluded from the model due to multicollinearity.
GH = growth hormone, GHD = growth hormone deficiency, CI = confidence interval, CA = chronologic age, BA = bone age, SDS = standard deviation score, BMI = body mass index, FGF21 = fibroblast growth factor 21, Ln- = natural log-transformed, IGF1 = insulin-like growth factor 1, FFA = free fatty acid.
*P < 0.05, **P < 0.01.

Factors associated with growth velocity in ISS group after GH treatment

The effects of GH treatment were also evaluated in 9 and 6 children with ISS treated for 6 and 12 months, respectively. In ISS children, height, weight, and IGF1 levels increased after GH therapy. As in GHD children, FFA level, TG level and the HOMA-IR increased, while LDL-C level decreased, after GH therapy, but there were no significant results. The FGF21 level increased with marginal significance after 12 months of GH treatment in ISS children (P = 0.075) (Table 5).
Table 5

Changes in clinical characteristics and FGF21 levels before and after GH treatment in children with ISS

jkms-38-e63-i005
Parameters GH treatment for 6 months (n = 9) GH treatment for 12 months (n = 6)
Before After P value Before After P value
Height SDS −2.4 (−2.9, −2.0) −1.9 (−2.3, −1.4) 0.008 −2.4 (−2.8, −2.2) −1.7 (−2.1, −1.1) 0.028
Weight SDS −2.0 (−2.5, −1.3) −1.5 (−2.3, −1.3) 0.139 −2.0 (−2.1, −1.5) −1.2 (−1.4, −1.1) 0.028
BMI SDS −0.9 (−1.3, −0.2) −1.1 (−1.5, −0.7) 0.441 −0.6 (−1.1, −0.3) −0.5 (−0.9, −0.5) 0.753
FGF21, pg/mL 133.3 (115.3, 188.2) 176.5 (152.2, 279.5) 0.110 115.7 (90.7, 150.2) 241.2 (145.0, 270.5) 0.075
IGF1, ng/mL 109 (94.7, 177.5) 304 (213.0, 340.0) 0.008 118.5 (91.8, 165.1) 310.0 (169.8, 545.5) 0.028
IGF1 SDS −0.98 (−1.59, −0.60) 0.89 (−0.14, 1.39) 0.011 −0.87 (−1.51, −0.65) 0.80 (−0.50, 2.28) 0.046
HOMA-IR 2.42 (2.01, 2.66) 2.26 (1.46, 3.38) 0.465 1.31 (1.30, 1.78) 4.36 (3.61, 4.78) 0.109
Cholesterol, mg/dL 181 (151, 182) 166 (155, 174) 0.500 155 (153.0, 168.5) 164 (157.0, 165.5) 0.593
TG, mg/dL 69 (54, 93) 104 (75, 162) 0.225 54 (48.5, 61.5) 158 (133.5, 161.5) 0.109
HDL-C, mg/dL 64 (57, 74) 65 (56, 67) 0.686 66 (65.0, 70.0) 64 (63.0, 64.5) 0.285
LDL-C, mg/dL 104 (68.0, 104.0) 67 (66.6, 96.6) 0.500 78.2 (73.1, 91.1) 70.4 (62.7, 74.3) 0.180
FFA, μEq/L 505.5 (431.8, 686.8) 881.0 (786.5, 1,054.3) 0.144 574 (477.0, 817.5) 802 (700.0, 846.5) 0.285
Data are expressed as median and interquartile range.
FGF21 = fibroblast growth factor 21, GH = growth hormone, ISS = idiopathic short stature, SDS = standard deviation score, BMI = body mass index, IGF1 = insulin-like growth factor 1, HOMA-IR = homeostatic model assessment-insulin resistance, TG = triglyceride, HDL-C = high-density lipoprotein cholesterol, LDL-C = low-density lipoprotein cholesterol, FFA = free fatty acid.
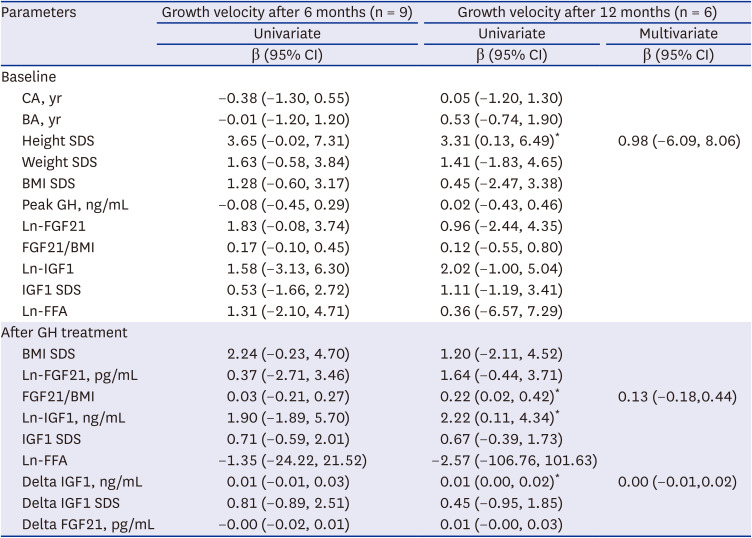
After 6 months of GH treatment in 9 ISS children, GV was not associated with the 6-month ln-FGF21 level, or the basal ln-FGF21 level. GV during 12 months of GH therapy in ISS children was not related to the basal ln-FGF21 level and ln-FGF21 level at 12 months, but positively correlated with basal height SDS (β = 3.31, P = 0.045), FGF21/BMI level (β = 0.22, P = 0.038), ln IGF1 (β = 2.22, P = 0.043), and delta IGF1 at 12 months (β = 0.009, P = 0.039) in univariate analysis. Delta FGF21 for 12 months showed a positive correlation with GV during 12 months of GH therapy with marginal significance (β = 0.013, P = 0.084) (Table 6).
Table 6

Factors associated with growth velocity after GH treatment in children with ISS

jkms-38-e63-i006
Parameters Growth velocity after 6 months (n = 9) Growth velocity after 12 months (n = 6)
Univariate Univariate Multivariate
β (95% CI) β (95% CI) β (95% CI)
Baseline
CA, yr −0.38 (−1.30, 0.55) 0.05 (−1.20, 1.30)
BA, yr −0.01 (−1.20, 1.20) 0.53 (−0.74, 1.90)
Height SDS 3.65 (−0.02, 7.31) 3.31 (0.13, 6.49)* 0.98 (−6.09, 8.06)
Weight SDS 1.63 (−0.58, 3.84) 1.41 (−1.83, 4.65)
BMI SDS 1.28 (−0.60, 3.17) 0.45 (−2.47, 3.38)
Peak GH, ng/mL −0.08 (−0.45, 0.29) 0.02 (−0.43, 0.46)
Ln-FGF21 1.83 (−0.08, 3.74) 0.96 (−2.44, 4.35)
FGF21/BMI 0.17 (−0.10, 0.45) 0.12 (−0.55, 0.80)
Ln-IGF1 1.58 (−3.13, 6.30) 2.02 (−1.00, 5.04)
IGF1 SDS 0.53 (−1.66, 2.72) 1.11 (−1.19, 3.41)
Ln-FFA 1.31 (−2.10, 4.71) 0.36 (−6.57, 7.29)
After GH treatment
BMI SDS 2.24 (−0.23, 4.70) 1.20 (−2.11, 4.52)
Ln-FGF21, pg/mL 0.37 (−2.71, 3.46) 1.64 (−0.44, 3.71)
FGF21/BMI 0.03 (−0.21, 0.27) 0.22 (0.02, 0.42)* 0.13 (−0.18,0.44)
Ln-IGF1, ng/mL 1.90 (−1.89, 5.70) 2.22 (0.11, 4.34)*
IGF1 SDS 0.71 (−0.59, 2.01) 0.67 (−0.39, 1.73)
Ln-FFA −1.35 (−24.22, 21.52) −2.57 (−106.76, 101.63)
Delta IGF1, ng/mL 0.01 (−0.01, 0.03) 0.01 (0.00, 0.02)* 0.00 (−0.01,0.02)
Delta IGF1 SDS 0.81 (−0.89, 2.51) 0.45 (−0.95, 1.85)
Delta FGF21, pg/mL −0.00 (−0.02, 0.01) 0.01 (−0.00, 0.03)
Multivariate model was constructed using variables with P < 0.05 in the univariate analysis. Delta FGF21 was excluded for the model due to multicollinearity.
GH = growth hormone, ISS = idiopathic short stature, CA = chronologic age, BA = bone age, SDS = standard deviation score, BMI = body mass index, FGF21 = fibroblast growth factor 21, Ln- = natural log-transformed, IGF1 = insulin-like growth factor 1, FFA = free fatty acid.
*P < 0.05, **P < 0.01.

Correlation between the FGF21 levels after GH treatment with the clinical variables

In GHD children treated with GH for 6 months, the FGF21 level was negatively associated with the peak GH level, as measured by the GH stimulation test, and positively associated with GV and height SDS. In GHD children treated with GH for 12 months, the FGF21 level was negatively associated with the pretreatment FGF21 level and positively associated with both GV and the FFA level (Supplementary Table 2).
In 9 ISS children treated with GH for 6 months, the FGF21 level was not associated with the peak GH level, GV and height SDS. In 6 ISS children treated with GH for 12 months, the FGF21 level was not associated with the pretreatment FGF21 level and FFA at 12 months, but positively associated with both GV and IGF1 level (Supplementary Table 3).

DISCUSSION

In this study, the FGF21 level was higher in short children than in the control group without significant differences between the GHD and ISS group. In both GHD and ISS group, the FGF21 level tended to increase during GH therapy. The delta IGF1 level was independently associated with GV after 12 months of GH treatment.
The metabolic adaptation to starvation includes the use of fatty acids instead of glucose in energy metabolism and inhibition of skeletal growth reflecting the limited sources of energy.23 Increased FGF21 during fasting is known to be involved in these processes. In an animal study, FGF21 reduces the expression of GH receptors in the liver and on growth plates and thus suppresses the actions of GH.18 In children with ISS, the increased FGF21 level may contribute to inhibiting GH action on skeletal growth, whereas in those with GHD, short stature may be due to the GHD rather than to growth inhibition by FGF21. Without sufficient GH, the ability of FGF21 to inhibit GH action is likely insignificant. As FGF21 directly inhibits osteogenesis and bone growth in chondrocytes,24 the BA delay in children with GHD and in children with ISS may have been related to high FGF21 levels.
We excluded children with obesity, hyperlipidemia, and diabetes from this study because FGF21 can be elevated in these conditions due to FGF21 resistance.2526 Although the ISS group had a lower BMI SDS than the controls, the insulin resistance and lipid profiles did not differ significantly between the control and short groups. This implies that the increased FGF21 in short children in this study was not related to obesity or insulin resistance.2728
In this study, FGF21 was correlated positively with TG and negatively with FFA in the GHD group; similar trends were observed in the ISS and control groups, although they were not significant. Circulating FFAs produced by GH induced lipolysis promote the production of FGF21 through activation of peroxisome proliferator-activated receptor α (PPARα) in the liver.2930 Conversely, an elevated FGF21 level inhibits the action of GH, including lipolysis (FFA generation), whereas it promotes fatty acid oxidation, thereby reducing FFA levels. Pediatric studies have reported a positive relationship between FGF21 and TG levels in normal,630 obese,68 or ISS children31 as in this study. The stronger relationship between FGF21 and the FFA or TG levels in the GHD group compared to the others could be attributed to decreased GH production and the suppression of its action in GHD patients.
We found a positive correlation between FGF21 level and age only in the controls. Hanks et al.32 reported that FGF21 levels increased with age, based on an evaluation of five age groups in a population aged 5–80 years. However, in other studies, the FGF21 level was not related to age, either in adults30 or in children and adolescents.33 Whether the FGF21 level differs with age in the pediatric population is unclear.
In this study, there was no correlation between FGF21 level and age in GHD and ISS children. In addition, GHD and ISS children were younger but had higher FGF21 level compared to the control group. It is not clear whether the increase in FGF21 level with age in the control group is due to aging itself or to the increase in BMI and insulin resistance with age.
In GHD patients treated with GH for 1 year, IGF1 and FFA levels increased; the FGF21 level also increased, albeit not significantly. The FGF21 level at 12 months was negatively correlated with the initial FGF21 level and positively correlated with GV and the FFA level at 12 months. The increase in the FFA level after GH treatment may be the result of lipolysis induced by GH administration.2930 One adult study evaluated the effects of GH treatment on FGF21 levels in adults with GHD and normal controls.34 Contrasting our study, 3 weeks of GH treatment did not affect the FFA and FGF21 levels in adults with GHD, while FGF21 increased with excess GH in normal adults. The effects of GH treatment on FGF21 levels may differ depending on the age group or GH status; further study of pediatric populations is needed.
In the children treated with GH for 12 months, GV was correlated positively with the delta IGF1 level. We also found an inverse relationship between the baseline FGF21 level and GV for 12 months with marginal significance.
In ISS patients treated with GH for a year, IGF1 level increased significantly. FFA and FGF21 levels increased, as in GHD children, but none were significant. Delta FGF21 showed a positive correlation with GV during 12 months, with marginal significance. Unlike GHD children, GV during 12 months in ISS children did not show a negative correlation with the baseline FGF21 level, but showed a positive correlation with pretreatment height SDS.
The relationships between GV and pretreatment FGF21 level in children with GH therapy may suggest differences in the inhibitory effects of FGF21 on growth between GHD and ISS. The effectiveness of GH treatment appears to be related with the inhibitory effect of FGF21 in GHD children, but not as significantly affected as GHD in ISS children.
However, the number of ISS children treated with GH in this study was too small to evaluate their clinical significance. Although the small number of participants limits the statistical power, our results suggest an inhibitory role for FGF21 in GH action in the GHD children. The growth rate after GH treatment can be affected by the mutual effects of the growth inhibition due to increased FGF21 and the growth stimulation due to increased IGF1. In clinical practice, the effects of GH therapy on growth rate decrease gradually. We assumed that the elevated FGF21 level during GH therapy suppresses the effect of GH on growth; however, the FGF21 level at 12 months and delta FGF21 in GHD children and FGF21/BMI at 12 months in ISS children were positively correlated with GV in the univariate model. This suggests a complex mutual relationship between GH therapy and FGF21 levels. Elevated FGF21 levels during GH treatment may influence the gradual decrease in growth rate during long-term GH therapy. Additional long-term prospective studies should investigate the causal relationship between the FGF21 level and response to GH therapy.
The FGF21 level after 6 months of GH treatment was negatively correlated with the peak GH level, as determined by the GH stimulation test in the GHD children. Assuming that the increased FGF21 level is the result of GH treatment, then the greater the GHD, the greater the effect of GH administration. However, the FGF21 level in GHD children treated with GH for 12 months was not correlated with the peak GH level. Therefore, the relationship between the peak GH level and the FGF21 level after GH treatment may occur only during the early stages of GH treatment.
Metabolic changes after GH treatment, such as increased HOMA-IR and TG level in GHD, may affect FGF21 level and its relationship with GV. It is known that the GH-induced FGF21 production is mediated by FFA through PPARα, rather than the direct action of GH.29 Therefore, it would be reasonable to assume that the change in FGF21 after GH treatment was mainly affected by an increase in FFA, a product of GH induced lipolysis, rather than insulin resistance or direct GH action.
This study had several limitations. First, ISS is a complex rather than a specific disease and has heterogeneous etiologies, including IGF1 deficiency, GH resistance, and a constitutional delay in growth. In this study, the IGF1 concentration was lower in children with ISS than in those with GHD, and the reproducibility of this result may differ in other ISS groups. Second, whether the high FGF21 level is the cause or the result of short stature remains unclear. Third, the GH treatment group was small and the treatment period relatively short. To our knowledge, however, this study is the first to investigate FGF21 levels in children with GHD and ISS treated for up to 1 year with GH and the first to evaluate FGF21 levels in children with GHD and ISS. Future studies involving a larger number of participants and a longer treatment period are likely to yield more meaningful results.
In conclusion, short children, both those with and those without GHD, had higher FGF21 levels compared with the controls. FGF21 level was negatively correlated with FFA level in GHD children. In GH-treated GHD children, the pretreatment FGF21 level had a negative association with GV after GH treatment. The higher the GV, the more pronounced the increase in the FGF21 level. Taken together, our results suggest the existence of a GH-FFA-FGF21 axis in children.

ACKNOWLEDGMENTS

The authors thank Da-hye Lee, Jeong-Seon Lee, Yun Soo Choi, Sang Hee Park, and Jeong Seon Lee for their assistance with the data collection process.

Notes

Funding: This work was supported by a clinical research grant-in-aid from the Seoul Metropolitan Government-Seoul National University (SMG-SNU) Boramae Medical Center (03-2018-17).

Disclosure: The authors have no potential conflicts of interest to disclose.

Author Contributions:

  • Conceptualization: Lee SY.

  • Data curation: Lee YJ, Kim J, Lee SY.

  • Formal analysis: Lee YJ, Lee SY.

  • Funding acquisition: Lee SY.

  • Investigation: Lee YJ, Jung SY, Lee SY.

  • Methodology: Lee YJ, Lee YA, Kim J, Lee SY, Shin CH.

  • Validation: Lee SY.

  • Writing - original draft: Lee SY.

  • Writing - review & editing: Lee YJ, Jung SY, Lee YA, Kim J, Lee SY, Shin CH.

References

1. Wit JM, Clayton PE, Rogol AD, Savage MO, Saenger PH, Cohen P. Idiopathic short stature: definition, epidemiology, and diagnostic evaluation. Growth Horm IGF Res. 2008; 18(2):89–110. PMID: 18182313.
crossref
2. Kliewer SA, Mangelsdorf DJ. A dozen years of discovery: insights into the physiology and pharmacology of FGF21. Cell Metab. 2019; 29(2):246–253. PMID: 30726758.
crossref
3. Potthoff MJ, Inagaki T, Satapati S, Ding X, He T, Goetz R, et al. FGF21 induces PGC-1alpha and regulates carbohydrate and fatty acid metabolism during the adaptive starvation response. Proc Natl Acad Sci U S A. 2009; 106(26):10853–10858. PMID: 19541642.
crossref
4. Dushay JR, Toschi E, Mitten EK, Fisher FM, Herman MA, Maratos-Flier E. Fructose ingestion acutely stimulates circulating FGF21 levels in humans. Mol Metab. 2014; 4(1):51–57. PMID: 25685689.
crossref
5. Laeger T, Henagan TM, Albarado DC, Redman LM, Bray GA, Noland RC, et al. FGF21 is an endocrine signal of protein restriction. J Clin Invest. 2014; 124(9):3913–3922. PMID: 25133427.
crossref
6. Baek J, Nam HK, Rhie YJ, Lee KH. Serum FGF21 levels in obese Korean children and adolescents. J Obes Metab Syndr. 2017; 26(3):204–209. PMID: 31089518.
crossref
7. Mraz M, Bartlova M, Lacinova Z, Michalsky D, Kasalicky M, Haluzikova D, et al. Serum concentrations and tissue expression of a novel endocrine regulator fibroblast growth factor-21 in patients with type 2 diabetes and obesity. Clin Endocrinol (Oxf). 2009; 71(3):369–375. PMID: 19702724.
crossref
8. Domouzoglou EM, Vlahos AP, Cholevas VK, Papafaklis MI, Chaliasos N, Siomou E, et al. Association of fibroblast growth factor 21 with metabolic syndrome and endothelial function in children: a prospective cross-sectional study on novel biomarkers. Ann Pediatr Endocrinol Metab. 2021; 26(4):242–251. PMID: 34015901.
crossref
9. Zhang X, Yeung DC, Karpisek M, Stejskal D, Zhou ZG, Liu F, et al. Serum FGF21 levels are increased in obesity and are independently associated with the metabolic syndrome in humans. Diabetes. 2008; 57(5):1246–1253. PMID: 18252893.
crossref
10. Chen C, Cheung BM, Tso AW, Wang Y, Law LS, Ong KL, et al. High plasma level of fibroblast growth factor 21 is an Independent predictor of type 2 diabetes: a 5.4-year population-based prospective study in Chinese subjects. Diabetes Care. 2011; 34(9):2113–2115. PMID: 21750278.
crossref
11. Cheng X, Zhu B, Jiang F, Fan H. Serum FGF-21 levels in type 2 diabetic patients. Endocr Res. 2011; 36(4):142–148. PMID: 21973233.
crossref
12. Semba RD, Sun K, Egan JM, Crasto C, Carlson OD, Ferrucci L. Relationship of serum fibroblast growth factor 21 with abnormal glucose metabolism and insulin resistance: the Baltimore Longitudinal Study of Aging. J Clin Endocrinol Metab. 2012; 97(4):1375–1382. PMID: 22344195.
crossref
13. Lee Y, Lim S, Hong ES, Kim JH, Moon MK, Chun EJ, et al. Serum FGF21 concentration is associated with hypertriglyceridaemia, hyperinsulinaemia and pericardial fat accumulation, independently of obesity, but not with current coronary artery status. Clin Endocrinol (Oxf). 2014; 80(1):57–64. PMID: 23278761.
crossref
14. Giannini C, Feldstein AE, Santoro N, Kim G, Kursawe R, Pierpont B, et al. Circulating levels of FGF-21 in obese youth: associations with liver fat content and markers of liver damage. J Clin Endocrinol Metab. 2013; 98(7):2993–3000. PMID: 23626003.
crossref
15. Li H, Bao Y, Xu A, Pan X, Lu J, Wu H, et al. Serum fibroblast growth factor 21 is associated with adverse lipid profiles and gamma-glutamyltransferase but not insulin sensitivity in Chinese subjects. J Clin Endocrinol Metab. 2009; 94(6):2151–2156. PMID: 19318452.
crossref
16. Akyildiz ZI, Polat S, Yurekli BS, Kocabas GU, Tuluce K, Tuluce SY, et al. Epicardial fat, body mass index, and triglyceride are independent contributors of serum fibroblast growth factor 21 level in obese premenopausal women. J Endocrinol Invest. 2015; 38(3):361–366. PMID: 25312836.
crossref
17. Inagaki T, Lin VY, Goetz R, Mohammadi M, Mangelsdorf DJ, Kliewer SA. Inhibition of growth hormone signaling by the fasting-induced hormone FGF21. Cell Metab. 2008; 8(1):77–83. PMID: 18585098.
crossref
18. Kubicky RA, Wu S, Kharitonenkov A, De Luca F. Role of fibroblast growth factor 21 (FGF21) in undernutrition-related attenuation of growth in mice. Endocrinology. 2012; 153(5):2287–2295. PMID: 22374976.
crossref
19. Mericq V, De Luca F, Hernandez MI, Peña V, Rossel K, Garcia M, et al. Serum fibroblast growth factor 21 levels are inversely associated with growth rates in infancy. Horm Res Paediatr. 2014; 82(5):324–331. PMID: 25300595.
crossref
20. Guasti L, Silvennoinen S, Bulstrode NW, Ferretti P, Sankilampi U, Dunkel L. Elevated FGF21 leads to attenuated postnatal linear growth in preterm infants through GH resistance in chondrocytes. J Clin Endocrinol Metab. 2014; 99(11):E2198–E2206. PMID: 25137423.
crossref
21. Fazeli PK, Misra M, Goldstein M, Miller KK, Klibanski A. Fibroblast growth factor-21 may mediate growth hormone resistance in anorexia nervosa. J Clin Endocrinol Metab. 2010; 95(1):369–374. PMID: 19926712.
crossref
22. Kim JH, Yun S, Hwang SS, Shim JO, Chae HW, Lee YJ, et al. The 2017 Korean National Growth Charts for children and adolescents: development, improvement, and prospects. Korean J Pediatr. 2018; 61(5):135–149. PMID: 29853938.
crossref
23. Grunwald T, De Luca F. Role of fibroblast growth factor 21 (FGF21) in the regulation of statural growth. Curr Pediatr Rev. 2015; 11(2):98–105. PMID: 26133178.
crossref
24. Wu S, Levenson A, Kharitonenkov A, De Luca F. Fibroblast growth factor 21 (FGF21) inhibits chondrocyte function and growth hormone action directly at the growth plate. J Biol Chem. 2012; 287(31):26060–26067. PMID: 22696219.
crossref
25. Reinehr T, Woelfle J, Wunsch R, Roth CL. Fibroblast growth factor 21 (FGF-21) and its relation to obesity, metabolic syndrome, and nonalcoholic fatty liver in children: a longitudinal analysis. J Clin Endocrinol Metab. 2012; 97(6):2143–2150. PMID: 22438225.
crossref
26. Kralisch S, Fasshauer M. Fibroblast growth factor 21: effects on carbohydrate and lipid metabolism in health and disease. Curr Opin Clin Nutr Metab Care. 2011; 14(4):354–359. PMID: 21505329.
crossref
27. Hanks LJ, Casazza K, Ashraf AP, Wallace S, Gutiérrez OM. Fibroblast growth factor-21, body composition, and insulin resistance in pre-pubertal and early pubertal males and females. Clin Endocrinol (Oxf). 2015; 82(4):550–556. PMID: 25039824.
crossref
28. Korwutthikulrangsri M, Mahachoklertwattana P, Chanprasertyothin S, Pongratanakul S, Poomthavorn P. Serum fibroblast growth factor 21 in overweight and obese Thai children and adolescents: its relation to glucose metabolism and its change after glucose loading. Clin Endocrinol (Oxf). 2015; 83(6):820–827. PMID: 25929297.
crossref
29. Chen W, Hoo RL, Konishi M, Itoh N, Lee PC, Ye HY, et al. Growth hormone induces hepatic production of fibroblast growth factor 21 through a mechanism dependent on lipolysis in adipocytes. J Biol Chem. 2011; 286(40):34559–34566. PMID: 21849508.
crossref
30. Gälman C, Lundåsen T, Kharitonenkov A, Bina HA, Eriksson M, Hafström I, et al. The circulating metabolic regulator FGF21 is induced by prolonged fasting and PPARα activation in man. Cell Metab. 2008; 8(2):169–174. PMID: 18680716.
crossref
31. Hero M, Dunkel L, Vaaralahti K, Raivio T. Serum FGF21 in boys with idiopathic short stature: relationship to lipid profile, onset of puberty and growth. Clin Endocrinol (Oxf). 2011; 75(1):141–142. PMID: 21521270.
crossref
32. Hanks LJ, Gutiérrez OM, Bamman MM, Ashraf A, McCormick KL, Casazza K. Circulating levels of fibroblast growth factor-21 increase with age independently of body composition indices among healthy individuals. J Clin Transl Endocrinol. 2015; 2(2):77–82. PMID: 26042208.
crossref
33. Bisgaard A, Sørensen K, Johannsen TH, Helge JW, Andersson AM, Juul A. Significant gender difference in serum levels of fibroblast growth factor 21 in Danish children and adolescents. Int J Pediatr Endocrinol. 2014; 2014(1):7. PMID: 24883065.
crossref
34. Lundberg J, Höybye C, Krusenstjerna-Hafstrøm T, Bina HA, Kharitonenkov A, Angelin B, et al. Influence of growth hormone on circulating fibroblast growth factor 21 levels in humans. J Intern Med. 2013; 274(3):227–232. PMID: 23844970.
crossref

SUPPLEMENTARY MATERIALS

Supplementary Table 1

Comparison of clinical characteristics among the groups after excluding 25 children < 5 years of age
jkms-38-e63-s001.doc

Supplementary Table 2

Correlation between various parameters and the FGF21 level after 6 or 12 months of GH treatment in children with GHD
jkms-38-e63-s002.doc

Supplementary Table 3

Correlation of FGF21 levels after 6 and 12 months of GH treatment with clinical variables in children with ISS
jkms-38-e63-s003.doc
TOOLS
Similar articles