

 PDF
PDF Citation
 Print
Print


INTRODUCTION
Seasonal influenza has been considered a suitable model for understanding the epidemiology of coronavirus disease 2019 (COVID-19) since its early emergence because of the similarity in the mode of infection and range of symptoms.12 Although coronavirus variants have differences in transmissibility, virulence, and severity, public officials, policymakers, and the general public have frequently compared the clinical symptoms and mortality of seasonal influenza to understand the risks of COVID-19 and have commonly been used as a reference in its clinical studies.3456
Globally, annual epidemics of seasonal influenza are estimated to result in approximately 3 to 5 million cases of severe illness and 290,000 to 650,000 respiratory deaths (4.0–8.8 per 100 000 individuals).78 Despite the worldwide epidemiology of seasonal influenza, its use as a benchmark for COVID-19 at the national level requires accurate epidemiological statistics from that country. In addition, seasonal influenza epidemics are highly likely to be influenced by social factors, including country, race, and vaccination.79
To date, Korea has no nationwide data on influenza, which can be used as a reference. Several countries, including Korea, conduct influenza surveillance annually; however, the national-level incidence and mortality rates cannot be confirmed.
The COVID-19 pandemic has lasted approximately 2 years, and several countries have recently declared that they are starting to manage COVID-19 as an endemic disease, such as seasonal influenza.1011 Therefore, an analysis of the influenza epidemic should be conducted to manage COVID-19 at the level of the seasonal influenza epidemic. In addition, claim data offer the benefit of easily obtaining data at the national level. Therefore, this study aimed to investigate seasonal influenza incidence, severity, and mortality using national health insurance claims data.
METHODS
Study design and data sources
A retrospective cohort was constructed using National Health Insurance (NHI) claims data submitted to the Health Insurance Review and Assessment Service (HIRA) from 2011 to 2020, followed by a cross-sectional study for each year. It enables us to analyze and observe representative statistics of the total patient population in Korea because it includes nearly the entire population’s medical utilization.12 Information on patients’ age, sex, type of insurance (NHI or Medical Aid [MA] program, a public assistance program for low-income households), type of medical services (inpatient and outpatient), institution(s) visited, visit dates, diagnoses, medications, and treatments was obtained from the claims data.1213 Furthermore, we used midyear population estimates by age group from Statistics Korea.14
Episode of influenza and case definition
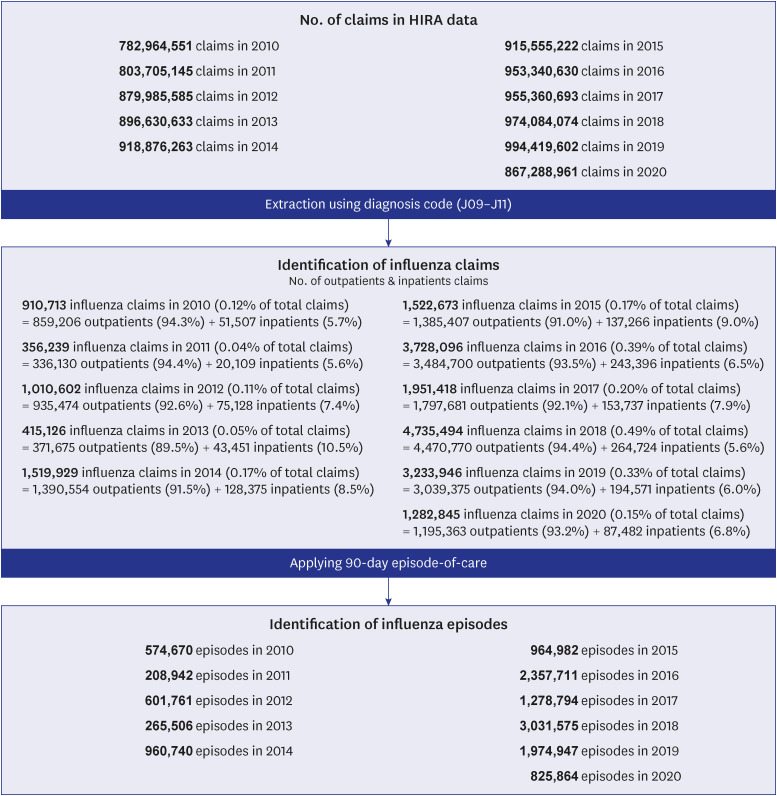
We extracted all inpatient and outpatient claims data regarding seasonal influenza using the Korean Standard Classification of Diseases and Causes of Death-7 (KCD-7) (J09, J10, and J11). However, seasonal influenza has a broad spectrum of symptoms, ranging from asymptomatic to severe respiratory disease, and multiple healthcare utilization can occur in influenza cases. Therefore, a re-diagnosis of influenza within 90 days after the initial diagnosis of influenza was considered as the same episode, and a newly diagnosed influenza after 90 days was considered a new case of influenza (re-infection) (Fig. 1).
The severity of influenza-induced illness was classified into the following: mild (ambulatory state, category 1–2), moderate (non-intensive care unit [ICU] hospitalization and/or oxygen therapy, category 3–4), severe (ICU hospitalization, and/or invasive mechanical ventilation, category 5–6), and dead (death, category 7) using the modified 7-category ordinal scale of clinical status for hospitalized patients with influenza and the ordinary scale for COVID-19 of the World Health Organization.15161718 For this classification, we defined hospitalization, applying oxygen therapy, ICU hospitalization, and wearing a mechanical ventilator within 28 days of being diagnosed with influenza as influenza-related events in this study. However, it is not limited to influenza-caused events. We estimated the timeframe using the first admission date because we could not obtain the dates of ICU hospitalization, oxygen therapy, and ventilation from the claim’s date.
In this study, deaths that occurred within 28 days of being diagnosed with influenza were defined as influenza-related deaths, and it should be noted that deaths were all caused deaths. In case of in-hospital death, we categorized the underlying cause of death based on the KCD-7 as pneumonia and influenza (J09-J18), other respiratory diseases (J00-J08 and J19-J99), and circulatory disease (I00-I99) using the diagnosis at the time of admission.
Statistical analyses
Baseline characteristics for the study cohort are presented as mean with standard deviations and median with interquartile range for the age. Other demographic data were presented as number and percentage. The crude incidence rate of influenza was calculated by dividing the midyear population by the year. In addition, crude influenza-related event rates (hospitalization, ICU use, and death) were calculated by dividing the number of influenza cases by the year. Furthermore, the severity of influenza using mutually exclusive categories (mild, moderate, severe, and dead) was expressed as numbers and proportions for the age groups of ≤ 4, 5–19, 20–49, 50–59, 60–69, 70–79, and ≥ 80 years. The case fatality rate was the crude proportion of dead cases and was calculated as the number of deaths among patients with influenza at that time.
Age-standardized incidence and mortality rates were generated for age groups ≤ 4, 5–19, 20–49, 50–59, 60–69, 70–79, and ≥ 80 years using the Statistics Korea 2005 mid-year population structure as a reference. In addition, simple and multiple logistic regressions were performed to assess the associations of demographic characteristics and comorbidity using the Charlson Comorbidity Index (CCI) with influenza-related hospitalization, severe illness (use of ICU or mechanical ventilator), and death in 2018, with the highest incidence of influenza.
The statistical significance threshold was set at P < 0.05. All analyses were performed using the Statistical Analysis System (SAS) software (version 9.4; SAS Institute Inc., Cary, NC, USA).
RESULTS
Characteristics of influenza cases in Korea
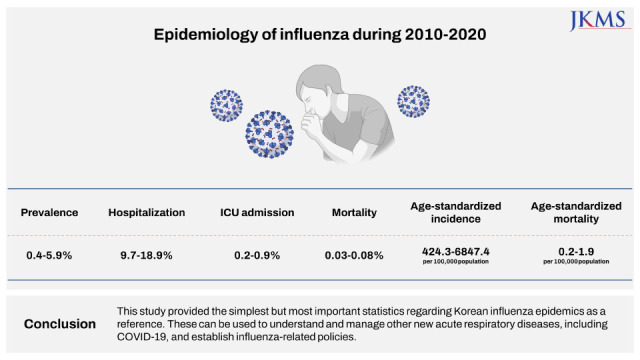
From 2010 to 2020 (11 years), there were 208,942–3,031,575 influenza cases (0.4%–5.9% of the population) per year in Korea, with the number of influenza cases fluctuating significantly by year. Except for 2020, more than 1 million cases have occurred yearly since 2016, and the largest number of influenza cases occurred, with 3,031,575 and 2,357,711 cases in 2018 and 2016, respectively. The mean patients’ age of influenza cases was 24.7 ± 20.7 and 29.3 ± 22.0 years in 2010 and 2020, respectively. Notably, by age group, the number and proportion of influenza cases were more than 50% in the < 20 years age group, while the proportion of influenza cases was only 8.0% in the ≥ 60 years age group. In addition, influenza cases were more likely to be female (53.7%; range, 52.6–54.8%), 97.9% (range, 96.8–98.3%) of cases were covered by NHI, and 2.1% (range, 1.7–3.2%) were medical aid recipients. Among influenza cases, 9.7–18.9%, 0.2–0.9%, and 0.03–0.08% were hospitalized, used in the ICU, and dead within 28 days of being diagnosed with influenza, respectively (Table 1). The crude number and incidence rate of influenza, crude number and rate of influenza-related hospitalizations, crude number of influenza-related deaths, and case fatality rates by age 5 years from 2010 to 2020 are presented in Supplementary Tables 1, 2, and 3, respectively.
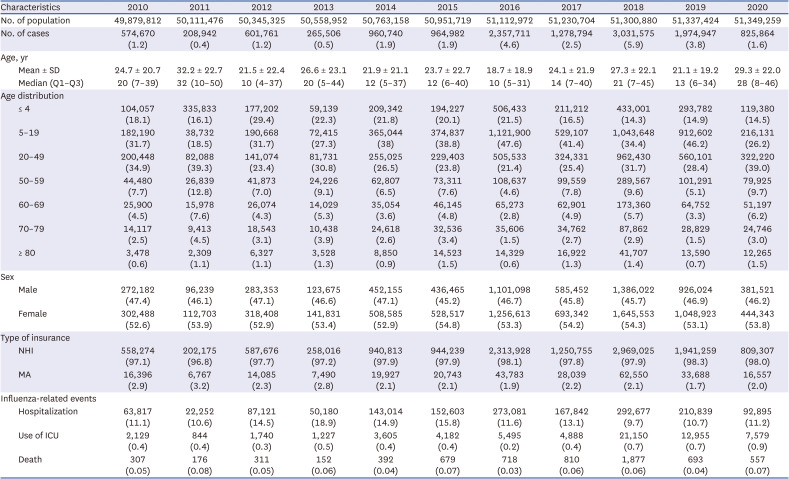
Table 1
Characteristics of study subjects
Data shown are number (%) not otherwise specified.
SD = standard deviation, Q1-Q3 = first and third quartiles, NHI = National Health Insurance, MA = Medical Aid, ICU = intensive care unit.
![]()
Age-standardized incidence of influenza
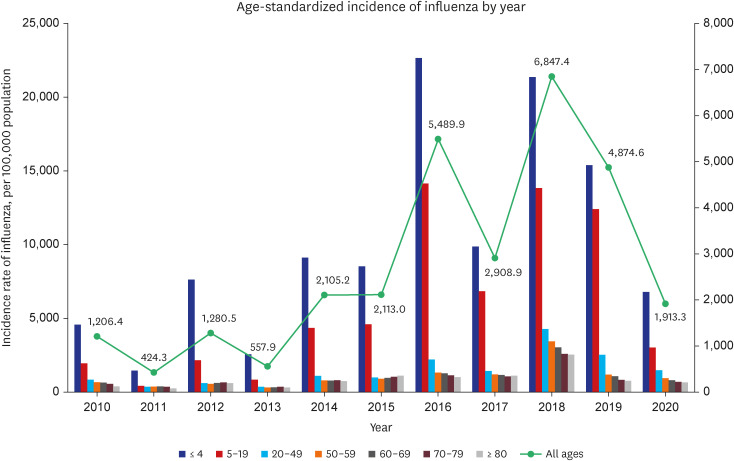
The total incidence rate of influenza was lowest in 2011 and 2013, with 424.3 and 557.9 cases per 100,000 population, respectively, and highest in 2018 at 6847.4 cases per 100,000 population. Furthermore, by age group, the highest incidence rate was observed in the population younger than 5 years, ranging from 1,451.6 to 22,660.0 cases per 100,000 population by year, and it decreased as the age increased. In 2012, 2013, and 2015, the lowest incidence of influenza was observed in the age group 50–59 years, and in 80 years and older for the remaining years. Despite the significant fluctuation in influenza incidence by year, it tended to decrease with increasing age (Supplementary Table 4, Fig. 2).
Severity of influenza cases
Most influenza cases (81.1–90.3%) were classified as mild (ambulatory status) and treated only in an outpatient setting within 28 days after the diagnosis of influenza. However, 0.2–0.9% were severe (ICU hospitalization and/or invasive mechanical ventilation), and approximately 0.1% died. The lowest proportion of mild cases was observed in the age group 80 years and older, 70 years, and younger than 5 years, with 49.8–75.0%, 67.6–85.0%, and 70.1–84.2% by year, respectively; the highest proportion of moderate cases was also observed in these 3 age groups, ranging from 21.1% to 43.9%, 13.3% to 29.8%, and 15.0% to 29.8%, respectively. Furthermore, the highest proportion of severe cases was found in the age group of 80 years and older (1.6–8.6%) and increased as the age increased before 2018. From 2018 to 2020, the proportion of severe cases in the age group younger than 5 years was 0.8%, which was higher than those in previous years. The case fatality rate of influenza was less than 0.1% in patients aged younger than 49 years. However, it increased exponentially from 0.4–0.7% and 1.9–2.9% by year in the age group of 70 and 80 years and older, respectively (Table 2, Fig. 3).
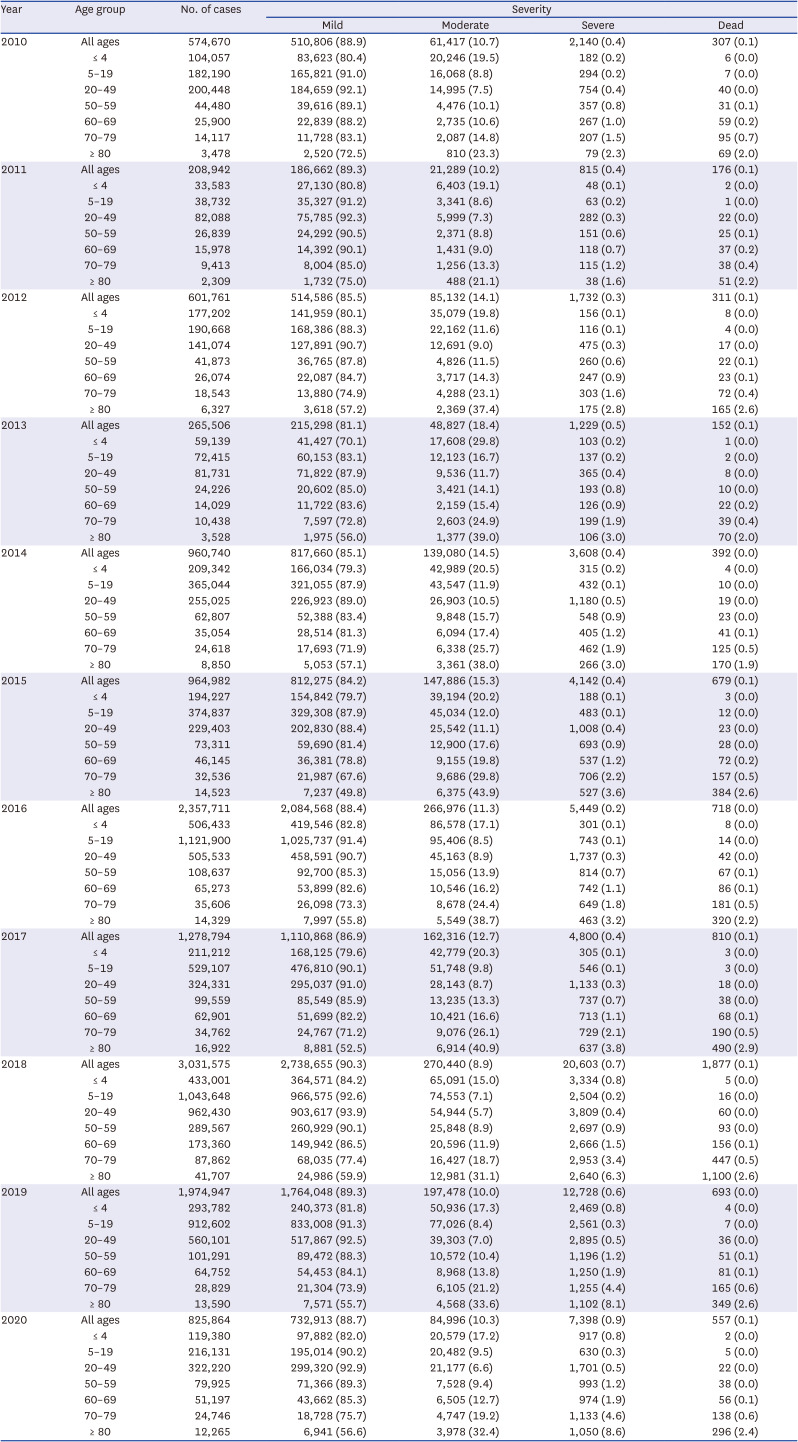
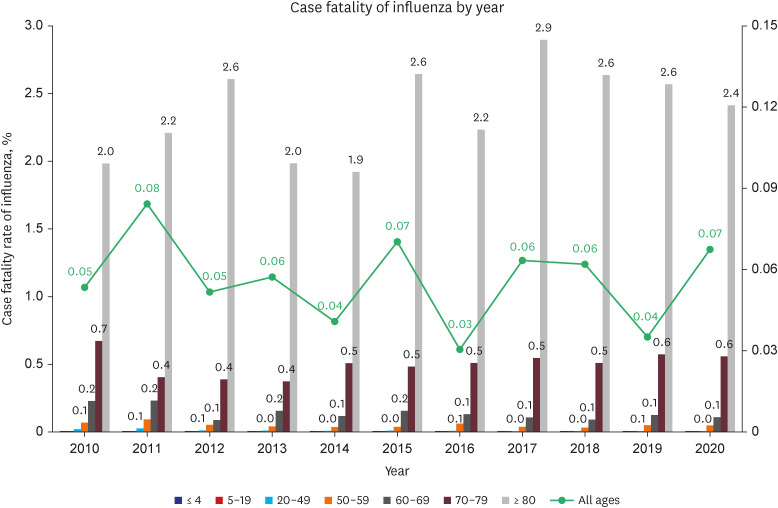
Table 2
Severity of influenza cases, 2010–2020
![]()
Age-standardized mortality of influenza and underlying causes of death
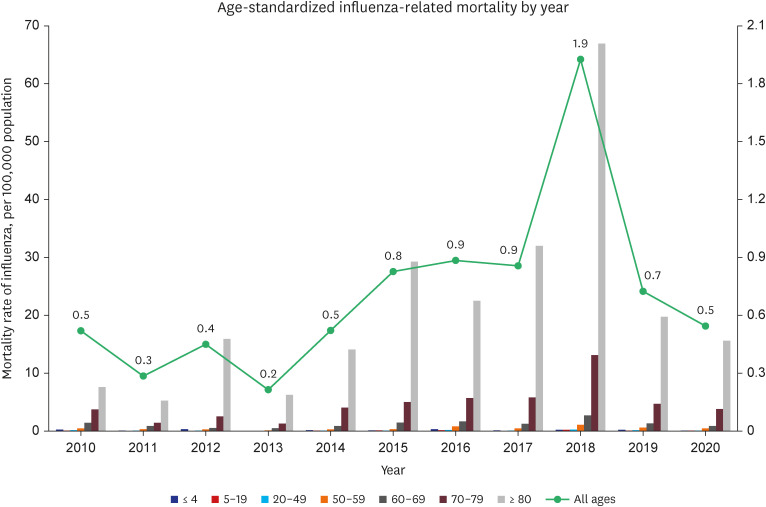
The total number of age-standardized influenza-related deaths varied by year, from 105 in 2013 to 938 in 2018; deaths within 28 days in those younger than 20 years accounted for less than 7%, whereas deaths in older than 60 years accounted for more than two-thirds of all deaths. Overall influenza-related mortality was lowest in 2013 and 2011, with 0.2 and 0.3 per 100,000 population, respectively, and the highest in 2018 with 1.9 per 100,000 population. In addition, the highest mortality rate was found in the age group of 80 years and older, ranging from 5.3 to 66.9 cases per 100,000 population per year. Furthermore, it increased significantly as the age group increased (Supplementary Table 5, Fig. 4).
Among all-cause deaths within 28 days associated with influenza, in-hospital deaths accounted for 75.0–84.7% annually. Because of classifying in-hospital deaths into underlying causes of death, pneumonia, and influenza (J09-J18), other respiratory diseases (J00-J08 and J19-J99), and circulatory diseases (I00-I99) were 37.4–51.5%, 8.8–14.9%, and 7.0–14.9%, respectively (Table 3).
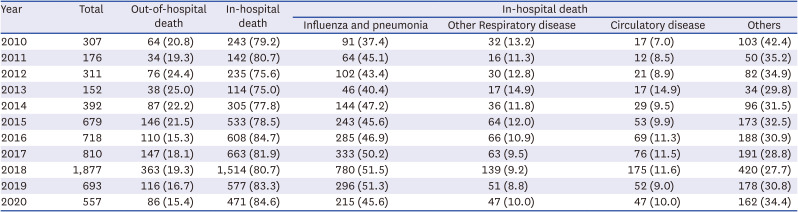
Table 3
Location and underlying causes of death, 2010–2020
![]()
Risk factors associated with hospitalization, severe illness, and death
The risk of hospital admission was significantly higher in the age group of 80 years and older (adjusted odds ratio [aOR], 6.87; 95% confidence interval [CI], 6.72–7.03), 70’s (aOR, 3.25; 95% CI, 3.19–3.31), and in the age group of younger than 5 years (aOR, 2.84; 95% CI, 2.81–2.88) than in the reference age group (20–49 years). In addition, influenza cases in females (aOR: 1.04, 95% CI: 1.04–1.05), MA (aOR, 2.06; 95% CI, 2.02–2.10), and higher CCI scores (aOR, 1.36; 95% CI, 1.35–1.38 in CCI score with 1–2; aOR, 2.19; 95% CI, 2.16–2.22 in CCI score > 3) were more likely to be admitted to hospitals.
Older age (aOR, 5.97; 95% CI, 5.67–6.28 in the age group 70 years; aOR, 11.17; 95% CI, 10.59–11.79 in the age group 80 years and older), MA (aOR, 3.24; 95% CI, 3.10–3.39), and higher CCI score (aOR, 1.44; 95% CI, 1.40–1.49 in CCI score with 1–2; aOR, 2.57; 95% CI, 2.47–2.68 in CCI score with over 3) were associated with the presence of influenza-related severe illness. Moreover, the age group of 5–19 years (aOR, 0.61; 95% CI, 0.58–0.64) and females (aOR, 0.78; 95% CI, 0.75–0.80) were less likely to use ICU or wear mechanical ventilators than the reference group. Similar to hospitalization, the age group younger than 5 years (aOR, 1.85; 95% CI, 1.77–1.95) was associated with increased use of ICU or mechanical ventilators compared with the reference age group.
Notably, similar patterns in the risk factors for death were observed, except for the age group younger than 5 years. Younger age (aOR, 0.17; 95% CI, 0.07–0.43 in the age group < 5 years; aOR, 0.25; 95% CI, 0.14–0.44 in the age group 5–19 years) was associated with decreased death, and influenza cases in older age (aOR, 50.97; 95% CI, 38.68–67.16; aOR, 251.24; 95% CI, 192.03–328.70 in the age group 80+ years) were significantly associated with increased influenza-related death (Table 4).
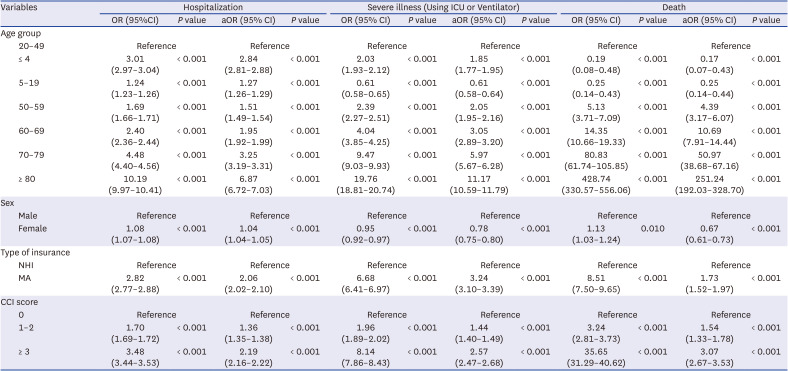
Table 4
Factors associated with hospitalization, severe illness, and death of influenza, 2018
P values for all variables are significant (P < 0.05).
ICU = intensive care unit, OR = odds ratio, aOR = adjusted odds ratio, CI = confidence interval, NHI = National Health Insurance, MA = Medical Aid, CCI = Charlson Comorbidity Index.
![]()
DISCUSSION
Annually, there were 0.4–5.9% influenza cases in the population, of which 9.7–18.9%, 0.2–0.9%, and 0.03–0.08% were hospitalized, used in the ICU, and dead within 28 days of being diagnosed with influenza, respectively. Most of the influenza cases (81.1–90.3%) were mild; however, 0.2–0.9% were severe, and less than 0.08% died.
Due to the contribution of differences in climatic and ecological drivers, cultural and social aspects, and demographic characteristics to the patterns and magnitude of influenza, there are limitations in directly compare our results with those of other countries.19 According to our study, the incidence rate of influenza in Korea was lower, the hospitalization rate was more than twice as high, and case fatality was similar to or lower than Japan and United States. In the most recently published Japanese documents estimated from Japanese medical data, the influenza incidence rate, hospitalization rate, the use rate of ICU or mechanical ventilation, and mortality rate for 2017–2020 were 5.7–11.4%, 1.62%, 0.08%, and 0.09%, respectively.20 In the United States, the estimated influenza incidence rate among all age groups ranged from 3.0% to 11.3% between 2010 and 2016, with 13.2% and 3.9% for children younger than 5 years and adults ≥ 65 years, respectively.21 In addition, the estimated influenza disease burden from population-based surveillance data was 114,192–624,435 hospitalizations, 18,491–95,390 ICU admissions, 4,915–27,174 deaths annually, and 54–70% of hospitalizations and 71–85% of deaths occurred among adults aged 65+.22 According to in-season disease burden estimates provided by the Centers for Disease Control and Prevention, there were 9–41 million, 140,000–710,000, and 12,000–52,000 symptomatic influenza illnesses, hospitalizations, and deaths annually, respectively. Therefore, it can be calculated that the hospitalization rate was 1.2–2.0%, and the mortality rate was 0.10–0.18% between the 2010/11 and 2019/20 flu seasons.23
Unlike our study, the United States using population-based surveillance data, including the Influenza Hospitalization Surveillance Network and the multiplier method to estimate influenza. Therefore, there are differences in the results, and the United States’ method has limitations in the generalization and accuracy according to the time of estimation and changes in patterns of care-seeking.2224
By age group, the highest age-standardized incidence rate was observed in the population younger than 5 years, ranging from 1,451.6 to 22,600.0 cases per 100,000 population yearly. It showed a tendency to decrease with the increasing age group. In contrast, the highest proportion of severe cases and the case fatality rate were found in the age group of 80 years and older, with 1.6–8.6% and 1.9–2.9%, respectively, and increased as the age increased. In addition, the highest age-standardized mortality rate was observed in the age group of 80 years and older, ranging from 5.3 to 66.9 cases per 100,000 population yearly. It increased significantly as the age group increased. Notably, more than three-quarters of all-cause influenza-related deaths occurred during hospitalization. Furthermore, more than half of the underlying causes of death were respiratory diseases, including pneumonia and influenza. Influenza cases in the age group younger than 5 years were more likely to be admitted to the hospital and use ICU or mechanical ventilators; however, they were less likely to die. Despite having the lowest incidence of influenza in the age group > 80 years, this group had a significantly high risk of hospitalization, presence of severe illness, and death.
In Japan, during the 3-year influenza season, children and adolescents younger than 20 years and those aged 65 years and older accounted for 41.6% and 11.5% of patients with influenza, respectively.20 The trend was similar in all countries that the incidence rate in the younger age group was higher than that in the age group over 65 years, and the number of deaths within 28 days was rare in young and middle-aged patients; however, the case fatality rate exceeded 0.1% for the elderly.
In Korea, the incidence of influenza-like illness (ILI) is monitored through a national influenza surveillance system operated by the Korea Centers for Disease Control and Prevention, which is based on the clinical sentinel surveillance system, laboratory sentinel surveillance system, and hospitalization and mortality monitoring system.25 Although it plays a crucial role in identifying influenza epidemic patterns and virus characteristics, the data collected are very limited. Furthermore, due to the small number of participating clinics (approximately 200), calculating the ILI rate by age is limited, and it cannot sufficiently reflect the entire epidemiology.2627
A previous study on the burden of influenza-related diseases in Korea used data combining national influenza virus surveillance data and/or health insurance claim data with the cause of death. However, most studies, such as in other countries, estimated the disease burden using mathematical modeling techniques and covered a specific population group or presented the incidence, hospitalization, death from influenza, or costs segmentally according to the research interests and data sources.28293031
In our study, the number of influenza-related deaths was lower than that reported in previous studies using statistical modeling. For example, a previous study estimated that the excess number was approximately 2,300–5,300 per year in studies using data from the national influenza surveillance system and 532–913 per year in studies analyzing claims data from the National Health Insurance Service.31 However, the number and trend of influenza cases per year were similar to simple statistics on the number of patients with influenza and medical costs.323334 Therefore, these might be attributed to differences in data sources, analysis methods, and the definition of influenza cases and deaths, among others.
The incidence of influenza was higher in 2016 and 2018 in our study. Hospitalization was higher in 2013 and 2015, and mortality was higher in 2011 and 2015. In 2016 and 2018, influenza A strain subtype H1N1, subtype H3N2, and influenza B strain were all detected. Year 2013 and 2015, when influenza A strains subtype H3N2 was detected frequently, was presented with a high hospitalization and fatality rate, which is consistent with previous studies that H3N2 had a higher severity (Supplementary Table 6).3536
This study has some limitations. First, the incidence of influenza might be overestimated because our case definition was based on diagnosis information in claims data; therefore, it could overlap considerably with other respiratory diseases, particularly during influenza epidemics.737 However, estimation of influenza incidence using laboratory test confirmed data, including surveillance systems, is known to be costly and complex, and it is difficult to cover the entire population3839; therefore, our results can provide a more comprehensive measure of the disease burden on influenza. Second, we defined and used all-cause events that occurred within 28 days after the diagnosis of influenza to calculate influenza-related hospitalization, applying oxygen therapy, use of ICU and/or mechanical ventilation, and death, which could result in the risk of losing specificity and overestimation of the actual number of events.40 However, identifying events directly caused by influenza is difficult because respiratory disease, influenza, and pneumonia are less likely to be coded as the underlying causes of events in claims data among influenza cases with chronic diseases.3032 In addition, our approach can include events from influenza complications and/or pre-existing comorbidities exacerbated by influenza while applying a 28-day time window to secure association with influenza. Third, our results cannot provide information regarding the circulating influenza viruses and characteristics of clinical symptoms, the effect of vaccination, and signals for new respiratory infections due to a lack of clinical data or test results. Instead, it can provide more information to better understand the burden of influenza illness and the spectrum of influenza from mild to fatal, which covers almost the entire population. Finally, as our study focused on influenza, the overall burden of respiratory viruses is unknown. A further study on co-infection with respiratory viruses and the burden of disease is needed in the future.
In conclusion, this study provides the simplest but most important statistics regarding influenza epidemics in Korea based on claims data. These results also support the importance of recommending to the high-risk target population such as patients aged 60 years or older and people with major comorbidities to manage the disease burden of influenza. It will be possible to establish a better vaccination and antiviral drug prescription strategy by integrating and analyzing influenza related data such as influenza statistics, vaccination data, and influenza subtype data. In addition, it is necessary to assess and improve the accuracy of the data through regular analysis every year. More studies that harmonize related statistics are required to fully assess epidemics related to influenza and use it in public policy.
 XML Download