

 PDF
PDF Citation
 Print
Print


INTRODUCTION
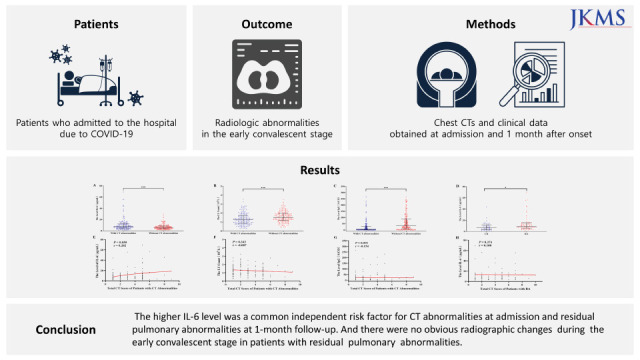
Coronavirus disease 2019 (COVID-19) pandemic caused by severe acute respiratory syndrome coronavirus 2 (SARS-CoV-2) poses a significant threat to global public health, and has caused more than 6 million deaths by October, 2022.1 On 25 November 2021, a new variant was reported to the World Health Organization from South Africa, which was designated as a variant of concern and named it omicron variant (B.1.1.529) of SARS-CoV-2.234 Compared with delta (B.1.617.2) variant, omicron harbors a large number of the mutations that could be more infectious, more transmissible and more capable of evading from neutralizing antibodies. But it causes mild disease in a majority of patients with a favorable prognosis due to vaccination or natural infection.456 Unfortunately, Tianjin became the first city to face the challenges of the first wave of the omicron pandemic in China on January 8, 2022.
Although the nucleic acid amplification test is the only method confirmed by WHO for diagnosing SARS-CoV-2 infections, chest computed tomography (CT) remains an essential tool for disease evaluation.789 Numbers of studies have described the typical chest CT manifestations of COVID-19 pneumonia, including ground-glass opacity (GGO) and consolidation with bilateral peripheral distribution, mainly in the lower lung lobes.1011 Recently, efforts have focused on the dynamic radiographic changes from the initial diagnosis to the convalescent period at 3, 6, 9 and 12 months.121314151617 COVID-19 patients, especially the severe group, often sustain significant residual lung abnormalities on chest CT comprising inflammatory sequelae in 50% patients and fibrotic sequelae in 29% patients at the time of discharge or at follow-up.14151617 But little is known about the radiological features at baseline and outcomes in early convalescence (1 month after diagnosis) of the omicron infected patients.
According to “Diagnosis and Treatment Protocol for Coronavirus Disease 2019 (trial version 8)” issued by the National Health Commission of the People’s Republic of China, COVID-19 patients were required to follow up at 2 and 4 weeks after discharge with or without imaging surveillance.18 But imaging follow-up is recommended for COVID-19 patients 3 months after discharge according to the guidelines published by the British Thoracic Society.19 However, without enough follow-up studies in early convalescence, it is unknown who needs follow-up CT examinations and when to do the first follow-up CT examination for the omicron infected patients.
In this study, we hypothesized some risk factors and short-term changes for radiological abnormalities in omicron infected patients. We systematically reviewed the clinical data of enrolled patients and assessed the impact of potential risk factors, including demographic characteristics, general condition, laboratory markers and radiological features. Secondly, we sought to determine whether the changes of radiological abnormalities detected in patients at baseline and 1 month after diagnosis were significantly different, which may provide evidence to make optimal follow-up plans for different patients.
METHODS
Study design and population
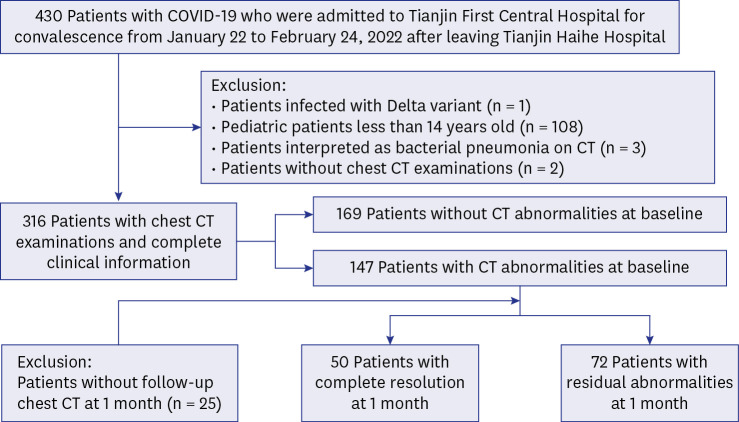
We retrospectively evaluated patients diagnosed with COVID-19 and admitted to Tianjin First Central Hospital for convalescence from January 22 to February 24, 2022 after leaving Tianjin Haihe Hospital (Fig. 1). As shown in Fig. 1, patients were excluded if they were pediatric patients (less than 14 years old),20 or infected with delta variant, or interpreted as bacterial pneumonia on CT, or without two serial chest CT examinations at baseline and one month after diagnosis. Enrolled patients were divided into two groups: patients with CT abnormalities and patients without CT abnormalities at baseline. Patients with CT abnormalities were divided into two subgroups: complete resolution (CR) and residual abnormalities (RA) at 1-month follow-up. And the RA group were further divided into two subgroups: with deterioration (the CT score getting worse at 1 month) and without deterioration (the CT score getting better or without change at 1 month).
Demographic and clinical data
Patient demographic characteristics, clinical information, and laboratory parameters were retrieved from the electronic medical records. The following patient characteristics during hospitalization were recorded: age, gender, body mass index (BMI), initial symptom (including fever, pharyngodynia, cough, rhinorrhea, hyposmia/hypogeusia, myalgia, and fatigue), prior comorbidities (including hypertension, type 2 diabetes mellitus [type 2 DM], cardio-cerebral vascular diseases [CCVDs] and prior lung disease), abnormal liver function during hospitalization, length of hospital stay (LHS), vaccination (including fully vaccinated [three doses of vaccine], partially vaccinated [one or two doses of vaccine] and not vaccinated), days after vaccination (DAV), and vaccine type (including inactivated, adenovirus vector, and recombinant vaccine). The laboratory data were recorded as follows: blood routine (including white blood cell [WBC] count, neutrophil [NEUT] count, lymphocyte [LY] count, and platelet [PLT] count, inflammatory markers [C-reactive protein (CRP) and interleukin-6 (IL-6)]), and SARS-CoV-2 test (IgM and IgG).
SARS-CoV-2 nucleic acid testing
All patients were confirmed by the commercial SARS-CoV-2 nucleic acid test kits with real-time reverse transcriptase polymerase chain reaction of respiratory secretions obtained by nasopharyngeal swab or oropharyngeal swab. The results are shown as the cycle threshold for the ORF1ab and N genes of SARS-CoV-2. And the SARS-CoV-2 variants were identified based on whole genome sequencing.
Chest CT scans and image analysis
Non-contrast chest CT examinations were performed using two 64-slice spiral CT scanners (Siemens Go-Top and Toshiba Canon). Images were obtained during breath-holding at full inspiration from the apex to the base of the lungs. The acquisition parameters were as follows: patient in the supine position; tube voltage, 120kVp with automatic tube current modulation; scan speed, 0.5 s/r; collimation width, 64 × 0.5 mm; matrix size, 512 × 512 and section thickness after reconstruction, 1.0 mm and 1.25 mm.
All acquired chest CT images were independently read on a picture archiving and communication system by three chest radiologists (Li FF, Yang QY, and Yu J) with 5-, 8-, and 10-years’ experience in thoracic radiology, respectively. Afterward, any inconsistency in interpretation was resolved by discussion and consensus. All readers were blinded to the clinical progress of all patients. The CT abnormalities were described with the standard terminology defined in the Fleischner Society glossary21 and previous works of literature on COVID-19.10121415 All imaging manifestations of pulmonary lesions were recorded as listed below: 1) distribution: subpleural, peribronchovascular, or both; 2) number of involved pulmonary lobes; 3) CT abnormalities: GGO, consolidations, parenchymal bands, interlobular septal thickening, or pleural involvement (including pleural thickening and/or effusion) (Fig. 2). To further quantify the extent of pulmonary lesions, a semiquantitative visual scoring method was used.10 Each single lung lobe was scored according to the area percentages of the lesions in the single lung lobe, and the criteria were as followed: 0, 0%; 1, 1–25%; 2, 26–49%; 3, 50–75%; and 4, 76–100%. The summation scores of the five lobes were calculated as the total CT score, ranging from 0 to 20.
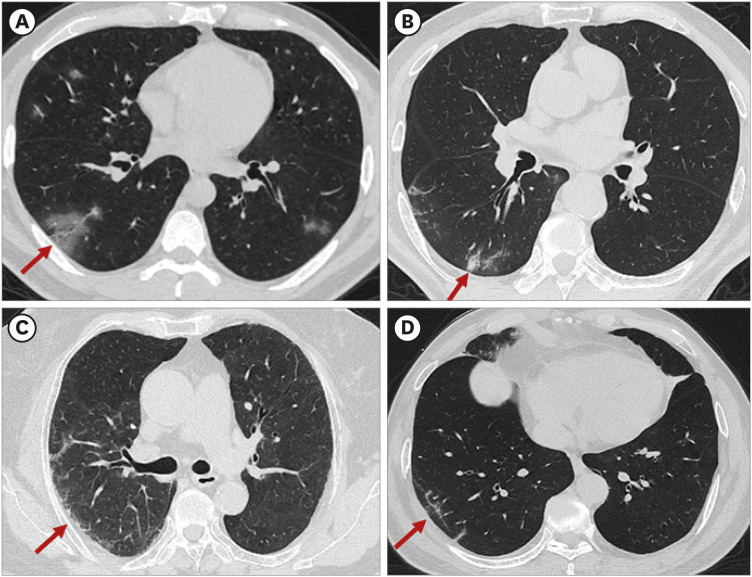
Fig. 2
The pattern of CT abnormalities observed in this study. (A) CT scan showing subpleural ground-glass opacity (red arrow). (B) CT scan showing subpleural consolidation (red arrow). (C) CT scan showing subpleural interlobular septal thickening (red arrow). (D) CT scan showing subpleural line (red arrow).
CT = computed tomography.
Statistical analysis
Normally distributed continuous variables were expressed as mean ± standard deviation (x ± s), and between-group comparisons were subjected to independent sample t-tests. Non-normally distributed continuous variables were expressed as median (interquartile ranges [IQRs]), and compared using the Mann–Whitney U-test. The categorical variables were expressed as counts and percentages, and compared using chi-square test and Fisher’s test. To compare CT abnormalities between baseline and 1-month follow-up, Wilcoxon signed-rank test or McNemar’s test were performed when appropriate.
To explore the independent risk factors associated with residual pulmonary abnormalities, all the clinical, laboratory, and imaging features at baseline with a P < 0.050 were further assessed in the multivariate logistic regression analysis (Enter method), and odds ratios (ORs) with 95% confidence intervals (CIs) were calculated. Furthermore, Spearman rank correlation analysis was used to test for correlations between laboratory parameters and CT scores.
All the statistical analyses were performed using SPSS statistics software version 27.0 (IBM Corp., Armonk, NY, USA). All significance tests were two-sided, and statistical significance was defined as P < 0.050. All correlation graphs were generated in R (version 3.5.2), OriginPro (version 2020), and GraphPad Prism (version 8.0).
RESULTS
Characteristics of the study population
A total of 316 patients were screened for our study, and their demographic and clinical characteristics for each group are presented in Table 1. The mean age of patients was 46 years (IQR, 34–58 years), ranging from 15 to 90 years, with a male-to-female ratio of 1:1.34. The mean BMI of patients was 25.08 (IQR, 22.31–27.76). Pharyngodynia (53%), cough (49%) and fever (29%) were the most common initial symptoms. 43% of patients had prior comorbidities, including hypertension (22%), type 2 DM (11%), CCVD (9%), and chronic pulmonary disease (1%). There were 18% of patients with abnormal liver function during hospitalization. The mean LHS was 13 days (IQR, 11–15 days). More than 90% of patients were vaccinated, including 43% with complete vaccination and 50% with partial vaccination. And more than 80% of patients were vaccinated with inactivated vaccine, while 17% of patients were vaccinated with adenovirus vector vaccine. The mean DAV was 78 days (IQR, 42–194 days).
Table 1
Demographics and clinical characteristics for each group at baseline
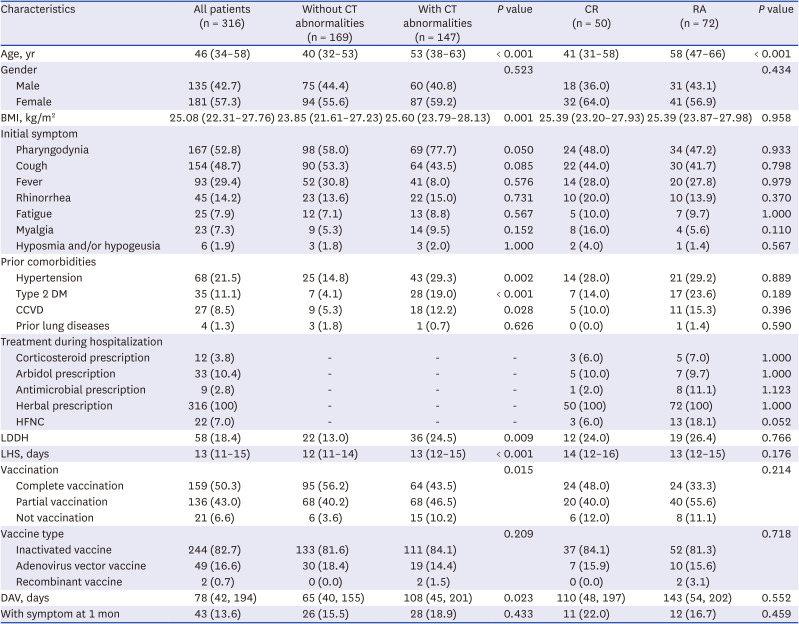
Values are presented as number (%) or median (interquartile range).
The P values reflect comparisons between patients with CT abnormalities and without CT abnormalities, or patients with complete resolution and residual CT abnormalities, respectively.
CT = computed tomography, CR = complete resolution, RA = residual abnormalities, BMI = body mass index, DM = diabetes mellitus, CCVD = cardio-cerebral vascular disease, HFNC = high-flow nasal cannula, LDDH = liver dysfunction during hospitalization, LHS = length of hospital stay, DAV = days after vaccination.
The laboratory test variables in all patients at baseline are shown in Table 2 and Fig. 3. For routine blood tests, the median levels of WBC, NEUT, LY, and PLT count were 5.33 (IQR, 4.41–6.85) × 10-9/L, 3.19 (IQR, 2.21–4.40) × 10-9/L, 1.37 (IQR, 0.97–1.90) × 10-9/L, and 221 (IQR, 184–255) × 10-9/L, respectively. For inflammatory markers, the median levels of CRP and IL-6 were 4.01 (IQR, 1.60–8.74) mg/L and 6.90 (IQR, 4.30–10.50) pg/mL, respectively. For SARS-CoV-2 test, the median levels of IgM and IgG were 0.19 (IQR, 0.09–0.42) S/CO and 20.24 (IQR, 2.18–62.14) S/CO, respectively. Although the median values of almost all laboratory tests were within normal limits, increases in levels of IgG were observed.
Table 2
Laboratory parameters for each group at baseline
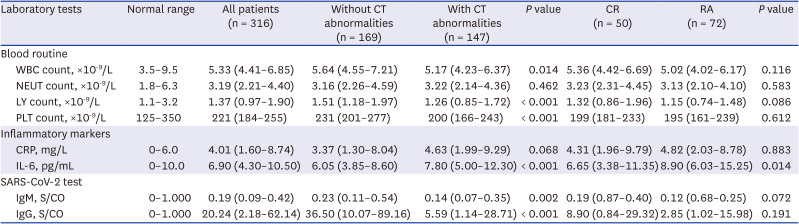
Values are presented as median (interquartile range).
The P values reflect comparisons between patients with CT abnormalities and without CT abnormalities, or patients with complete resolution and residual CT abnormalities, respectively.
CT = computed tomography, CR = complete resolution, RA = residual abnormalities, WBC = white blood cell, NEUT = neutrophil, LY = lymphocyte, PLT = platelet, CRP = C-reactive protein, IL-6 = interleukin-6, SARS-CoV-2 = severe acute respiratory syndrome coronavirus 2.
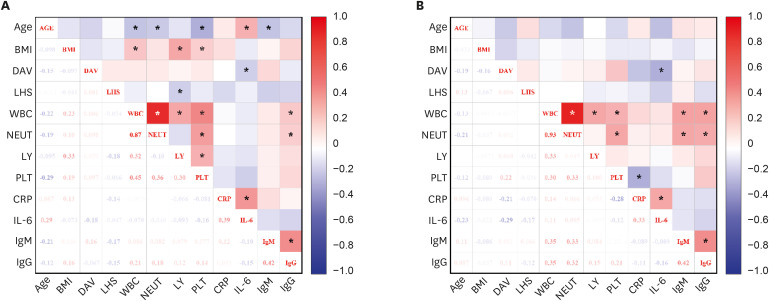
Fig. 3
The correlation heat map showed the correlations between age, BMI, DAV, LHS, WBC, NEUT, LY, PLT, CRP, IL-6, IgM, and IgG for the patient with CT abnormalities (A) and the patient with RA (B). Correlations were computed by Spearman rank correlation. The color in each tile was coded by the strength of Spearman correlation coefficients, and intensity is proportional to the degree of correlation.
BMI = body mass index, DAV = days after vaccination, LHS = length of hospital stay, WBC = white blood cell, NEUT = neutrophil, LY = lymphocyte, PLT = platelet, CRP = C-reactive protein, IL-6 = interleukin-6, RA = residual abnormalities.
*P value < 0.05.
The CT features at baseline are shown in Table 3. Regarding CT abnormalities, GGO (98%), consolidation (40%), and interlobular septal thickening (35%) were the predominant findings (Fig. 4 and Table 3). And most of the lesions (85%) were distributed in the subpleural area, and often involved lower lobes (71% for the left lower lobe and 73% for the right lower lobe, respectively). The median number of involved lung lobes is 3 (IQR, 1–5), and the median total CT score is 3 (IQR, 1–5).
Table 3
Comparison of CT features between CR and RA at baseline and CT patterns of RA at 1 month
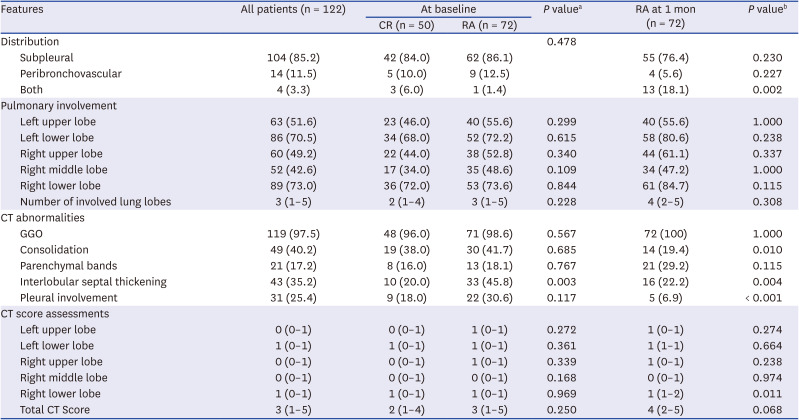
Values are presented as number (%) or median (interquartile range).
CT = computed tomography, CR = complete resolution, RA = residual abnormalities, GGO = ground-glass opacity.
aThe P values reflect comparisons of CT findings between CR group and RA group at baseline.
bThe P values reflect comparisons of CT findings between two examinations of RA group at baseline and 1 month after diagnosis.
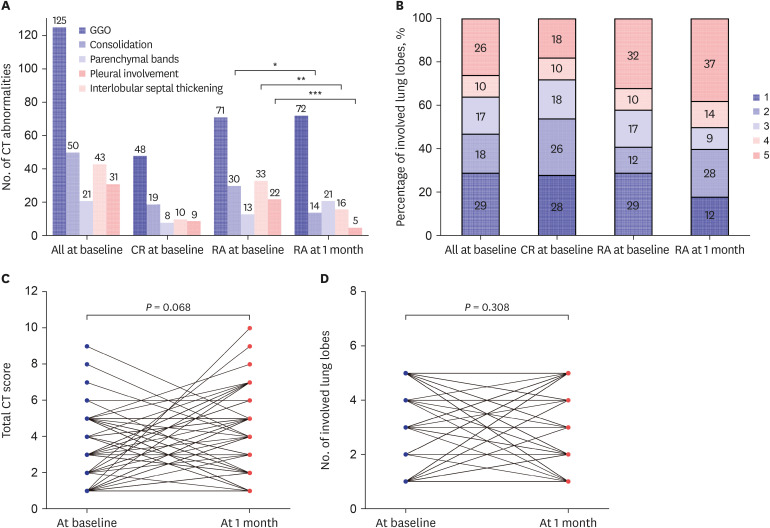
Fig. 4
Graphs show the changes in CT abnormalities over time. (A) The bar graph shows main patterns of lung abnormalities on CT at baseline and 1-month follow-up for different groups. (B) The stacked bar graphs show the distribution of the percentage of involved lung lobes. Paired Wilcoxon signed-rank test comparing changes in CT scores (C) and the number of involved lung lobes (D) between baseline and 1-month follow-up.
CT = computed tomography, CR = complete resolution, RA = residual abnormalities, GGO = ground-glass opacity.
*P value < 0.05, **P value < 0.01, ***P value < 0.001.
Comparisons between patients with and without CT abnormalities at baseline
At baseline, there were 47% patients with CT abnormalities and 53% patients without CT abnormalities (Fig. 1). For demographics and clinical characteristics, the median age (53 [IQR, 38–63] years vs. 40 [IQR, 32–53] years, P < 0.001) and BMI (25.74 [IQR, 23.86–28.26] vs. 23.85 [IQR, 21.61–27.23], P = 0.001) of patients with CT abnormalities was significantly larger than those without CT abnormalities (Table 1). The proportion of patients with hypertension, type 2 DM and CCVD at baseline, liver dysfunction during hospitalization and not vaccination in patients with CT abnormalities was significantly higher than those without CT abnormalities (P < 0.050 for each comparison) (Table 1). The median LHS and DAV of patients with CT abnormalities was significantly longer than those without CT abnormalities (13 [IQR, 12–15] days vs. 12 [IQR, 11–14] days, P < 0.001 and 108 [IQR, 45–201] days vs. 65 [IQR, 40–155] days, P = 0.023, respectively] (Table 1). Regarding laboratory parameters, patients with CT abnormalities had significantly higher level of IL-6 (7.80 [IQR, 5.00–12.30] pg/mL vs. 6.05 [IQR, 3.80–8.60] pg/mL, P < 0.001), but had lower level of WBC count (5.17 [IQR, 4.23–6.37] × 10-9/L vs. 5.64 [IQR, 4.55–7.21] × 10-9/L, P = 0.014), LY count (1.26 [IQR, 0.85–1.72] × 10-9/L vs. 1.51 [IQR, 1.18–1.97] ×10-9/L, P < 0.001), PLT count (200 [IQR, 166–243] × 10-9/L vs. 231 [IQR, 201–277] × 10-9/L, P < 0.001), IgM (0.14 [IQR, 0.07–0.35] S/CO vs. 0.23 [IQR, 0.11–0.54] S/CO, P = 0.002) and IgG (5.59 [IQR, 1.14–28.71] S/CO vs. 36.50 [IQR, 10.07–89.16] S/CO, P < 0.001) than those without CT abnormalities (Table 2).
Age ≥ 50 years, BMI ≥ 23.87, DAV ≥ 81 days, LY count ≤ 1.21×10⁻⁹/L, IL-6 ≥ 10.05 pg/mL and IgG ≤ 14.140 S/CO were independent risk factors for CT abnormalities at baseline (OR = 2.870, 4.171, 2.360, 2.826, 3.886 and 2.828, respectively; P < 0.050 for each comparison) (Figs. 5, 6, and Supplementary Table 1). And CT score of patients with CT abnormalities showed low correlations with the level of IL-6 (spearman r = 0.202, P = 0.030) (Supplementary Fig. 1).
Fig. 5
Risk factors associated with CT abnormalities at baseline (A), and RA at 1-month follow-up. OR and corresponding 95% CI were obtained from multivariable logistic regression analysis (Enter method).
OR = odds ratio, CI = confidence interval, BMI = body mass index, DAV = days after vaccination, LY = lymphocyte, IL-6 = interleukin-6, CT = computed tomography, CR = complete resolution, RA = residual abnormalities.
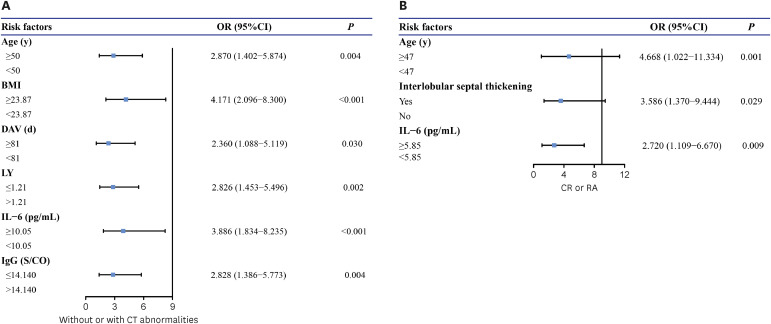
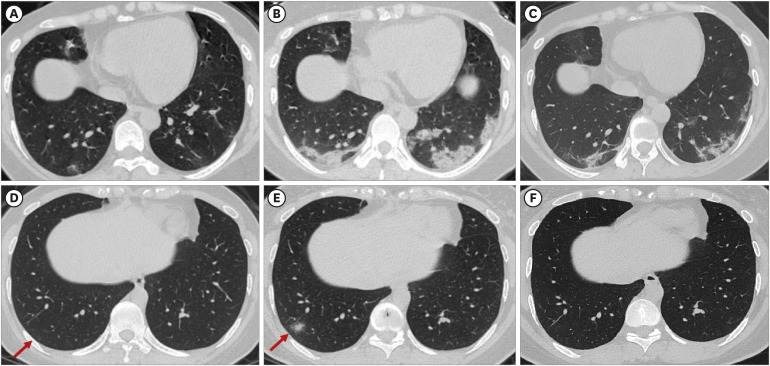
Fig. 6
The omicron infected patient whose IL-6 was 3.6 pg/mL at baseline. (A) Chest CT obtained at baseline showed bilateral subpleural GGOs. (B) Chest CT obtained at 1-week follow-up showed increased extent of bilateral subpleural consolidations with interlobular septal thickening or reticular lesion. (C) Chest CT obtained 1-month follow-up showed residual consolidations with parenchymal bands. The omicron infected patient whose IL-6 was 2.0 pg/mL at baseline. (D) Chest CT obtained at baseline showed slight subpleural GGOs in the right low lobe. (E) Chest CT obtained at 1-week follow-up showed increased extent of subpleural consolidations in the right low lobe. (C) Chest CT obtained 1-month follow-up showed complete resolution of the lesion in the right low lobe.
CT = computed tomography, GGO = ground-glass opacity.
Comparisons between CR and RA at baseline
For patients with CT abnormalities, there were 41% patients with CR and 59% patients with RA (Fig. 1). The median age of patients with RA was significantly larger than those with CR (58 [IQR, 47–66] years vs. 41 [IQR, 31–58] years, P < 0.001) (Table 1). Regarding laboratory findings, levels of IL-6 differed between the two groups; patients with RA had significantly higher level of (8.90 [IQR, 6.03–15.25] pg/mL vs. 6.65 [IQR, 3.38–11.35] pg/mL, P = 0.014) than those with CR (Table 2). On the CT examinations at baseline, the detection rates of interlobular septal thickening (46% vs. 20%, P = 0.003) were significantly higher in patients with RA (Table 3).
The age ≥ 47 years, presence of interlobular septal thickening and IL-6 ≥ 5.85 pg/mL were the independent risk factors for residual pulmonary abnormalities at 1 month after symptom diagnosis (OR = 4.668, 3.596 and 2.720, respectively; P < 0.050 for each comparison) (Figs 5, 6, and Supplementary Table 2). But the level of IL-6 showed no correlations with CT score of patients with RA (spearman r = 0.108, P = 0.374) (Supplementary Fig. 1).
Comparisons between patients with and without deterioration of RA group
No significant differences in all the demographics and clinical characteristics, and laboratory parameters at baseline were observed between the two groups (Supplementary Tables 3 and 4). On the CT examinations at baseline, the number of involved lung lobes (2 vs. 4, P = 0.005) and CT score (2 vs. 4, P = 0.004) were significantly lower in patients with deterioration (Supplementary Table 5). Furthermore, less consolidation (29% vs. 54%, P = 0.028) but more parenchymal bands (29% vs. 8%, P = 0.024) were observed in patients with deterioration (Supplementary Table 5).
Radiological changes of RA from baseline to 1-month follow-up
Over time, predominant GGOs (100%) remain the most common CT abnormalities in patients with residual CT abnormalities, without statistically significant changes at 1 month (P = 1.000). And consolidation, interlobular septal thickening and pleural involvement significantly decrease over time (19% vs. 42%, P = 0.010, 22% vs. 46%, P = 0.004 and 7% vs. 31%, P < 0.001, respectively) (Table 3 and Fig. 4). The detection rate of both subpleural and peribronchovascular distribution was significantly higher after 1 month (18% vs. 1%, P = 0.002). But there were no significant changes in the number of involved lung lobes (3 [IQR, 1–5] vs. 4 [IQR, 2–5], P = 0.308) and total CT score (3 [IQR, 1–5] vs. 4 [IQR, 2–5], P = 0.068) from baseline to 1 month (Table 3 and Fig. 4).
DISCUSSION
The risk factors and short-term changes for radiological abnormalities in omicron infected patients are unknown. In this multi-center retrospective study, we identified a group of patients with CT abnormalities at baseline, including patients with CR and RA at 1-month follow-up, and a group without CT abnormalities. We demonstrated that age ≥ 50 years, BMI ≥ 23.87, DAV ≥ 81 days, LY count ≤ 1.21 × 10⁻⁹/L, IL-6 ≥ 10.05 pg/mL, and IgG ≤ 14.140 S/CO were independent risk factors for radiological abnormalities at baseline. And compared with the patients with CR, patients with RA showed a statistically high incidence rate of interlobular septal thickening and IL-6 ≥ 5.85 pg/mL. Additionally, there were no significant differences in radiological abnormalities between baseline and 1-month follow-up.
In the present study, abnormal CT findings were identified in 46% omicron infected patients at baseline. Similar to previous studies, bilateral subpleural GGOs with partial consolidation were the most frequent CT findings at baseline.10111422 But these findings were different with previous study, in which reported that the omicron SARS-COV-2 variant showed more nontypical and peribronchovascular pneumonia than the delta variant.2324 We found that age greater than 50 years old, larger BMI, longer DAV, lymphopenia, higher IL-6 level, and lower IgG level were independent risk factors for radiological abnormalities at baseline. Sun et al.25 have shown that the percentage GGO and consolidation were significantly correlated with LY count in severe patients, and lymphopenia has been identified as a prognostic factor for COVID-19.26 But we found no significant correlation between LY count and CT score, because a large number of mild patients were included in our study. Several mechanisms have been suggested to explain lymphopenia, including cytokine storm, the damage to the cytoplasmic component of the LYs, and the direct attack on lymphatic organs by SARS-CoV-2 viral particles.10222527 And higher IL-6 level is the independent risk factor for both CT abnormalities and residual lesions. The present study finding was consistent with that of a previous report, in which CT score showed significant positive correlations with levels of IL-6.2829 Recent data have indicated that the high concentrations of IL-6 in COVID-19 patients due to cytokine storm was related to pulmonary inflammation, extensive lung damage, and even multiple organ failure.2830 Moreover, basic research confirmed the increased serum levels of IL-6 may take part in the induction of lymphopenia through inducing apoptosis in T cells.2731 According to the findings of the previous study, vaccine effectiveness was lower for the omicron variant than for the delta variant, and the vaccine effectiveness reduced over time from 75.1% after 2 to 4 weeks to 14.9% after 25 or more weeks.32 Moreover, the IgG levels in the breakthrough infections group rapidly increased due to a quick immune response generated by IgG+ memory B cell in response to vaccination.3334 Therefore, it can explain why longer DAV and lower IgG levels increased the potential risk for radiological abnormalities at baseline.
In the present study, residual CT abnormalities were identified in 59% of omicron infected patients at a 1-month follow-up. We found that the presence of interlobular septal thickening was the other independent risk factor for residual radiological abnormalities. With the limited follow-up period for our study, we avoided radiological terms such as “reticular pattern” associated with lung fibrosis; instead, we used the terms “interlobular septal thickening.” Previous studies had found that consolidation may wane and interstitial septal thickening may emerge during the absorption stage of the first two weeks of infection. However, these abnormalities improved three months after cure and discharge without residual pulmonary interstitial fibrosis.10121435 But other studies found that the interstitial septal thickening was more common in severe patients, and did not resolve fully in 24% of patients at 12 months after discharge, which was potentially consistent with evolving fibrosis.103637 In our study, at the 1-month follow-up, the majority of patients presented with GGO, and patients with interlobular septal thickening reduced significantly. The reason for this result is that fluid, fibrous or cellular infiltration involved the interstitial of alveolar walls and could cause pulmonary interstitial thickening, and the sign could be seen in the early stage of COVID-19 and completely disappear with the improvement, which is not equal to fibrosis.3839 Compared to the time of baseline, the detection rate of both subpleural and peribronchovascular distribution was significantly higher after 1 month in our study. This may be caused by some patients with disease progression. Our study found that consolidation, interlobular septal thickening, and pleural involvement significantly improved over time, whereas GGOs and parenchymal bands tended to increase after 1 month, but without significantly different. After 1 month, the total CT score and the number of involved lung lobes showed no significant difference from those at baseline. But for RA group, the patients with less consolidations and more parenchymal bands at baseline could progress on CT score after 1 month. According to previous studies,1214 CR mainly occurred in the first 3 months and more severe acute disease was linked with CT abnormalities at 3 months, but after 3 months, residual lesions became increasingly persistent with insignificant decrease in total CT score. Another meta-analysis literature also had described those inflammatory changes such as GGOs and consolidations reduced to 44% at a median follow-up of 3 months, with the timing of follow-up strongly associated with estimates of inflammatory sequelae.16 More than that, the CT score has been shown to be correlated with pathologic specimens and identified as a marker for disease severity and prognosis.40 For these reasons, reducing follow-up chest CT scans during the first month may be considered for these patients at high risk for the residual CT abnormalities.
This retrospective investigation has several limitations. First, our studies mainly predict the risk factors according to baseline information without dynamic characteristics analysis because the follow-up period was relatively short. Further long-term follow-up studies are required to determine the evolution of the identified pulmonary RAs. And future studies of the effects of continuous laboratory markers monitoring on radiological outcomes during convalescence would be welcome. Another limitation of our study is that patients were not divided according to severity because of the large proportion of mild patients in this pandemic. And most of patients have no pulmonary function tests. Last, although this study was performed at multiple organizations, the timing of the research conducted by each institution is different, and rigorous multicenter studies are needed for further verification of our findings. Strengths of our study include the follow-up study of omicron infected patients during its first pandemic in China, the inclusion of relatively complete clinical and radiological information at baseline, and the use of baseline characteristics to predict radiological outcomes at 1 month and the investigation of changes in radiological abnormalities in the early convalescence to provide evidence to make optimal first follow-up plans.
We demonstrated that age ≥ 50 years, BMI ≥ 23.87, DAV ≥ 81 days, LY count ≤ 1.21 × 10⁻⁹/L, IL-6 ≥ 10.05 pg/mL, and IgG ≤ 14.140 S/CO were independent risk factors for radiological abnormalities at baseline, and especially the presence of interlobular septal thickening and IL-6 ≥ 5.85 pg/mL were the independent risk factors for residual CT abnormalities at 1 month. For the patients with residual pulmonary abnormalities, we found that radiological changes were not statistically significant during the early convalescence. Therefore, a longer follow-up interval in the early convalescence should be considered for these patients who have risk factors for residual CT abnormalities. Further studies are needed to identify the exact follow-up interval for different patients.
 XML Download