

 PDF
PDF Citation
 Print
Print


INTRODUCTION
Obstructive sleep apnea (OSA) is a disease characterized by repeated obstruction of the upper airway during sleep, leading to intermittent oxygen desaturation and frequent arousal. Patients often experience excessive daytime sleepiness, poor cognitive function, and impaired quality of life.1 Patients who remain untreated for long periods of time have an increased risk of multiple health-related outcomes, including cardiovascular disease, stroke, and death from all causes.2 OSA is a significant and growing public health problem, and is estimated to affect 13–33% and 16–19% of men and women, respectively.3 However, the majority of patients with OSA do not receive timely diagnosis and treatment.4
The gold standard for the diagnosis of OSA is polysomnography (PSG). The examinee must spend an entire night in the hospital with a sleep specialist monitoring them while they sleep. Then, the PSG data are scored manually by the specialist according to the American Academy of Sleep Medicine guidelines.5 Hence, PSG is not suitable for massive screening and/or repeated measurements of OSA. Considering night-to-night variability,67 PSG is limited for diagnosis as well as continuous monitoring for effectiveness during treatment.
Various less complicated sleep diagnostic devices have been developed, with advantages of low prices and simple installation. These devices are portable and can be used at home without medical support. Systems developed in the context of OSA diagnosis use nasal airflow and/or oxygen saturation as parameters.89 However, these measurement tools have some intrinsic limitations since mouth breathing or incorrect positioning can cause signal loss.
Measurable heart rate variability (HRV) from single lead electrocardiogram signals reflects cardiac autonomic activity and can be used to evaluate quantitative changes between normal heartbeats.10 The association between OSA and increased sympathetic nervous system activity of HRV has been well documented since the clinical significance of HRV was introduced firstly in 1965.1112 Recently, further studies on the correlation between HRV factors and PSG indices have been conducted.1314 Currently, various devices are commercially available that provide heart rate monitoring, such as smartwatches, consumer sleep wearables, and adhesive electrocardiographic monitor patches. Such devices create the possibility of evaluating sleep-disordered breathing status of patients by measuring HRV using a heart rate monitor.
The present study aimed to develop binary classifiers of OSA based on HRV parameters using several machine learning algorithms. This study also aimed to verify the feasibility of using HRV for OSA prescreening and treatment monitoring in a large Korean population.
METHODS
Study participants
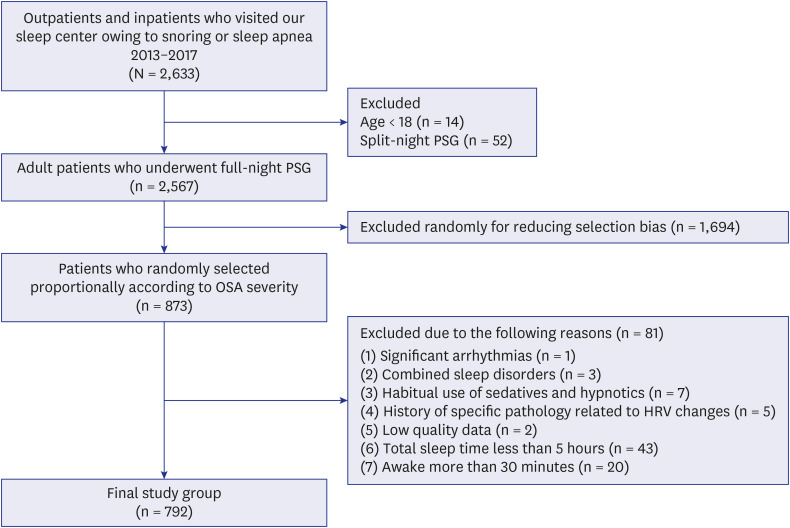
We retrospectively reviewed outpatients and inpatients who visited our sleep center owing to snoring or sleep apnea between January 2013 and December 2017. Adult patients, aged ≥ 18 years were included in this study. We excluded patients who underwent split-night PSG. After reviewing apnea-hypopnea index (AHI) scores, we randomly allocated patients to non-OSA and mild, moderate, and severe OSA groups proportionally to reduce selection bias. Then, we excluded subjects with any of the followings: 1) significant arrhythmias; 2) sleep disorders such as insomnia or narcolepsy; 3) inveterate use of sedatives and hypnotics; 4) specific conditions related to HRV changes (i.e., myocardial disease, diabetic neuropathy, or heart transplantation); 5) low quality data (artefacts > 20% of total sleep time); 6) total sleep time < 5 hours; and 7) awake for > 30 minutes from midnight–5 AM. A flow chart of the participant selection process is summarized in Fig. 1. All participants underwent in-laboratory, full-night PSG (Embla® N7000, Neurolite Advanced Medical Solutions, Belp, Switzerland). The anthropometric data on the subjects were reviewed.
Fig. 1
Flow chart of participant selection process. Data on outpatients and inpatients who visited our sleep center due to snoring or sleep apnea between 2013 and 2017 were collected. Patients who were under 18 years old and underwent split-night polysomnography were excluded. To reduce selection bias, patients were randomly allocated proportionally according to OSA severity. The final study group was selected by excluding additional patients with factors likely to influence the classifying performance for OSA using heart rate variability parameters.
HRV = heart rate variability, OSA = obstructive sleep apnea, PSG = polysomnography.
HRV analysis
HRV was measured using exported electrocardiogram data and commercially available PSG software (Embla® RemLogic™ 3.0 HRV analyzer; Neurolite Advanced Medical Solutions). This methodology was described in our previous study.15 Calculations of the time- and frequency-domain parameters were performed according to standard methods for HRV measurements.10 We only analyzed the electrocardiogram signal from midnight–5 AM to maintain consistency for comparisons. Therefore, the AHI was measured again from midnight–5 AM. The electrocardiogram signals were interpolated and resampled at 5.0 Hz. Normal-to-normal (NN) heartbeat intervals > 2,400 ms and < 400 ms were omitted. We used five time-domain and six frequency-domain measures in the present study. The time-domain parameters were as follows: 1) average NN interval (all intervals between adjacent QRS complexes); 2) standard deviation of the NN interval; 3) square root of the mean of the squared differences of adjacent NN intervals; 4) number of pairs of adjacent NN intervals more than 50 ms, and 5) the rate of pairs of adjacent NN intervals more than 50 ms among the total number of NN intervals. The frequency-domain parameters were as follows: 1) total power (variance of all NN intervals); 2) low frequency (LF; 0.04–0.15 Hz); 3) high frequency (HF; 0.15–0.4 Hz); 4) LF/HF ratio; 5) normalized LF (LF normalized units [nu]; LF / [LF + HF] × 100), and 6) normalized HF (HFnu; HF/[LF + HF] × 100). Frequency-domain measures were yielded as the average of the values calculated every 5 minutes.
The HRV measures according to OSA severity are presented as the mean ± standard deviation, and were compared by one-way analysis of variance using SPSS software (version 22.0, IBM Corp., Armonk, NY, USA). Turkey, Bonferroni or Dunnett T3 test were used for post-hoc comparisons. P values < 0.05 were considered statistically significant.
Development of binary classifiers of OSA
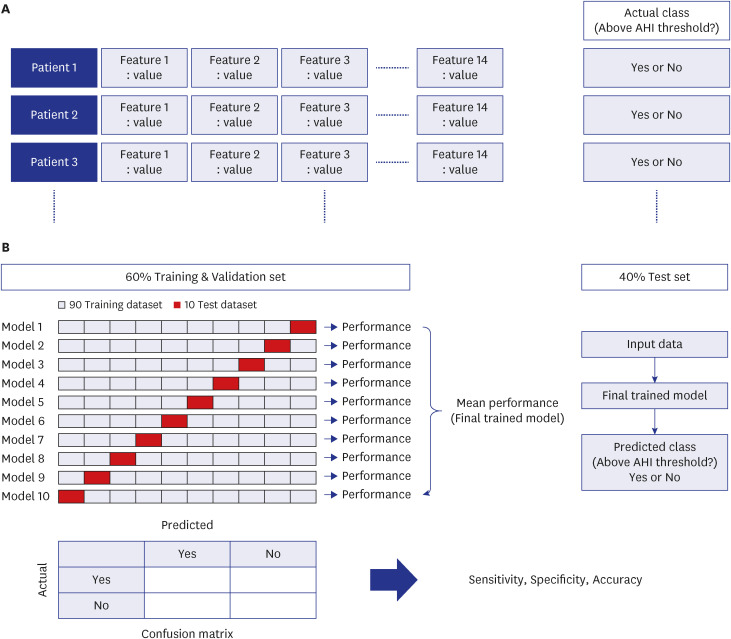
A model of OSA classification was constructed using 14 features and actual class according to AHI threshold (Fig. 2A). Output was the predicted class using estimated AHI scores. The 14 features included age, sex, body mass index (BMI), and the 11 HRV measures. We built the classifying model using logistic regression, random forest, support vector machine, and multilayer perceptron algorithms in a free machine learning software (Weka; University of Waikato, Hamilton, New Zealand).16 Sixty percent of participants were randomly selected for the training and validation sets while the other forty percent were designated as the test set. The difference between classes in the training set was adjusted using the Synthetic Minority Oversampling Technique in Weka. Validation was conducted by applying 10-fold cross-validation. The enrolled subjects were splited randomly into 10 subgroups. One subgroup was preserved for validation of the prediction model. The other nine subgroups were served for the training set. The cross-validation process was repetitively conducted 10 times (10-fold) with all 10 subgroups. This produced 10 evaluation results, which were then averaged. The learning algorithm was then applied a final (11th) time in the whole data set to gain the final model.16 Ultimately, the test set was included in the final training model (Fig. 2B). Output was expressed as a confusion matrix and area under the receiver operating characteristic curve (AUC).
Fig. 2
Study framework of machine learning process. (A) Fourteen features including age, sex, body mass index, and 11 measures of heart rate variability were used in the machine learning process for binary classification of obstructive sleep apnea by predicting the apnea-hypopnea index score. (B) Sixty percent of the data was used for training and a 10-fold cross-validation process. The remaining forty percent of data was used for the final training model. The classifying result was expressed as a confusion matrix. Sensitivity, specificity, and accuracy were calculated by the confusion matrix.
AHI = apnea-hypopnea index.
The performance outcomes of the machine learning classifiers were mainly evaluated by sensitivity, specificity, and accuracy. The AUC was also presented to assess the performance of the classifiers. All results were extracted from the test set.
RESULTS
General patient characteristics and HRV parameters
A total of 792 participants (651 men and 141 women) with a mean age of 55.1 ± 12.6 years were included in the study. The mean BMI and AHI score was 25.9 ± 3.5 kg/m2 and 22.9 ± 19.2, respectively. Participants were classified according to AHI score as follows: 124, normal (AHI < 5); 223, mild OSA (5 ≤ AHI < 15); 221, moderate OSA (15 ≤ AHI < 30); and 224, severe OSA (AHI ≥ 30). General and polysomnographic characteristics are summarized in Table 1. The means and standard deviations of the 11 HRV parameters according to OSA severity are presented in Table 2. The HRV parameters presented a significant difference according to OSA severity except for square root of the mean of the squared differences of adjacent NN intervals, number of pairs of adjacent NN intervals more than 50 ms, and rate of pairs of adjacent NN intervals more than 50 ms among the total number of NN intervals (P < 0.05). Post-hoc analyses were performed on HRV variables showing significant differences in Table 2. The total power, LF, LF/HF ratio, and LFnu values increased with OSA severity. The average NN interval, HF, and HFnu showed a decreasing tendency as the severity of OSA increased.
Table 1
General and polysomnographic characteristics
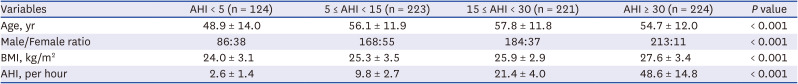
Table 2
Heart rate variability characteristics according to obstructive sleep apnea severity
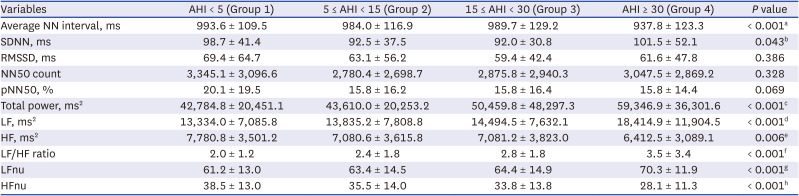
AHI = apnea-hypopnea index, NN = normal to normal, SDNN = standard deviation of NN intervals, RMSSD = square root of the mean of the squared differences of adjacent NN intervals, NN50 count = number of pairs of adjacent NN intervals more than 50 ms, pNN50 = rate of NN50 in the total number of NN intervals, LF = low frequency, HF = high frequency, LFnu = LF power in normalized units, HFnu = HF power in normalized units.
Post-hoc analyses. a,d,gGroup 4 vs. Group 1, 2 and 3 (all P < 0.001); bGroup 2 vs. Group 4 (P = 0.002); cGroup 4 vs. Group 1, 2 and 3 (P < 0.001, P < 0.001 and P = 0.004); eGroup 1 vs. Group 4 (P < 0.001); fGroup 4 vs. Group 1, 2 and 3 (all P < 0.001), Group 1 vs. Group 3 (P = 0.005); hGroup 4 vs. Group 1, 2 and 3 (all P < 0.001), Group 1 vs. Group 3 (P = 0.01).
Comparison of classifying performance among models
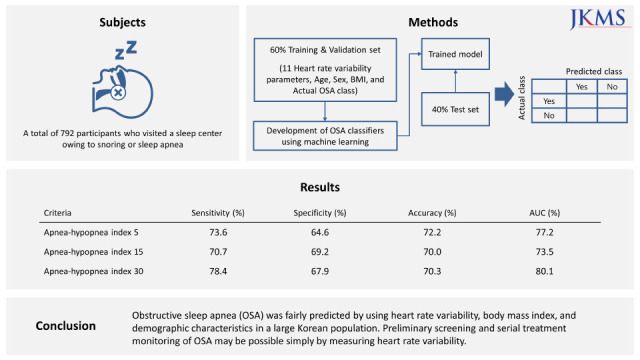
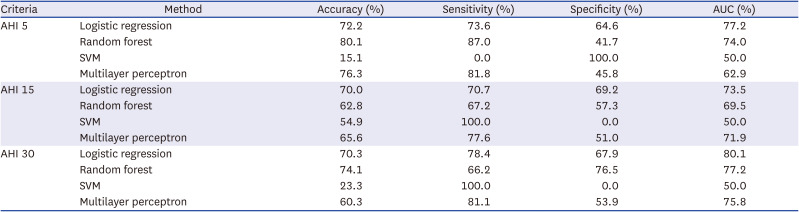
The classifying performance results derived from four algorithms with the AHI threshold for binary classification defined as 5, 15, and 30, are summarized in Table 3. When the AHI criterion was 5, logistic regression showed the best performance. The sensitivity and specificity of the model were 73.6% and 64.6%, respectively. The accuracy and AUC of the model were 72.2% and 77.2%, respectively. When the AHI criterion was 15, the best classifying model was also logistic regression. The sensitivity and specificity of the model were 70.7% and 69.2%, respectively. The accuracy and AUC of the model were 70.0% and 73.5%, respectively. When the AHI threshold criterion reached 30, a model using logistic regression showed the best classifying results as follows: sensitivity, 78.4%; specificity, 67.9%; accuracy, 70.3%; and AUC, 80.1%. The logistic regression model using the AHI criterion of 30 showed the best classifying performance among all models.
Table 3
Classification performances
DISCUSSION
In this study, OSA was fairly predicted using age, sex, BMI, and time- and frequency-domain HRV variables in a large Korean population. The binary classification sensitivity of the best performing model was over 70% in all AHI criteria. In particular, it showed better performance with 78% sensitivity in discriminating severe OSA. As the purpose of this study was to evaluate the use of HRV in OSA prescreening rather than to develop an accurate diagnostic tool as an alternative to PSG, we determined that HRV can be an intuitive and informative tool for large-scale preliminary screening to determine whether or not a patient should undergo additional PSG. Because it is binary classification, identifying the quantitative difference in terms of treatment effect can be difficult if the patient remains at the same level of OSA severity. However, considering the simplicity of this concept, measuring HRV to determine OSA severity, HRV has the potential to become a very powerful assessment tool. The present study was conducted on a larger scale (including 792 subjects) than previous studies that have investigated the relationship between HRV parameters and PSG indices.131718 Furthermore, considering that OSA severity differs by race,19 our study has significance in that it was conducted in an Asian population (in particular, Koreans) with physical characteristics that differ those of Westerners.
Our findings indicate that the best performing algorithm was logistic regression among the four machine learning algorithms. Since we aimed to confirm the feasibility of using HRV in OSA screening and treatment monitoring, the machine learning algorithm itself was not that important.
Several studies have attempted to differentiate OSA based on HRV that changes owing to sympathetic nervous system activity in hypoxic conditions. One study found that by using the difference between the daytime and nighttime standard deviations of the NN interval index, they could detect OSA with a sensitivity of 89.7% and 83% and a specificity of 98.1% and 96.5% in 91 and 52 subjects, respectively.17 However, this study was limited in that PSG and Holter monitoring, which is used to measure HRV, were not simultaneously performed. Since heart rate is affected by various external factors, measuring the heart rate at the different times may create problems with reproducibility. Another study attempted to calculate equations for HRV variables and PSG parameters such as AHI score, micro-arousal index, and oxygen desaturation index through multiple regression analyses in 25 patients with OSA.13 However, the statistical significance was only evaluated using one-way analysis of variance analysis, with no evaluation of prediction accuracy. In contrast, another study attempted to develop a model for OSA detection using machine learning methods based on HRV, pulse oxygen saturation, and BMI in 148 patients with OSA and 33 non-OSA participants.18 A proposed model showed high prediction accuracy. However, the accuracy was not reliable in that oxygen desaturation index was used as a predictor of AHI score, which is nearly the same thing as providing the correct answer in machine learning. Some studies have validated commercial fitness trackers, such as Fitbit, the Oura Ring and Whoop, which utilize HRV, by comparing them with PSG indices.202122 These studies compared sleep variables, such as sleep onset latency, total sleep time, sleep efficiency, and sleep stages. However, no studies have been conducted yet on the prediction of AHI score or assessment of OSA classifiers using such utilities. Moreover, further studies on the correlations between HRV parameters and PSG diagnostic indices such as AHI score have been conducted recently.14 However, few studies have been conducted on a model of binary classification for OSA severity by predicting AHI score using simultaneously measured HRV variables without the use of oxygen saturation levels.
Various methods for screening OSA have been introduced. The STOP-Bang questionnaire is one of the well-known sleep questionnaires to predict OSA. One study found that when total score was greater than 3, the probability for severe sleep apnea continued to increase from 31.3% (score 4) to 81.9% (score 8), while the probability for everything else (non-OSA, mild and moderate OSA) decreased.23 The questionnaire is probably the simplest way to screen for OSA without any cost or time. However, it can be difficult to obtain information other than that the probability of severe OSA increases as the score increases. Respiratory sounds during sleep may be used for prediction of OSA severity. In our previous study, a simple algorithm for prescreening of OSA on the basis of respiratory sounds recorded during PSG was developed.24 Accuracies of classification at AHI criteria of 5, 15, and 30 were 82.7%, 84.4%, and 85.3%, respectively. However, this modality needs to overcome technical issues such as noise cancellation. There may be restrictions on its application, for example, when a patient has a bed partner or a companion animal. In comparison, each method for screening OSA has its own strength and weakness.
When chronic intermittent hypoxia and sleep interruption are caused by OSA, the accumulation of oxidative stress and inflammatory responses, as well as increased sympathetic nervous system activity can occur.25 HRV reflects cardiac autonomic activity, which is a balance between sympathetic and parasympathetic nervous system activity. Regarding the frequency-domain parameters of HRV, LF activity reportedly reflects both sympathetic and parasympathetic nervous system activity, while HF has been correlated to parasympathetic nervous system activity.26 Therefore, the LF/HF ratio is regarded as the balance between sympathetic and parasympathetic nervous system activity, and has been linked with AHI scores in patients with OSA.11 LFnu and HFnu are considered markers of sympathetic and parasympathetic nervous system activity, respectively.26 Therefore, theoretically, the increased risk for OSA can be estimated using HRV analysis. In our study, the total power, LF, LF/HF ratio, and LFnu values increased with OSA severity. Conversely, when the OSA severity increased, the average NN interval, HF, and HFnu presented a decreasing tendency. From these results, a linear relationship can be inferred.
The development of predicting algorithms for OSA are important in several respects. First, if predictive models were applied to various electrocardiogram measuring devices such as smartwatches, wearable sleep devices, and adhesive patches, more patients would get the chance to prescreen their OSA at home on a daily basis. Indeed, considering the aforementioned limitations of PSG, many OSA patients are underdiagnosed despite the high prevalence. Individuals with recurrent snoring, daytime drowsiness, or poor quality of sleep should see a doctor firstly and undergo PSG. Ambulatory at-home monitoring devices have similar limitations in that a symptomatic patient must visit a hospital with the appropriate equipment at first. Second, given the night-to-night variability in OSA severity, this kind of prediction algorithm may assist clinicians with a more accurate diagnosis beyond the weaknesses of PSG and home testing devices by replacing repetitive tests without additional economic burden. Third, a prediction algorithm for OSA severity may be useful for verifying the therapeutic effects of OSA treatments such as mandible advancement devices or positive airway pressure in real time. Moreover, serial monitoring of the therapeutic results of OSA surgery are feasible using HRV. Conversely, such treatment effect analysis may serve as the basis for determining how to treat OSA in the future. Ultimately, early diagnosis and decisions regarding the most effective treatment modality reduce the social and economic burden of OSA since OSA is a risk factor for multi-organ diseases, such as neurovascular, cardiovascular, and metabolic diseases.
This study had some limitations. First, we included a relatively small number of subjects without OSA because the participants were patients who visited a tertiary hospital for snoring or sleep apnea. Therefore, we tried to eliminate any numerical imbalance between classes by randomly selecting patients with mild, moderate, and severe OSA to proportion. In addition, we used the Synthetic Minority Oversampling Technique, a general method often used to solve this type of problem in the machine learning process. Second, our binary classifier may not cover all sleep stages because we only analyzed data between midnight and 5 AM. Heart rate varies by sleep stage, although we did not consider sleep stages in this study. Since rapid eye movement sleep generally occurs 90 minutes after sleep onset, it would be better to measure HRV after the onset of deep sleep. If the sleep stage were detectable, HRV analysis could begin after one sleep cycle. However, since HRV can vary by time period because of circadian rhythms, studying measurements by particular time period may have an advantage from a certain perspective. Third, considering the characteristics of the machine learning process, classifying its performance may have been affected by the distribution of patients in the training set. Indeed, there are many more people without OSA in the general population; therefore, discrepancies between research results and the real world can occur, although this can be corrected later through real-world validation. Fourth, the external validation was not performed. Since the present study was conducted in a single institution, there may be potential bias. It can be supplemented through future multi-institutional studies. Finally, there are hurdles to overcome in order to apply our classifying model to multiple devices. Since there is difference in the electrode for each device, validation is required to predict AHI. In the future, studies which comparing HRV of PSG and HRV of a sleep device or a smart watch are needed by wearing the multiple devices and implementing PSG simultaneously for application of our classification model.
In conclusion, OSA severity was fairly predicted using HRV parameters, BMI, and demographic characteristics in a large Korean population. The binary classification sensitivity for OSA was over 70% in each AHI criterion. The best binary classification model showed performance with 78% sensitivity in discriminating severe OSA. This study may have high value regarding the feasibility of HRV for OSA prescreening and continuous monitoring of treatment effects. Severe OSA may possibly be prescreened simply by measuring HRV. Further real-world validation studies may lead to improvements in the classifying performance of HRV for OSA.
 XML Download