

 PDF
PDF Citation
 Print
Print


INTRODUCTION
Vertebral fractures (VFs) are one of the most prevalent types of fractures and are becoming increasingly common in an ageing population.1234 Over 700,000 VFs occur in the United States each year, with more than 40% of women experiencing at least one VF during their lifetime.5 VFs cause a lower quality of life and increased social expenses, particularly in older adults with osteoporosis.6 As a result, it is critical to identify and improve the risk factors for VFs.
Previous research has identified several risk factors for osteoporosis, such as weight, body mass index (BMI), drinking, smoking, and physical activity.789 In addition to bone mass density (BMD), BMI and body weight are the most important parameters in the World Health Organization (WHO) Fracture Risk Assessment tool.1011 According to previous studies, BMI is either a risk or a protective factor of bone fractures.121314 It has been found that decreased activity and muscular function in obese people leads to frequent falls, which contributes to an increase in fractures.14 On the other hand, a lower BMI has been linked to an increased risk of muscle loss, known as sarcopenia and osteoporosis, leading to an increase in the risk of fractures.1213 However, only a few studies have investigated the relationship between low body weight and VFs.15 In addition, there is no study on the incidence of VFs in relation to the status change of low body weight, nor is there a large-scale study in East Asia examining the association between low body weight and VFs. Using data from the population-based, nationwide Korean National Health Insurance Service (KNHIS) database, we previously studied the association between the severity of underweight and all types of fractures,16 as well as the relationship between changes in underweight status and hip fractures.1718
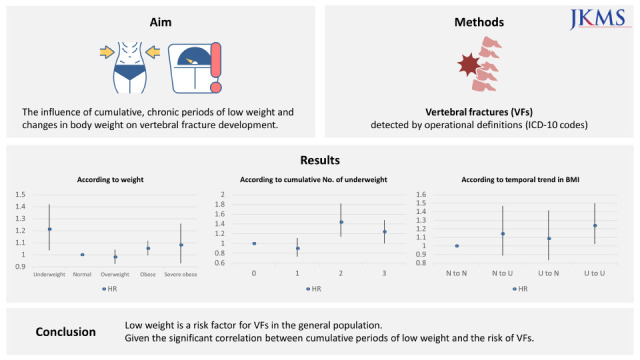
To the best of our knowledge, no study has used a nationwide population-based database to investigate the impact of being underweight on VFs. The purpose of this study was to investigate how being underweight affects the incidence of VFs, as well as the influence of cumulative, longitudinal periods of low BMI and changes in body weight on VF development.
Go to : 
METHODS
Data source and study design
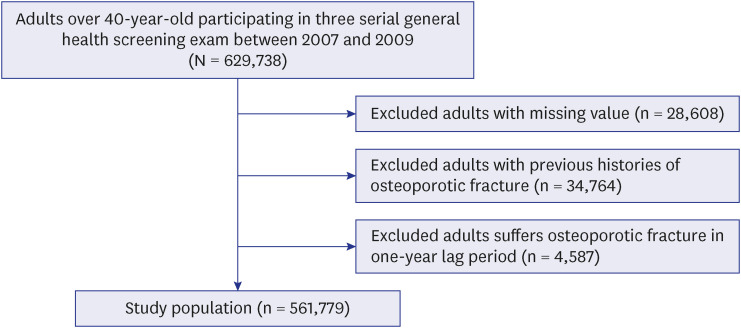
We used nationwide, population-based KNHIS database. The KNHIS database includes all Korean population health information, such as patient diagnoses (International Classification of Disease, 10th revision [ICD-10]), prescriptions, and procedures. Therefore, this database contains all medical information for the entire Korean population (approximately 50 million people). Furthermore, all Korean adults over the age of 40 years attend general health screening once every two years.19 In this health screening data, not only are regular health screening records, such as anthropometric measurements, lifestyle questionnaires, and basic laboratory results recorded, but also socioeconomic information, prescription records, hospitalization records, outpatient records, and the date of death of the insured Korean population. Based on this database, we created a longitudinal cohort using health screening data from January 1, 2002, to December 31, 2017, and extracted data on people over the age of 40 years who underwent three serial general health screenings between January 1, 2007, and December 31, 2009. To eliminate the effects of previous fractures, we excluded people who had a history of osteoporotic fractures before the health screening date. A one-year lag period after health screening was also applied to increase the effect of being underweight. Individuals with missing data values were excluded. Ultimately, 561,779 participants were included in this study (Fig. 1). In this cohort, we followed up instances of VFs after health screening until the cohort termination date or death. A VF was defined as a fracture for which a claim for hospitalization or outpatient treatment was received by fracture code after the general health-screening date.
Evaluation of underweight and VF
Weight and height were extracted from the results of the general health screening. The BMI was calculated as the ratio of weight (kg) to height (m) squared (kg/m2). Based on the WHO Asia-Pacific regional guidelines, BMI was classified as underweight (< 18.5 kg/m2), overweight (≥ 23.0 kg/m2), obese (≥ 25.0 kg/m2), and severely obese (≥ 30.0 kg/m2), respectively.2021
During each health screening, the patients’ underweight status would be noted. The number of underweight individuals was defined as the cumulative number of underweight patients diagnosed at each health screening. To estimate the influence of temporal trends in BMI changes on VFs, we compared the diagnosis of an underweight status at the first health screening with that at the third (last) health screening. The study population was divided into four groups according to changes in underweight status: underweight to underweight (U-to-U), underweight to non-underweight (U-to-N), non-underweight to underweight (N-to-U), and non-underweight to non-underweight (N-to-N).
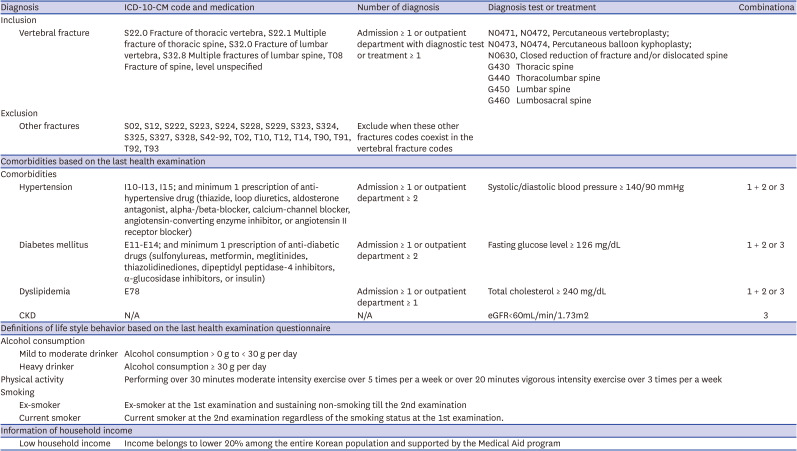
To identify VFs, we used ICD-10 codes (S22.0 Fracture of thoracic vertebra, S22.1 Multiple fracture of thoracic spine, S32.0 Fracture of lumbar vertebra, S32.8 Multiple fractures of lumbar spine, T08 fracture of spine, level unspecified) to find the claims in the database.222324 VF was defined as each fracture code with admission, repeated outpatient clinic claims, or emergency clinic visits.
Covariates and measurements
Baseline demographic data in this study were defined as that in the last health screening data. These basic characteristics included socioeconomic data, laboratory results (total cholesterol, glucose, blood pressure), answers to lifestyle questionnaires (regular exercise, smoking, alcohol drinking), anthropometric measurements (height, weight, waist circumference), and medical histories, which included hypertension, diabetes, dyslipidemia, and chronic kidney disease.25 Regarding medical history, comorbidities were described if a record confirmed this at the health screening or treatment was received in the past medical claim data.
Smoking status was classified as non-smoker, past smoker, or current smoker. Alcohol consumption was classified as non-drinkers, mild drinkers (less than 30 g/day), or heavy drinkers (more than 30 g/day) according to the amount of alcohol consumed per day. Regular exercise was defined as the level of physical activity that included at least 20 minutes of vigorous physical activity over three or more days per week or 30 minutes of moderate to intense physical activity five or more days per week. Income status was divided into low as income in the bottom 20% of the insured’s annual income, and normal. The ICD-10 codes used in this study are listed in Appendix 1.
Statistical analysis
Baseline characteristics of this study population are presented as mean ± standard deviation or counts and percentages in parentheses according to the cumulative number of underweight patients. The incidence rate (IR) was defined as the IR per 1,000 person-years (PY). The risk of VF development was analyzed using Cox proportional regression analysis to calculate the hazard ratios (HRs) and 95% confidence intervals (95% CIs) between VFs and the number of underweight patients. To reduce the bias of co-variates, we analyzed the HRs for unadjusted and three adjusted models: Model 1 was adjusted for age and sex; Model 2 was adjusted for age, sex, and other environmental factors such as smoking, alcohol consumption, physical activity, and household income; Model 3 was fully adjusted for age, sex, other environmental factors (smoking, alcohol consumption, physical activity, and household income), and comorbidities (diabetes, hypertension, dyslipidemia, and chronic kidney disease). Subgroup analysis was performed based on several factors, including age (< 65 years, ≥ 65 years), sex, smoking, alcohol consumption, physical activity, and household income.
Statistical analysis was performed using the SAS software 9.3 (SAS Institute, Cary, NC, USA). Student’s t-test for continuous variables and the chi-square test for categorical variables were used, and two-tailed statistical significance was considered at P < 0.05.
Go to :
RESULTS
Baseline characteristics
The baseline characteristics of the adults according to the cumulative number of underweight participants at each health screening examination are summarized in Table 1. Of the 561,779 individuals included in this analysis, 545,824 (97.2%) were never diagnosed as underweight. Regarding those underweight, 5,354 (1.0%) people were diagnosed three times, 3,672 (0.7%) people were diagnosed twice, and 6,929 (1.2%) people were diagnosed once of the three screenings. Except for age, the baseline characteristics of individuals in the four groups who were never diagnosed, were diagnosed once, twice, and three times revealed statistically significant variations in all categories evaluated. Individuals in the underweight group were more likely than those in the non-underweight group to be current smokers, have no alcohol consumption, engage in regular physical activity, and have low household income, regardless of the duration the participant was underweight.
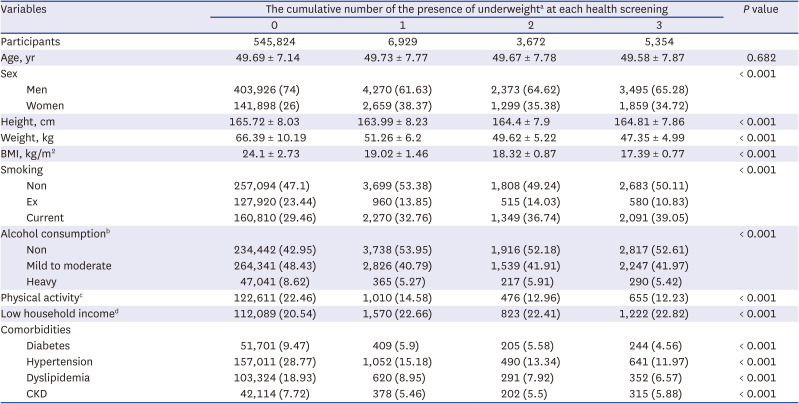
Table 1
Baseline characteristics of this study according to the cumulative number of the presence of underweight
Numeric parameters are expressed as mean ± standard deviation and categorical parameters are expressed as counts and percentages in parentheses.
BMI = body mass index, CKD = chronic kidney disease.
aUnderweight was defined as body mass index under 18.5 kg/m2.
bAlcohol consumption was divided into 3 categories; Non (no alcohol consumption), Mild (under 30g/day consumption), and heavy (over 30 g/day consumption).
cPhysical activity is defined as performing over 30 minutes moderate intensity exercise over 5 times per a week or over 20 minutes vigorous intensity exercise over 3 times per a week.
dLow household income is defined as total household monthly income belongs to lower 20% group among Korean entire population.
![]()
The incidence and risk of VFs according to BMI
The IR was 2.04/1000 PY in the underweight group. The unadjusted and adjusted HRs (models 1, 2, and 3) were also significantly higher in the underweight group. The fully adjusted HR (model 3) for VFs according to BMI were 1.213 (1.037–1.417), 0.982 (0.925–1.042), 1.053 (0.994–1.117), and 1.081 (0.929–1.259), respectively (Table 2).
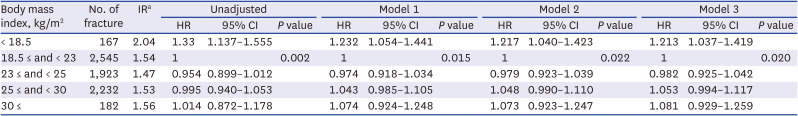
Table 2
The risk of vertebral fracture according to body mass index using Cox regression analysis
IR = incidence rate, HR = hazard ratio, 95% CI = 95% confidence interval.
aIncidence rate is defined as incidence rate per 1,000 person-year.
Model 1 was adjusted by age, and sex; Model 2 was adjusted by age, sex, and other environmental factors such as smoke, alcohol consumption, physical activity, household income; Model 3 was fully adjusted by age, sex, other environmental factors (smoke, alcohol consumption, physical activity, household income), and comorbidities (diabetes, hypertension, dyslipidemia, chronic kidney disease).
![]()
The incidence and risk of VFs according to the cumulative number of underweight
A total of 7,049 VFs were observed (1.2%). The IR of VFs was 1.53/1000 PY in the once diagnosed underweight group, 2.35/1000 PY in the twice diagnosed underweight group, and 1.98/1000 PY in the three times diagnosed underweight group, with the IR being greater in the underweight group overall. In contrast, there was no statistically significant serial increase in fractures according to the number of underweight diagnoses; nonetheless, it was significantly greater in the groups with two or more underweight diagnoses. In the multivariate-adjusted analysis, this correlation was statistically significant. Underweight individuals who were diagnosed only once, twice, or three times had an adjusted HR (Model 3) of 0.904 (0.731–1.117), 1.443 (1.140–1.827), and 1.256 (1.028–1.482) for VFs, respectively (Table 3).
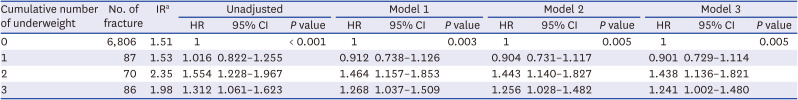
Table 3
The risk of vertebral fracture according to the cumulative number of the presence of underweight using Cox regression analysis
IR = incidence rate, HR = hazard ratio, 95% CI = 95% confidence interval.
aIncidence rate is defined as incidence rate per 1,000 person-year.
Model 1 was adjusted by age, and sex; Model 2 was adjusted by age, sex, and other environmental factors such as smoke, alcohol consumption, physical activity, household income; Model 3 was fully adjusted by age, sex, other environmental factors (smoke, alcohol consumption, physical activity, household income), and comorbidities (diabetes, hypertension, dyslipidemia, chronic kidney disease).
![]()
The risk of VF according to temporal trends in BMI changes
The IR was 1.51/1000 PY in the N-to-N group, 2.02/1000 PY in the N-to-U group, 1.72/1000 PY in the U-to-N group, and 2.05/1000 PY in the U-to-U group. After multivariate-adjusted analysis, adults in the U-to-U group had a significantly higher risk of VF (HR, 1.239; 95% CI, 1.022–1.502). Although the adjusted HR was higher in adults who were consistently underweight, there was no difference in those who experienced a temporal change in body weight (Table 4).
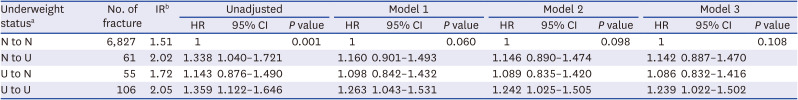
Table 4
The risk of vertebral fracture according to temporal trends in body mass index changes using Cox regression analysis
IR = incidence rate, HR = hazard ratio, 95% CI = 95% confidence interval, N = non-underweight (body mass index ≥ 18.5 kg/m2), U = underweight (body mass index < 18.5 kg/m2).
aTemporal changes of underweight status (first to 3rd health screening) are divided into four groups: non-underweight to non-underweight, non-underweight to underweight, underweight to non-underweight, and underweight to underweight.
bIncidence rate is defined as incidence rate per 1,000 person-year.
Model 1 was adjusted by age, and sex; Model 2 was adjusted by age, sex, and other environmental factors such as smoke, alcohol consumption, physical activity, household income; Model 3 was fully adjusted by age, sex, other environmental factors (smoke, alcohol consumption, physical activity, household income), and comorbidities (diabetes, hypertension, dyslipidemia, chronic kidney disease).
![]()
Subgroup analysis
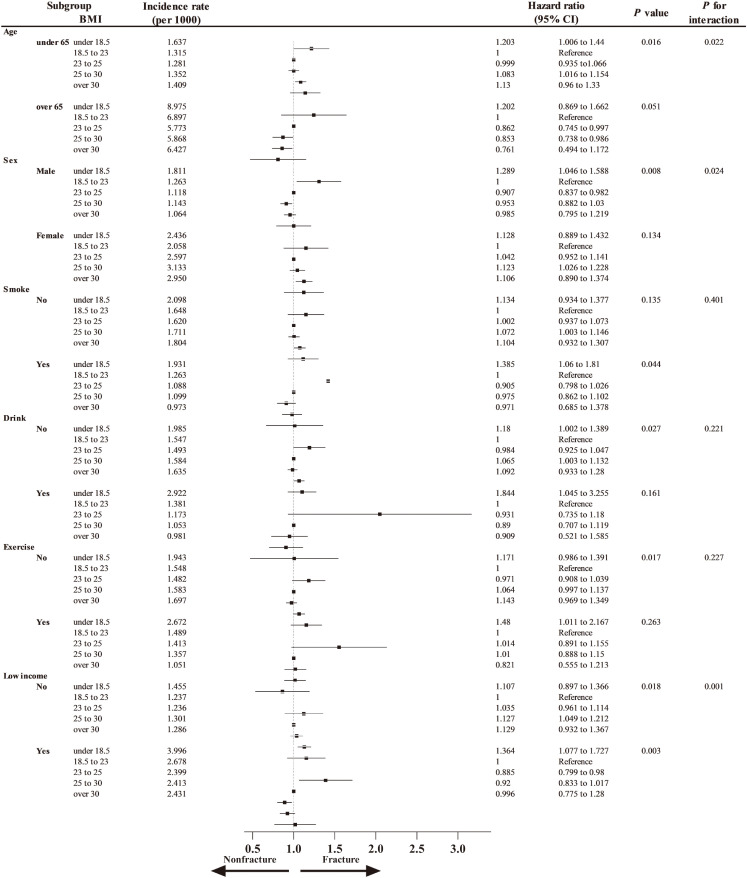
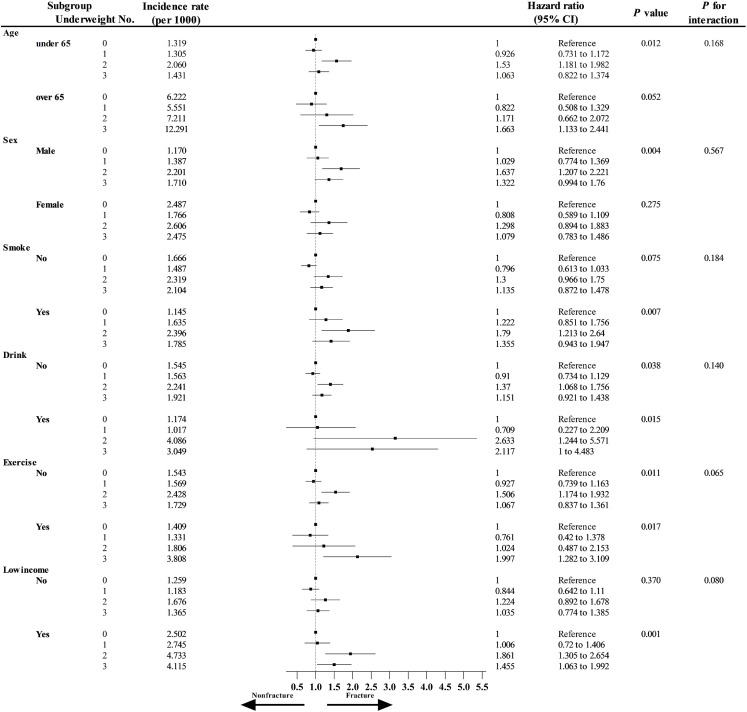
VFs were more likely to occur in underweight adults who were under the age of 65 (1.203; 95% CI, 1.006–1.440), men (1.289; 95% CI, 1.046–1.588), and low-income (1.364; 95% CI, 1.077–1.727) (Fig. 2). In the stratified analysis, none of the covariates had a statistically significant association with the risk of VFs in groups defined by the cumulative number of underweight diagnoses (P for interaction > 0.05) (Fig. 3).
Ethics statement
The study protocol was approved by the Institutional Review Board of Korea University Ansan Hospital (approval no. K2021-2601-001). The ethics committees of Korea University Ansan Hospital have waived the requirement to obtain informed consent as the register data analysed in this study are in anonymised and deidentified format. This study was performed in accordance with the tenets of the Declaration of Helsinki, and all research methods were carried out in accordance with appropriate regulations and guidelines.
Go to :
DISCUSSION
To the best of our knowledge, this is the first study to determine the risk of VFs associated with the cumulative burden of low body weight in a large nationwide population-based cohort study. Through various analyses, we confirmed the following: 1) Underweight status increased the risk of VFs. 2) The cumulative burden of being underweight increased the risk of VFs. 3) There was no increase in the risk of VFs if the cumulative burden of being underweight was small or if there was a temporal change in body weight. 4) Among several factors, under 65-year, male sex and low household income were significantly more affected.
Osteoporosis is a risk factor for fractures, particularly when combined with physical activity, smoking, alcohol consumption, and body weight.78 The relationship between fractures and body weight varies according to the location of the fracture. Weight gain is associated with a considerable reduction in hip fractures.26 VF research continues to be contentious, with studies indicating that being underweight is both a risk and protective factor for VFs.1327 However, there is no conclusive evidence of the association between low weight and VFs.
Although the mechanism by which low weight increases the frequency of VF is unknown, this study revealed that underweight is a risk factor for increased VFs. In humans, being underweight is often related to malnutrition, which is hypothesized to lead to osteoporosis.28 Malnutrition causes bone loss and, eventually, osteoporosis.2930 In addition, low BMI is highly associated with the development of sarcopenia. Previous research has shown that malnourished individuals are more prone to sarcopenia.31 Physical capacity and muscular function are diminished as a result of sarcopenia, resulting in falls that increase the likelihood of VF.3233 In conclusion, lower BMI is thought to be associated with lower BMD levels and decreased muscle strength. However, this study was a population-based study using the ICD-10 diagnostic code, and the actual skeletal muscle index and BMD scores of the patients could not be determined. Although this study cannot clearly elucidate the relationship between low BMI, BMD, and skeletal muscle index, the fact that low BMI is related to VFs was confirmed using the large population-based database.
Low body weight was investigated as a risk factor for VFs after controlling for several variables. In a further analysis, transient underweight status (cumulative number = 1) did not increase the risk of VF (HR, 0.901; 95% CI, 0.729–1.114). There was no increase in risk, even when changing from normal weight to underweight or from underweight to normal weight. In other words, it can be considered that VFs increase only when the body weight is continuously low. This suggests that being underweight does not increase fractures directly; rather, fractures occur as a result of low bone density or muscle loss following underweight.
In the subgroup analysis, the effect of being underweight was greater, especially those who were under 65 years of age, men, and who had low household income. Thus, the importance of being underweight as a risk factor for VFs varies with age, sex, and household income. Although the specific mechanism of VFs in young individuals remains unknown in this study, a possible explanation is that younger underweight individuals have quicker bone loss due to a relatively rapid change in metabolism compared to older individuals. The finding that underweight men had a greater risk of VFs than women after correcting for age is consistent with previous research indicating that men have a greater risk of fractures than women.534 Low household income is also associated with malnutrition, which may have contributed to the low BMI and skeletal muscle index, which may have led to an increase in fractures.
To our knowledge, this is the only study to evaluate the risk of VF in the underweight population using a nationwide database. The major strength of this study is that it used national health insurance data in which all citizens were enrolled. This is a large amount of data, and the database is maintained constantly. Consequently, it produces significant results that are representative of the real world. However, this study had several limitations. First, the T-scores of the BMD results could not be directly verified. Being underweight is thought to have had an effect on the BMD score, but the direct effect was unknown in this study. In addition, grip strength and muscle mass for analyzing sarcopenia could not be further analyzed. This limitation of further data analysis is due to the limitation of KNHIS database, which consists of only basic demographics, diagnostic, radiographic, and treatment codes. Second, it was difficult to determine the exact number of VFs. Because VFs are frequently asymptomatic or weak, some patients do not visit outpatient clinics or hospitals. Third, this study used a nationwide database from national health insurance services in one nation, so it is difficult to apply it to multiple ethnicities. Finally, because the diagnosis of VFs in this investigation was made using the fracture diagnostic code, we were unable to confirm that all VFs were accurately diagnosed. To identify VFs, an algorithm used in this study identical to that employed in prior studies was applied.222324 Validation studies are the best method to confirm the proposed algorithm of diagnostic codes.24 According to our recent study, the sensitivity was 62.5% and the positive predictive value of operational definition was 59.7%, which was lower than that of hip35 or wrist fractures,36 but higher than that of other VFs.37 To diagnose VFs as accurately as possible, we used a one-year lag time period after being diagnosed as underweight and excluded patients with previous VFs. Because this study used the most conservative algorithm, it is quite likely that the incidence rate of VFs was slightly underestimated, as previously stated.
This study investigated whether being underweight is an important factor that increases the risk of VF in the Korean population using a nationwide population-based cohort. The risk of VFs was particularly high among people who were persistently underweight, and men under the age of 65 and those with low household income had a higher risk of VFs. Therefore, patients with these risk factors require treatment to reduce the risk of VF.
Go to :
 XML Download