Journal List > Intest Res > v.17(2) > 1516081192

Okabayashi, Kobayashi, Saito, Toyonaga, Ozaki, Sagami, Nakano, Tanaka, Yagisawa, Kuronuma, Takeuchi, and Hibi: Individualized treatment based on CYP3A5 single-nucleotide polymorphisms with tacrolimus in ulcerative colitis

Abstract

Background/Aims

The pharmacokinetics of tacrolimus (TAC) is known to be largely influenced by single-nucleotide polymorphisms (SNPs) in CYP3A5. Patients starting TAC require careful dose adjustment, owing to the wide range of optimal dosages, depending on their CYP3A5 expression status. Here, we evaluated whether individualization of TAC dosages based on CYP3A5 SNPs would improve its therapeutic efficacy in ulcerative colitis.

Methods

Twenty-one patients were prospectively treated, with their initial dosage adjusted according to their CYP3A5 status (0.1, 0.15, and 0.2 mg/kg/day for CYP3A5*3/*3, CYP3A5*1/*3, and CYP3A5*1/*1, respectively). Their clinical outcomes were compared with those of patients treated with a fixed dose (0.1 mg/kg/day).

Results

The first blood trough level of CYP3A5 expressors, CYP3A5*1/*3 or CYP3A5*1/*1, and the overall rate in achieving the target blood trough level within a week in the individualized-dose group were significantly higher than those in the fixed-dose group (5.15±2.33 ng/mL vs. 9.63±0.79 ng/mL, P=0.035 and 12.5% vs. 66.7%, P=0.01). The remission rate at 2 weeks in the expressors was as high as that in the nonexpressors, CYP3A5*3/*3, in the individualized-dose group.

Conclusions

Individualized TAC treatment is effective against ulcerative colitis regardless of the CYP3A5 genotype.

INTRODUCTION

Ulcerative colitis (UC) is a chronic inflammatory disease of the colonic mucosa characterized by a relapsing-remitting course [1]. Approximately 25% of UC patients experience a severe flare-up during the course of the disease [2]. Although steroids are highly efficacious in treating severe UC, approximately 30% of patients do not respond, which may result in the need for colectomy [3].
Tacrolimus (TAC) is widely used as one of the salvage treatments for steroid-refractory UC [4-6]. It is a potent immunosuppressant that inhibits transcription of the interleukin 2 gene required for T cell activation, which suppresses inflammation in UC [7,8]. In the management of TAC treatment, therapeutic drug monitoring is crucial to maintain its efficacy and minimize drug-induced toxicity because of its narrow therapeutic range with significant interindividual variability in the required dosage to achieve suppression of UC inflammation [9-11]. Although several factors are involved in interindividual variability, genetic polymorphism of the metabolic enzymes or efflux pump for TAC is one of the most important factors and has a significant impact on its pharamacokinetics [12-16].
TAC is predominantly metabolized by cytochrome P450 (CYP) enzymes, that is, CYP3A4 and CYP3A5, and it is a substrate for the efflux pump ATP-binding cassette subfamily B member 1 that contributes to its absorption [17]. Genetic variability based on single-nucleotide polymorphism (SNP) is known to result in inconsistent blood trough levels and therapeutic efficacy of TAC [14-16,18]. Moreover, ethnic differences in the prevalence of these polymorphisms [12,13,19] and CYP3A5 SNP contribute significantly to the blood trough level of TAC in Japanese [14,19,20]. Short-term clinical remission rates in UC with CYP3A5 expressors, CYP3A5*1/*3 or CYP3A5*1/*1, was shown to be lower than the nonexpressors, CYP3A5*3/*3, because there is a delay in achieving the target blood trough level among CYP3A5 expressors [14]. Consequently, one of the important challenges in induction remission treatment with TAC in UC is the rapid achievement of the target blood trough level especially in patients with CYP3A5 expressors.
We hypothesized that determining individual CYP3A5 SNP before starting treatment with TAC may predict an appropriate TAC dosage for achieving the target blood trough level. Individualizing the initial dosage according to SNP may improve the early stages of disease course in UC, especially in patients with CYP3A5 expressors. The aims of this study were to first explore the appropriate TAC dosage in achieving the target blood trough level for each CYP3A5 SNP, and then evaluate prospectively whether individualizing the initial TAC dosage based on CYP3A5 SNP improves therapeutic efficacy in UC.

METHODS

From October 2013 to March 2018, the following 2 studies were performed consecutively at Kitasato University Kitasato Institute Hospital (Tokyo, Japan).

1. Standard Treatment Protocol

TAC was started at the dosage indicated below and the blood trough level was measured mostly between 48 and 72 hours, and then every 2 to 3 days until the target trough level was achieved. The TAC dosage was adjusted to produce the target blood trough level of 10–15 ng/mL for first 2 weeks and then reduced to maintain a blood trough level of 5–10 ng/mL [9,10]. In adjusting the dosage, subsequent TAC dosages were corrected using the following equation: (target blood concentration)/(measured concentration)×(current dosage).

1) Study 1: Exploring the Appropriate TAC Dosage to Achieve the Target Blood trough Level According to CYP3A5 SNP

From October 2013 to April 2014, the amount of required TAC dosages was retrospectively calculated based on ratio to reach a blood trough level of 10 ng/mL from a stable blood trough levels in rheumatoid arthritis and UC patients taking a stable TAC dosage. The dosages were indicated as milligrams of TAC corrected by body weight per blood concentration (mg/kg/day per ng/mL). All patients were analyzed for the variant of CYP3A5*3 (rs776746) using the TaqMan SNP assay method at our institution. The variant of CYP3A4*1B (rs2740574) was delivered to SRL, Inc. (Tokyo, Japan) and the gene was analyzed by fluorescence correlation spectroscopy [21]. The association between the required TAC dosages and the CYP3A5*3 variants were analyzed.

2) Study 2: Evaluating the Therapeutic Efficacy of Individualized Treatment Based on CYP3A5 SNP

(1) Patients and individualized treatment protocol

From October 2013 to April 2014, UC patients who have started induction remission treatment with fixed-dose (0.1 mg/kg/day) TAC were retrospectively enrolled. Consecutively, from May 2014 to March 2018, patients who required induction remission treatment with TAC were prospectively enrolled and received individualized treatment. The CYP3A5*3 variant was genotyped before starting treatment at our institution. Initial TAC dosages were set according to CYP3A5 SNP based on the results of study 1 and predetermined initial dosages for each genotype were conducted as follows. Treatment protocols except for initial dosage settings were as mentioned above. TAC was withdrawn within 3 months after starting treatment, bridged by thiopurine as a maintenance treatment. We carefully gave TAC for more than 3 months only when the patient could not tolerate its withdrawal. All patients fasted or were on a diet 2 hours prior to TAC administration during the study to avoid the influence of diet intake on blood levels [22].

(2) Clinical outcomes and CYP3A5 genotype

The required TAC dosages in achieving the target blood trough level of 10 ng/mL were evaluated and the association between the dosages and the CYP3A5*3 variants were analyzed. We evaluated the following 3 items to assess the efficacy of individualized treatment based on CYP3A5 SNP with TAC. The comparisons of the first blood trough level and the rate in achieving the target blood trough level within a week between fixed- and individualized-dose treatment plans were assessed. Short-term outcome was assessed as a clinical remission rate at 2 weeks. Lichtiger clinical activity index (CAI) was used to evaluate disease activity; that is, a Lichtiger CAI ≤4 was defined as clinical remission. Long-term outcome was assessed as a relapse-free survival rate among the patients who successfully achieved clinical remission in 4 weeks. Relapse was defined as the addition of another induction remission treatment such as biologic agents, systemic steroids, or colectomy. In addition, the overall rate of TAC-related renal dysfunction and the impact of CYP3A5 genotype on renal dysfunction-free survival rate were assessed. Renal dysfunction was defined as an increase of serum creatinine >25%.

2. Statistical Analysis

All numerical data were shown as the mean±SD, and all categorical data were expressed as number and percentage. The differences between 2 groups were analyzed using an unpaired t-test, a chi-square test and a Fisher exact test, and the differences between 3 groups were analyzed using a Kruskal-Wallis test followed by a Dunn multiple comparisons test. A Kaplan-Meier method, with log-rank test was used to compare survival curves. A P-value of <0.05 was considered statistically significant, and variables pertaining to accuracy were calculated with 95% CI. Statistical analyses were performed using GraphPad Prism software, version 6.0 (GraphPad Software, Inc., La Jolla, CA, USA).

3. Ethical Considerations

This study was registered at the University Hospital Medical Information Network Center Trials Registry (UMIN000013694) and was conducted in accordance with the Declaration of Helsinki and Good Clinical Practice. The Research Ethics Committee of Kitasato University Kitasato Institute Hospital approved the study protocol and all documents (approval number: 14005). Written informed consent was obtained from all patients included in the study.

RESULTS

1. Study 1

1) Study Population

A total of 20 patients were enrolled. One patient was excluded because the patient took a drug, that is, lansoprazole, which can influence CYP3A5 activity and interact with TAC. Thus, 19 patients were included in the analysis. Seven were rheumatoid arthritis patients and 12 were UC patients. Their CYP3A5 genotype variants were 2 (10.5%), 8 (42.1%), and 9 (47.4%) for CYP3A5*1/*1, CYP3A5*1/*3, and CYP3A5*3/*3, respectively, while no CYP3A4 SNP was observed. The rates of these SNPs corresponded with previous reports [12,14,16,19,23,24].

2) TAC Dosages and CYP3A5 Genotype

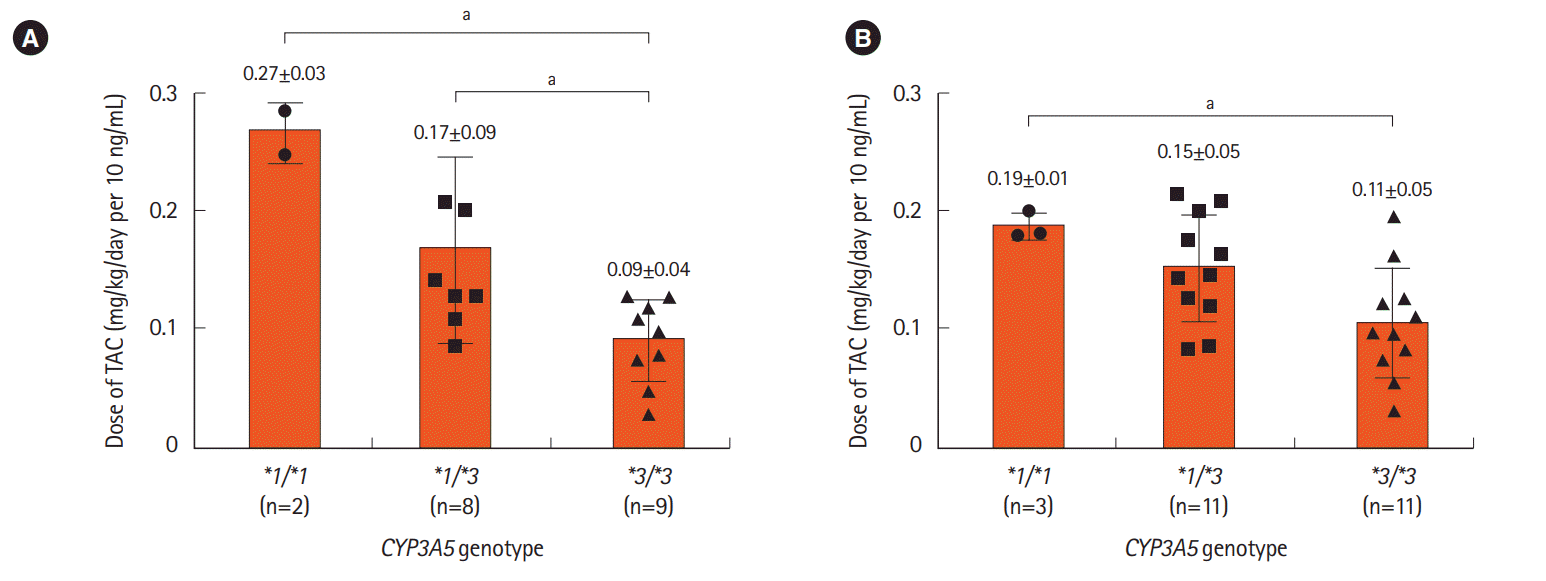
The required TAC dosages for maintaining a stable blood trough level of 10 ng/mL were significantly higher in patients with both CYP3A5*1/*1 (P<0.05, Dunn multiple comparisons test) and CYP3A5*1/*3 (P<0.05, Dunn multiple comparisons test) than CYP3A5*3/*3 (Fig. 1A). The required dosages were 0.27 ± 0.03, 0.17 ± 0.09, and 0.09 ± 0.04 mg/kg/day per 10 ng/mL for CYP3A5*1/*1, CYP3A5*1/*3, and CYP3A5*3/*3, respectively.

2. Study 2

1) Study Population

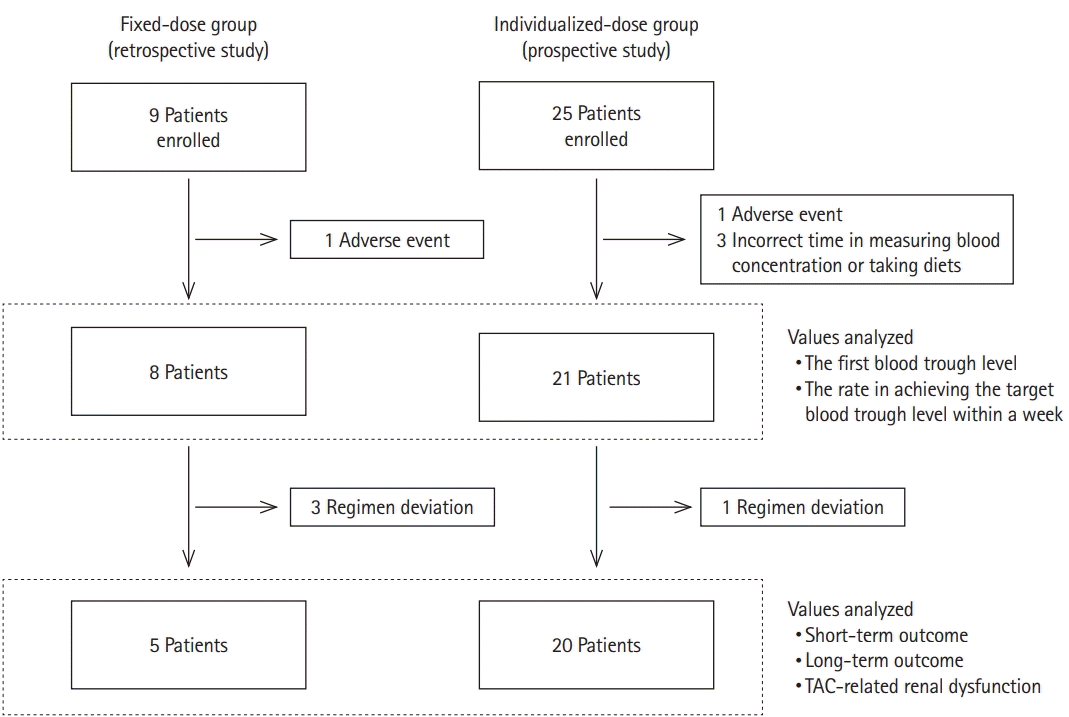
The initial enrollment cohort for the final analysis is shown in Fig. 2. Three patients who had been on long-term TAC as maintenance therapy in study 1 were excluded, thus 34 consecutive UC patients who have started induction remission treatment with TAC were enrolled. Two patients were excluded due to intolerable adverse events; that is, 1 patient suffered from nausea and the other suffered from chest discomfort. Three patients were excluded because of incorrect time in measuring blood concentration or taking diets. Thus, 29 patients were included in the analysis and their demographic characteristics are shown in Table 1. Among these 29 patients, 4 patients were eventually excluded from the analysis of short- and long-term outcomes because of regimen deviation, that is, dose adjustments were not performed accurately during the study.

2) TAC Dosages and CYP3A5 Genotype

The initial TAC dosages according to CYP3A5 SNP were set as 0.2, 0.15, and 0.1 mg/kg/day for CYP3A5*1/*1, CYP3A5*1/*3, and CYP3A5*3/*3, respectively, which were determined based on the results of study 1. The required TAC dosages in achieving the target blood trough level of 10 ng/mL in this cohort were 0.19 ± 0.01, 0.15 ± 0.05, and 0.11 ± 0.05 mg/kg/day per 10 ng/mL for CYP3A5*1/*1, CYP3A5*1/*3, and CYP3A5*3/*3, respectively (Fig. 1B) and there was a significant difference between CYP3A5*1/*1 and CYP3A5*3/*3 (P<0.05, Dunn multiple comparisons test). These values were almost the same as the determined initial dosages for individualized treatment in this study.

3) First Blood trough Levels and Rates in Achieving the Target Blood trough Level within a Week

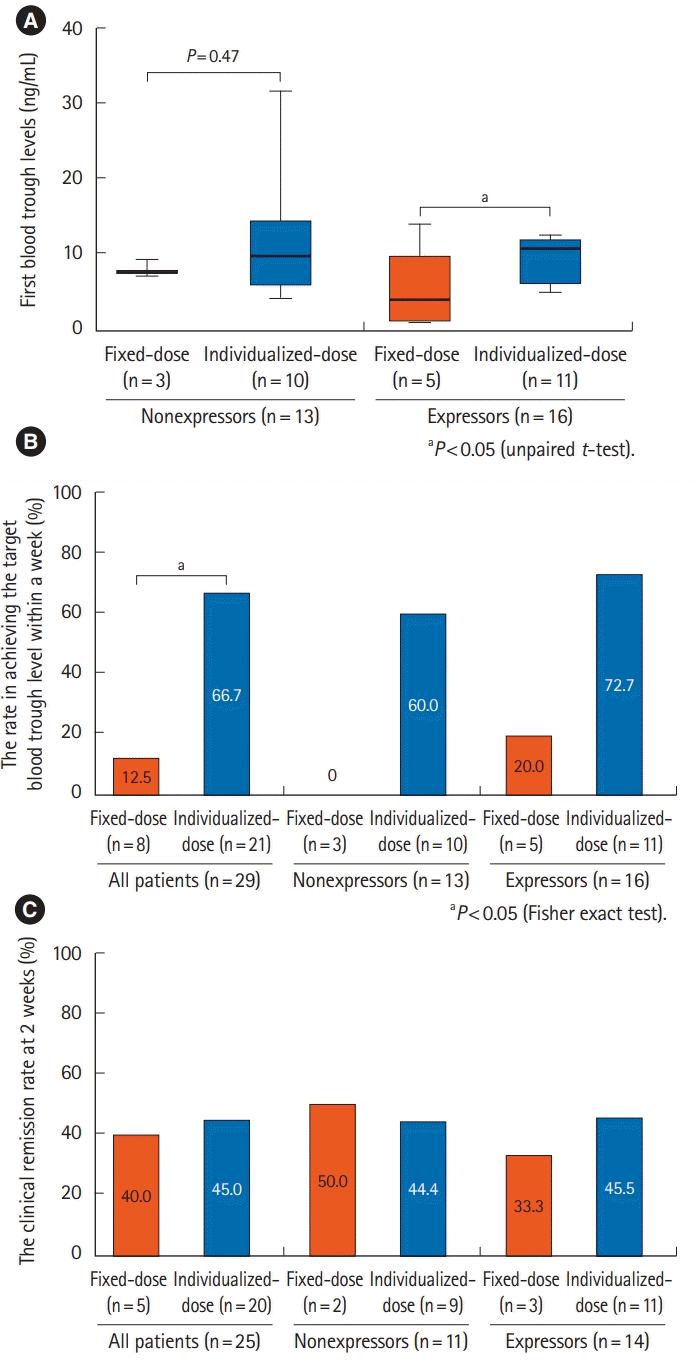
The first blood trough level was measured average of 63.8 ± 17.2 hours after the initial TAC administration. We assessed the following clinical outcomes by separating the population into CYP3A5 expressors and nonexpressors as reported previously because a small number of patients with CYP3A5*1/*1 were observed in this study. Fig. 3 provides a comparison of first blood trough levels and rates in achieving the target blood trough level within a week between the fixed- and individualized-dose groups. The first blood trough levels in patients with CYP3A5 expressors in the individualized-dose group were significantly higher than those in the fixed-dose group (5.15 ± 2.33 ng/mL vs. 9.63 ± 0.79 ng/mL, P= 0.035) (Fig. 3A). The overall rate in achieving the target blood trough level within a week was significantly higher in the individualized-dose group than in the fixed-dose group (12.5% vs. 66.7%, P=0.01) (Fig. 3B). The rate of patient achieving the target blood trough level by initial dose in individualized-dose group was significantly higher than that in fixed-dose group (fixed-dose group 12.5% [1/8], individualized-dose group 61.9% [13/21], P=0.04), and accordingly, the number of dose adjustments was significantly fewer in individualized-dose group than fixed-dose group (Table 1).

4) Short-term Clinical Outcome

Numerically higher percentage of patients achieved clinical remission at 2 weeks in the individualized-dose group (fixeddose group, 40.0% vs. individualized-dose group, 45.0%, P=1.00) (Fig. 3C). For the clinical remission rate at 2 weeks, the CYP3A5 expressors was as high as the nonexpressors in the individualized-dose group (nonexpressors, 44.4% vs. expressors, 45.4%, P=1.00), which suggests that efficacy in the CYP3A5 expressors improved by individualized treatment compared with a previous report that showed a significantly lower remission rate in the CYP3A5 expressors [14].

5) Long-term Clinical Outcome

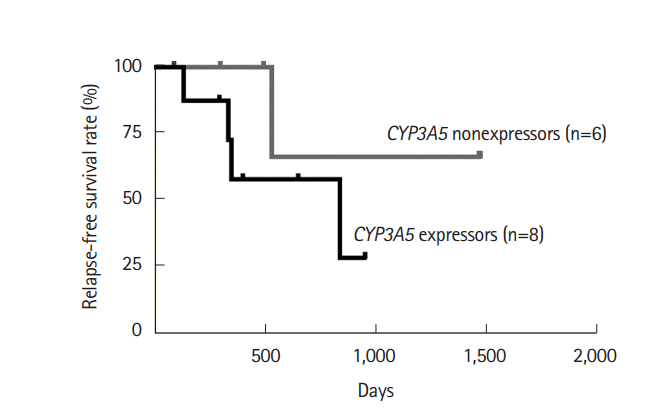
Among 25 patients, the long-term clinical outcome was evaluated in 14 patients (8 CYP3A5 expressors and 6 nonexpressors) who had clinical remission induced successfully at 4 weeks (Fig. 4). Among the 14 patients, there were 13 patients (92.9%) who had been receiving TAC for more than 3 months (fixeddose group 100% [4/4], individualized-dose group 90% [9/10], P=1.00). The overall relapse-free survival rate during the study was 64.3% (9/14) (50% and 83.3% in CYP3A5 expressors and nonexpressors, respectively). Five patients had a flare-up: 4 resulted in colectomy and 1 successfully induced clinical remission with additional treatment. Regarding the association between long-term clinical outcome and CYP3A5 genotype, a Kaplan-Meier curve showed no direct impact of CYP3A5 genotype on relapse-free survival rate (P=0.22) after performing dose adjustment.

6) Adverse Events and the Association between TAC-Related Renal Dysfunction and CYP3A5 Genotype

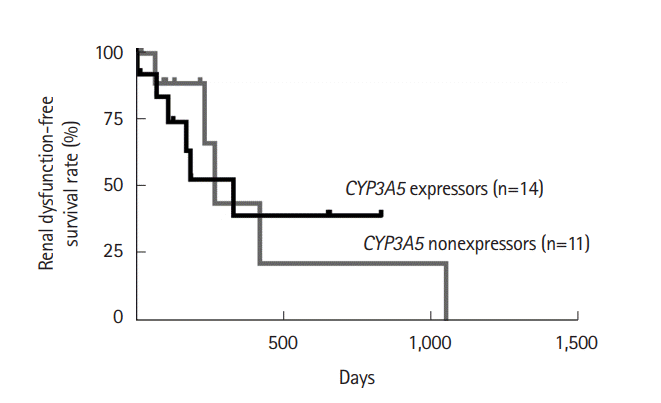
No serious adverse event was reported in this study. Among the 25 patients, there were 17 patients (68.0%) who had been receiving TAC for more than 3 months (fixed-dose group 80.0% [4/5], individualized-dose group 65.0% [13/20], P=1.00). A total of 11 (6 CYP3A5 expressors and 5 nonexpressors) patients (44.4%) experienced TAC-related renal dysfunction, but their renal functions were all recovered to their baseline states after the dose reduction or withdrawal of TAC. Only 12.0% of patients (3/25) developed renal dysfunction within 3 months after starting TAC, while it developed in 47.1% of patients (8/17) who were on TAC for more than 3 months. Regarding the association between TAC-related renal dysfunction and CYP3A5 genotype, a Kaplan-Meier curve showed no direct impact of CYP3A5 genotype on renal dysfunction-free survival rate (P=0.87) (Fig. 5) after performing dose adjustment.
Other 2 adverse events (5.7%), that is, nausea and chest discomfort, were attributed to TAC, but both resolved after withdrawal of the drug.

DISCUSSION

We demonstrated the feasibility of individualized treatment based on CYP3A5 SNP with TAC in UC with short duration in achieving the target blood trough level as well as the potential to improve early therapeutic efficacy, especially in patients with CYP3A5 expressors. To our knowledge, this is the first report of the application of a pharmacogenetics approach to treat UC with TAC.
The management of acute flare-ups on UC is clinically challenging and requires sufficient efficacy and safety when performing salvage treatment. Guidelines for managing the disease suggest colectomy if no response to salvage treatment is seen at an early stage, especially within a week after starting the treatment, because its risks may outweigh its benefits [4,5]. TAC is one of the therapeutic options as a salvage treatment with relatively rapid short-term clinical effectiveness [9,10]; however, in clinical practice, it is sometimes not easy and time-consuming to optimize TAC concentration rapidly for the therapeutic range when starting the treatment with a fixed initial dosage [14] because its efficacy is largely influenced by genetic polymorphisms of CYP3A4, CYP3A5, and ABCB1. Among these SNPs, only CYP3A5 could be an important factor in Japanese because the frequency of CYP3A4 SNP is known to be quite low [12,13,20,24,25] and there were no patients with CYP3A4 SNP in our study. The impact of ABCB1 SNPs on the treatment efficacy of TAC was reported among a German population [15]. However, no impact of ABCB1 SNPs was observed on the early efficacy of TAC among Japanese [14,16]. Hirai et al. [14] noted that the most crucial SNP affecting the pharmacokinetics of TAC was CYP3A5 SNP, which is similar to findings in the organ transplantation field [19,23,26,27]. In the present study, a larger dose of TAC was required for the target blood trough level in the absence of CYP3A5 SNP. These data support the feasibility of individualized treatment with TAC based on CYP3A5 SNP. Indeed, we successfully increased blood trough levels rapidly by individualizing the initial TAC dosage, with a higher proportion of patients reaching the target blood trough level within a week compared with those given an initial fixed TAC dose. This may not only increase the possibility to accelerate its efficacy, but also allow us to evaluate the response of TAC earlier, which could be an advantage when determining whether we should continue medical treatment with TAC or suggest colectomy. In addition, by reducing the number of dose adjustments through an individualized initial dose may improve the feasibility of using TAC in clinical practice because turnaround of TAC trough level measurement takes more than a day in many institutions, even though difference in efficacy did not reach statistical significance which may be due to a small sample size. The prognosis of UC could possibly be improved in non-Japanese patients by applying our concept of individualized treatment to the CYP3A4 or ABCB1 SNPs, which could be the primary genes that affect the efficacy of TAC in non-Japanese patients.
We evaluated the short-term clinical outcome in the individualized-dose group compared with the fixed-dose group. The clinical remission rate at 2 weeks in the individualized-dose group was numerically higher than in the fixed-dose group, but there was no significant difference, despite the more rapid achievement of blood trough levels in the individualized-dose group. However, while the previous study showed a worse outcome in the CYP3A5 expressors [14], the clinical remission rate at 2 weeks in the expressors was as high as in nonexpressors by individualized initial TAC dosage, which supports the benefit of individualized treatment.
As for long-term prognosis, CYP3A5 SNP did not seem to have any direct impact on the relapse-free survival rate after performing dose adjustment. Onodera et al. [16] reported that ABCB1 SNPs were not associated with the pharmacokinetics of TAC, but were an independent factor for therapeutic efficacy in the clinical remission rate at 12 weeks regardless of its limited efficacy at 4 weeks. Therefore, except for the early stage of prognosis, they might be associated primarily with ABCB1 rather than CYP3A5 SNP.
The blood concentration of TAC is related not only to its efficacy, but also to numerous side effects, including renal dysfunction [11]. Although we examined the association between CYP3A5 SNP and renal dysfunction, no direct association between CYP3A5 SNP and the incidence of renal dysfunction was observed after performing dose adjustment. All patients who experienced renal dysfunction recovered to their baseline states without any problem after dose reduction or drug discontinuation, which suggests that individualized treatment did not increase the risk of the side effects.
There were some limitations in our study, including its sample size and conduction in a single center, which might result in lack of statistically significant improvement of clinical outcomes in the individualized-dose group despite more rapid achievement of the target trough level or the presence of a type I error. Another limitation was the lack of a direct comparison between fixed dose and individualized treatments. The food-intake and the time point of measuring blood trough level were not able to match completely, which could be a limitation in this study. It was assumed that the food-intake could not affect much on the blood trough level because TAC was administered 2 hours prior to food-intake [22], but the extent of TAC absorption could differ among individualized based on the fasting status. Regarding the timepoint of measuring, we measured blood trough level within a range of 48 to 72 hours after TAC administration in our clinical practice and it is possible that variation of timing of first trough level measurement biased the results. In addition, the lack of identification of ABCB1 SNPs may also be a limitation. However, blood trough level and therapeutic efficacy were previously reported as not being affected by ABCB1 SNPs at the early stage of induction treatment with TAC in UC [14,16], which is the period that we most heavily focused on this study.
In summary, our study showed that adjusting the initial TAC dosage based on CYP3A5 SNP led to a rapid increase in the blood trough level of CYP3A5 expressors after starting treatment with a high rate in achieving the target blood trough level within a week, which is the most important period in salvage treatment for acute severe UC. It was suggested that this pharmacogenetic approach could not directly statistically improve the clinical efficacy but may improve the feasibility of TAC treatment in UC, especially in patients with CYP3A5 expressors who have difficulty in rapidly reaching the therapeutic range.

Notes

FINANCIAL SUPPORT

The authors received no financial support for the research, authorship, and/or publication of this article.

CONFLICT OF INTEREST

T.K. received lecture fees from Mitsubishi Tanabe Pharma Co., Ltd, Eisai Co., Ltd, Kyorin Pharmaceutical Co., Ltd, AbbVie Inc., Janssen Pharmaceutical K.K, JIMRO Co., Ltd, Ajinomoto Pharma Co., Ltd, EA Pharma Co., Ltd, Astellas Pharma Inc, Mochida Pharmaceutical Co., Ltd, Asahi Kasei Medical Co., Ltd, Takeda Pharmaceutical Co., Ltd, Gilead Sciences Inc., Celltrion Inc, Nippon Kayaku Co., Ltd, Alfresa Pharma Co., Ltd and advisory/consultancy fees from Janssen Pharmaceutical K.K, Pfizer Inc, Kyorin Pharmaceutical Co., Ltd, Mochida Pharmaceutical Co., Ltd, Takeda Pharmaceutical Co., Ltd, Eli Lilly and Company, Ferring Pharmaceutical Co., Ltd, Nippon Kayaku Co., Ltd, Thermo Fisher Scientific Inc, Covidien Japan Inc and research grant from EA Pharma Co., Ltd, Thermo Fisher Scientific Inc, Alfresa Pharma Co., Ltd. T.H. received lecture fees from AbbVie Inc, Kyorin Pharmaceutical Co., Ltd, Eisai Co., Ltd, Mitsubishi Tanabe Pharma Co., Ltd, EA Pharma Co., Ltd, JIMRO Co., Ltd and ZERIA Pharmaceutical Co., Ltd. M.N. received lecture fees from Takeda Pharmaceutical Co. Ltd and Mochida Pharmaceutical Co., Ltd. However, all of these are not relevant to this article.

AUTHOR CONTRIBUTION

Conceptualization: Kobayashi T. Methodology: Okabayashi S, Kobayashi T. Formal analysis: Okabayashi S, Saito E, Yagisawa K. Writing-original draft: Okabayashi S, Kobayashi T. Approval of final manuscript: all authors

ACKNOWLEDGMENTS

We are grateful to Tadae Mori, Toyomi Ishibashi, and Yuki Watanabe for helping us accomplish this study.

REFERENCES

1. Baumgart DC, Carding SR. Inflammatory bowel disease: cause and immunobiology. Lancet. 2007; 369:1627–1640.
crossref
2. Dinesen LC, Walsh AJ, Protic MN, et al. The pattern and outcome of acute severe colitis. J Crohns Colitis. 2010; 4:431–437.
crossref
3. Turner D, Walsh CM, Steinhart AH, Griffiths AM. Response to corticosteroids in severe ulcerative colitis: a systematic review of the literature and a meta-regression. Clin Gastroenterol Hepatol. 2007; 5:103–110.
crossref
4. Matsuoka K, Kobayashi T, Ueno F, et al. Evidence-based clinical practice guidelines for inflammatory bowel disease. J Gastroenterol. 2018; 53:305–353.
crossref
5. Harbord M, Eliakim R, Bettenworth D, et al. Third European evidence-based consensus on diagnosis and management of ulcerative colitis. Part 2: current management. J Crohns Colitis. 2017; 11:769–784.
crossref
6. Komaki Y, Komaki F, Ido A, Sakuraba A. Efficacy and safety of tacrolimus therapy for active ulcerative colitis; a systematic review and meta-analysis. J Crohns Colitis. 2016; 10:484–494.
crossref
7. Schreiber SL, Crabtree GR. The mechanism of action of cyclosporin A and FK506. Immunol Today. 1992; 13:136–142.
crossref
8. Kelly PA, Burckart GJ, Venkataramanan R. Tacrolimus: a new immunosuppressive agent. Am J Health Syst Pharm. 1995; 52:1521–1535.
crossref
9. Ogata H, Kato J, Hirai F, et al. Double-blind, placebo-controlled trial of oral tacrolimus (FK506) in the management of hospitalized patients with steroid-refractory ulcerative colitis. Inflamm Bowel Dis. 2012; 18:803–808.
crossref
10. Ogata H, Matsui T, Nakamura M, et al. A randomised dose finding study of oral tacrolimus (FK506) therapy in refractory ulcerative colitis. Gut. 2006; 55:1255–1262.
crossref
11. Naesens M, Kuypers DR, Sarwal M. Calcineurin inhibitor nephrotoxicity. Clin J Am Soc Nephrol. 2009; 4:481–508.
crossref
12. Kuehl P, Zhang J, Lin Y, et al. Sequence diversity in CYP3A promoters and characterization of the genetic basis of polymorphic CYP3A5 expression. Nat Genet. 2001; 27:383–391.
crossref
13. Schwab M, Eichelbaum M, Fromm MF. Genetic polymorphisms of the human MDR1 drug transporter. Annu Rev Pharmacol Toxicol. 2003; 43:285–307.
14. Hirai F, Takatsu N, Yano Y, et al. Impact of CYP3A5 genetic polymorphisms on the pharmacokinetics and short-term remission in patients with ulcerative colitis treated with tacrolimus. J Gastroenterol Hepatol. 2014; 29:60–66.
crossref
15. Herrlinger KR, Koc H, Winter S, et al. ABCB1 single-nucleotide polymorphisms determine tacrolimus response in patients with ulcerative colitis. Clin Pharmacol Ther. 2011; 89:422–428.
crossref
16. Onodera M, Endo K, Kakuta Y, et al. ATP-binding cassette subfamily B member 1 1236C/T polymorphism significantly affects the therapeutic outcome of tacrolimus in patients with refractory ulcerative colitis. J Gastroenterol Hepatol. 2017; 32:1562–1569.
crossref
17. Barbarino JM, Staatz CE, Venkataramanan R, Klein TE, Altman RB. PharmGKB summary: cyclosporine and tacrolimus pathways. Pharmacogenet Genomics. 2013; 23:563–585.
18. Provenzani A, Notarbartolo M, Labbozzetta M, et al. Influence of CYP3A5 and ABCB1 gene polymorphisms and other factors on tacrolimus dosing in Caucasian liver and kidney transplant patients. Int J Mol Med. 2011; 28:1093–1102.
crossref
19. Satoh S, Saito M, Inoue T, et al. CYP3A5*1 allele associated with tacrolimus trough concentrations but not subclinical acute rejection or chronic allograft nephropathy in Japanese renal transplant recipients. Eur J Clin Pharmacol. 2009; 65:473–481.
crossref
20. Suzuki Y, Homma M, Doki K, Itagaki F, Kohda Y. Impact of CYP3A5 genetic polymorphism on pharmacokinetics of tacrolimus in healthy Japanese subjects. Br J Clin Pharmacol. 2008; 66:154–155.
crossref
21. Bannai M, Higuchi K, Akesaka T, et al. Single-nucleotide-polymorphism genotyping for whole-genome-amplified samples using automated fluorescence correlation spectroscopy. Anal Biochem. 2004; 327:215–221.
crossref
22. Bekersky I, Dressler D, Mekki Q. Effect of time of meal consumption on bioavailability of a single oral 5 mg tacrolimus dose. J Clin Pharmacol. 2001; 41:289–297.
crossref
23. Tada H, Tsuchiya N, Satoh S, et al. Impact of CYP3A5 and MDR1(ABCB1) C3435T polymorphisms on the pharmacokinetics of tacrolimus in renal transplant recipients. Transplant Proc. 2005; 37:1730–1732.
crossref
24. Ball SE, Scatina J, Kao J, et al. Population distribution and effects on drug metabolism of a genetic variant in the 5’ promoter region of CYP3A4. Clin Pharmacol Ther. 1999; 66:288–294.
crossref
25. Sata F, Sapone A, Elizondo G, et al. CYP3A4 allelic variants with amino acid substitutions in exons 7 and 12: evidence for an allelic variant with altered catalytic activity. Clin Pharmacol Ther. 2000; 67:48–56.
crossref
26. Tsuchiya N, Satoh S, Tada H, et al. Influence of CYP3A5 and MDR1 (ABCB1) polymorphisms on the pharmacokinetics of tacrolimus in renal transplant recipients. Transplantation. 2004; 78:1182–1187.
crossref
27. Masuda S, Inui K. An up-date review on individualized dosage adjustment of calcineurin inhibitors in organ transplant patients. Pharmacol Ther. 2006; 112:184–198.
crossref

Fig. 1.
The required tacrolimus (TAC) dosages in achieving the target blood trough level of 10 ng/mL in study 1 and 2. The required TAC dosages in achieving the target blood trough level were higher in patients with both CYP3A5*1/*1 and CYP3A5*1/*3 than CYP3A5*3/*3 by the Kruskal-Wallis test and the Dunn multiple comparisons test. (A) Study 1: CYP3A5*1/*1 vs. *CYP3A5*3/*3, P=0.027; CYP3A5*1/*3 vs. CYP3A5*3/*3, P=0.046. (B) Study 2: CYP3A5*1/*1 vs. CYP3A5*3/*3, P=0.039; CYP3A5*1/*3 vs. CYP3A5*3/*3, P=0.093. aP<0.05.
ir-2018-00117f1.tif
Fig. 2.
The flowchart showing the initial enrollment cohort for the final analysis. TAC, tacrolimus.
ir-2018-00117f2.tif
Fig. 3.
The comparison of clinical outcomes between the fixedand individualized-dose groups. (A) The first blood trough levels in patients with CYP3A5 expressors in the individualized-dose group were significantly higher than those in the fixed-dose group (5.15±2.33 ng/mL vs. 9.63±0.79 ng/mL, aP=0.035). (B) The overall rate in achieving the target blood trough level within a week was significantly higher in the individualized-dose group than in the fixed-dose group (12.5% vs. 66.7%, P=0.014). (C) The clinical remission rate at 2 weeks in the individualized-dose group was numerically higher than in the fixed-dose group (40.0% vs. 45.0%, P=1.00). The clinical remission rate at 2 weeks in CYP3A5 expressors was as high as nonexpressors in the individualizeddose group (44.4% vs. 45.4%, P=1.00).
ir-2018-00117f3.tif
Fig. 4.
A Kaplan-Meier curve of relapse-free survival rate according to CYP3A5 genotype in patients who had clinical remission induced successfully at 4 weeks (n=14). There was no statistical difference between CYP3A5 expressors and nonexpressors (P=0.22).
ir-2018-00117f4.tif
Fig. 5.
A Kaplan-Meier curve of renal dysfunction-free survival rate according to CYP3A5 genotype after performing dose adjustment (n=25). There was no statistical difference between CYP3A5 expressors and nonexpressors (P=0.87).
ir-2018-00117f5.tif
Table 1.
Comparison of Baseline Characteristics between the Fixed- and Individualized-Dose Groups
Characteristic Fixed-dose (n=8) Individualizeddose (n=21) P-value
Age (yr) 35.5±3.1 38.6±3.5 0.61a
Male sex 5 (62.5) 14 (66.7) 1.00b
Body weight (kg) 57.8±4.3 55.0±2.0 0.51a
Disease duration (mon) 84.7±33.0 85.0±18.7 0.99a
Extent of disease
 Entire colitis 6 (75.0) 15 (71.4) 1.00b
 Left-sided colitis 2 (25.0) 6 (28.6)
CYP3A5 genotype 0.84c
 Expressor *1/*1 1 (12.5) 3 (14.3)
*1/*3 4 (50.0) 8 (38.1)
 Nonexpressor *3/*3 3 (37.5) 10 (47.6)
Initial TAC dosage (mg/day) 6.0±1.8 7.5±2.0 0.11a
Time to initial blood test (day) 3.38±0.42 3.00±0.13 0.26a
No. of dose adjustment 0.02c
 0 1 (12.5) 13 (61.9)
 1 4 (50.0) 7 (33.3)
 ≥2 3 (37.5) 1 (4.8)
Food-intake (yes/no) 6/2 13/8 0.67b
Previous use of biologic agents 3 (37.5) 15 (71.4) 0.20b
Immunosuppressive therapy 5 (62.5) 14 (66.7) 1.00b
Lichtiger CAI 10.6±0.9 11.0±0.9 0.83a
CRP (mg/dL) 2.58±1.26 4.68±1.59 0.43a
Cr (mg/dL) 0.75±0.07 0.74±0.03 0.88a

Values are presented as mean ± SD or number (%).

a Unpaired t-test.

b Fisher exact test.

c Chi-square test.

TAC, tacrolimus; CAI, clinical activity index; Cr, creatinine.

TOOLS
Similar articles