

 PDF
PDF Citation
 Print
Print


INTRODUCTION
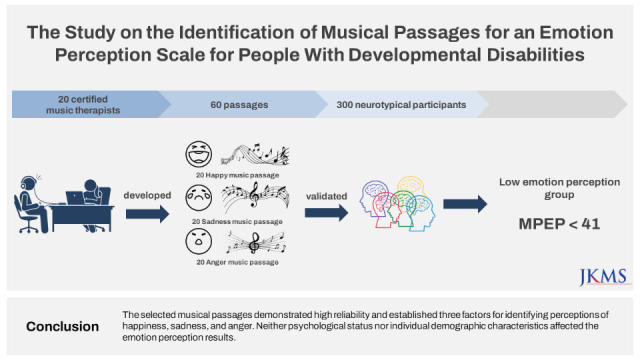
Emotion recognition is essential to the social adjustment and social interaction of people with developmental disabilities (IDDs),12 and it is believed to affect many other learning areas. Planalp3 emphasized the role of facial recognition in human interaction, and most studies have focused on visual stimuli like facial expressions when assessing emotion recognition.4 However, the use of visual stimuli alone to assess emotion recognition has several limitations. Specifically, people with intellectual disabilities or autism spectrum disorders often face challenges from their limited ability to detect and process emotions in social situations.56 Those with IDDs show diminished capacity in emotion recognition because they have slower processing skills for social cues.7 Additionally, they experience difficulties integrating multilayered visual and auditory information related to emotion,8 and they have structural abnormalities or dysfunction in brain regions associated with emotion processing, particularly in the temporal lobes.910
Beyond visual stimuli, auditory information also plays a substantial role in emotion detection and processing. Considering that there are challenges to relying solely on visual stimuli for emotion recognition and that most studies have focused on facial emotion recognition, we concentrated on developing an alternative approach to assessing auditory emotion recognition through music.
Major functions of music include the “enhancement, communication, and regulation of emotion.”11 In other words, people use music to experience and express emotions fully and to regulate their affective states. Given the direct relationship between music and emotion, over 300 studies have investigated the subjective perception of emotions expressed in music.12 This extensive literature supports the use of music to assess and promote emotion recognition. Experts have argued that music can stimulate emotion recognition as accurately as facial or verbal expressions can.131415 Consequently, music can be effective in assessing and promoting emotion recognition abilities.161718
Most studies of music emotion recognition (MER) have evaluated the emotions either perceived or felt from music.19 In the former case, the listener identifies the type of emotion that music expresses or conveys. In the latter case, the listener describes personally experienced, induced, or evoked emotions. The consensus is that the listener perceives emotions in music because of music’s structural components, such as tone quality and other musical elements.2021 In contrast, an individual’s physiological, personal, cultural, and psychological characteristics significantly influence the music-induced emotions felt.22232425 Therefore, music for an emotion recognition test needs to be selected and evaluated according to the “perceived” emotion type.
In an extensive review of musical stimuli used for emotion recognition, 74% of studies investigated perceived emotion in music.12 In addition, 55% of studies relied on passages instead of the entire musical work, and 78% of those studies used selections that were less than a minute long. The most frequently assessed emotions were sadness, happiness, and anger, as observed in more than half of the reviewed studies. The researcher or an expert usually selected the music, although 37% of studies employed previously used stimuli for MER. The most frequent musical genres were popular, Western classical, and film music.12 Although these results provide a helpful guide for musical passage selection in future MER studies, they emphasize the need for a more precise rationale and selection criteria, and for the implementation of measures to reach a consensus on choosing music for each emotion category.
MER involves multiple factors associated with each type of music.26 Scherer27 outlined variables that can influence the affective appraisal of music, including physiological arousal, motor expression, subjective feeling, behavioral preparation, and cognitive processes, and explained why variance occurs when evaluating emotion perception in music. Yang and Chen28 noted that it is difficult to reach a consensus on the emotional content of music. One way to overcome this problem is to involve multiple perspectives in selecting stimuli for emotion recognition. Similarly, in our previous project, chosen images were rated by a group of healthy participants. Then, we used the pictures with the highest agreement rates to develop the facial emotion perception test.29
Another solution is to measure the intensity of expressed emotion, which allows for differences in the degree of expressiveness and makes the question less deterministic.30 When presented with scales, listeners feel less pressure to make difficult dichotomous decisions about whether a musical stimulus falls under one predetermined emotion.
Familiarity is a major topic of discussion in MER studies. It is often considered a confounding variable in the emotional appraisal of music.31 For instance, people have shown stronger emotional reactions to familiar music than unfamiliar music. Consequently, studies investigating induced emotion tend to use familiar music more frequently, whereas studies of perceived emotion rely on unfamiliar music.12
Familiarity has been observed to play a different role in IDDs, however. A recent neuroimaging study reported that familiar music did not show the same level of impact on people with autism as on neurotypical individuals.32 The authors postulated that a brain with autism processes information as new every time. Moreover, familiar stimuli may be preferable in psychometric tools for people with intellectual disabilities because unfamiliar stimuli often cause unnecessary anxiety in this population.33 Since listening to music can induce emotional wellbeing,34 the use of a familiar musical genre may be appropriate in assessing emotion recognition skills among people with IDDs. Similarly, Pochon and Declercq emphasized that they use familiar cues for emotion recognition when working with children with Down syndrome, as familiarity improves the children’s confidence level and task understanding.
Our study aimed to evaluate participants’ subjective perception of emotions expressed in music by asking them to classify each music type as happy, sad, or angry and to use a 7-point Likert-type scale to rate the expressive intensity of each musical passage. The purpose of this preliminary study was to compile a pool of musical passages needed to develop a music-based emotion perception test through evaluation by experts and neurotypical adults. In accordance with the predetermined methods of music selection for MER studies,12 we utilized researcher-chosen music verified by expert and non-expert groups through pilot testing.
We postulated that researchers, experts, and non-experts would reach a notable agreement in identifying musical passages for each emotion classification. In addition, we hypothesized that the music perception test using musical passages could effectively assess healthy participants’ ability to detect emotions.
METHODS
Phase I
Participants
We conducted the study in two phases: selection of musical passages for the musical passages for emotional perception test (MPEP; phase 1) and MPEP validation (phase 2) (Fig. 1). The participants in the first phase comprised 20 certified music therapists (19 women). They each had a bachelor’s degree in classical or popular music and a master’s degree or higher in music therapy. The participants were recruited using the snowball sampling method; we asked the first group to invite other participants who had also majored in both music and music therapy (Table 1).
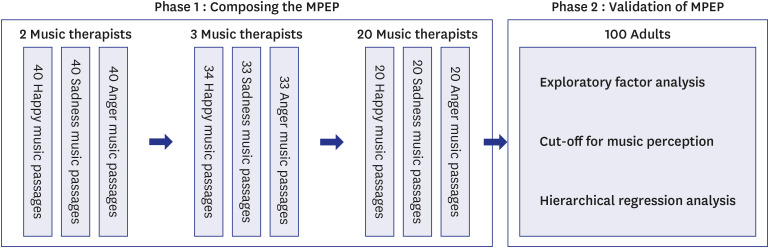
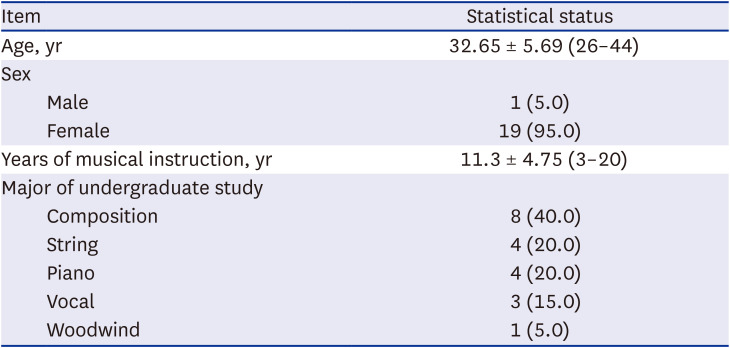
Fig. 1
The process of selecting musical passages for emotional perception composition and validation
MPEP = musical passages for emotional perception test.
![]()
Table 1
Participants’ demographic characteristics: Phase I
![]()
Procedure
After obtaining their consent, we sent the expert group a Google survey link with a detailed description of the study. Music therapists rated the appropriateness of emotion classification and the level of expressed intensity for 100 musical passages initially identified and classified by the researchers.
Process of music selection
In accordance with a comprehensive review of MER studies,12 we implemented the most frequently practiced method of selecting musical passages; the experimenter chose music based on expert opinion and within the top three most frequently chosen musical genres—popular, Western classical music, and film music. However, we designed the study to follow a two-step verification process, with a group of experts participating in the first phase, and typically developing participants without musical expertise included in the second phase.
We selected passages representing happiness, sadness, and anger because these are the emotions most often assessed through music.12 Three researchers with a background in music therapy reviewed the relevant literature and determined the duration, type, genre, and texture of the musical passages. Based on multiple discussions about previous MER studies, we limited the selections to instrumental music. Music that included percussion instruments was not considered, as rhythmic and percussive sounds cause stimulation. Each piece used no more than two instruments to minimize the impact of the complexity of musical texture. The performance format was limited to a keyboard or orchestral instrument solo, or an orchestral instrument accompanied by a keyboard.
At first, two music therapists identified 120 musical pieces representing the three emotions (40 pieces per emotion). Three music therapists from the research team met online three times to examine each piece and reach an agreement on its classification. These music therapists explored 30 additional pieces as replacements for initial selections. Finally, they compiled three playlists containing 34 pieces for happiness and 33 each for sadness and anger. These playlists were used in the first phase of the study (Supplementary Tables 1, 2, 3). Among the selected passages, the types of instrumentation were piano solos, string instruments accompanied by piano, and guitar solos. In terms of musical genre, classical music was the most frequent, followed by new age and jazz.
Survey construction
We constructed a survey using Google forms. Participants were provided with a complete study description and informed consent, which required them to insert a checkmark after each itemized statement related to the availability of information, extent of the research, and their rights. We obtained demographic characteristics, including age, sex, educational background, and musical background (Table 1).
The participants received three playlists from an online music streaming service in South Korea. Each playlist was consecutively titled happy (1 to 34), sad (1 to 33), and angry (1 to 33), with selected musical tracks numbered. The Google survey had a table with corresponding numbered items listing each song title and a Likert-type scale. Participants listened to each track from the playlist and then marked their answers on the corresponding numbered item on the Google survey. The presented musical passages are listed in Supplementary Tables 1, 2, 3.
The participants were instructed to listen to the first 15 seconds of each piece in a quiet space. We decided to use only the first 15 seconds of music because musical compositions often evolve and express different or multiple emotions as they unfold.28 Moreover, previous studies showed that 15-second musical stimuli are ideal for evaluating perceived emotions.16 A different starting point was specified for five pieces because they either had a dramatic change in expression or no notable expressions within the first 15 seconds. After listening to each piece, participants were asked to rate on a Likert-type scale 0 if they disagreed with the classified emotion. If they agreed with the classification, they rated the intensity of expressiveness of the classified emotion from 1 (extremely weak) to 7 (extremely strong). The same steps were repeated for all 100 pieces of music, with the entire process completed online. Due to the lengthy process, we suggested that participants take a 10-minute break after filling out the demographic information and rating the first batch of music selections.
Analysis of the survey results
Descriptive statistics were used to derive the frequency of disagreements and the mean intensity scores. For each category, we selected the 20 musical pieces with the highest intensity scores and the fewest occurrences of disagreement. We chose a total of 60 passages for use in the second phase of the study.
Phase 2
Participants
Participants in the second phase were 300 adults ages 18 to 40. The inclusion criteria were voluntary participation in the online survey and the ability to read and understand Korean. Professionally trained musicians, music majors, and people with auditory disorders, developmental disabilities, or a history of mental illness were excluded from the study. Initially, the participants were divided into two age groups—18- to 29-year-olds and 30- to 40-year-olds—so that an equal number of participants would be recruited for each age group. There were 170 participants and 130 participants in the first and second age groups, respectively. Their demographic information is presented in Table 2.
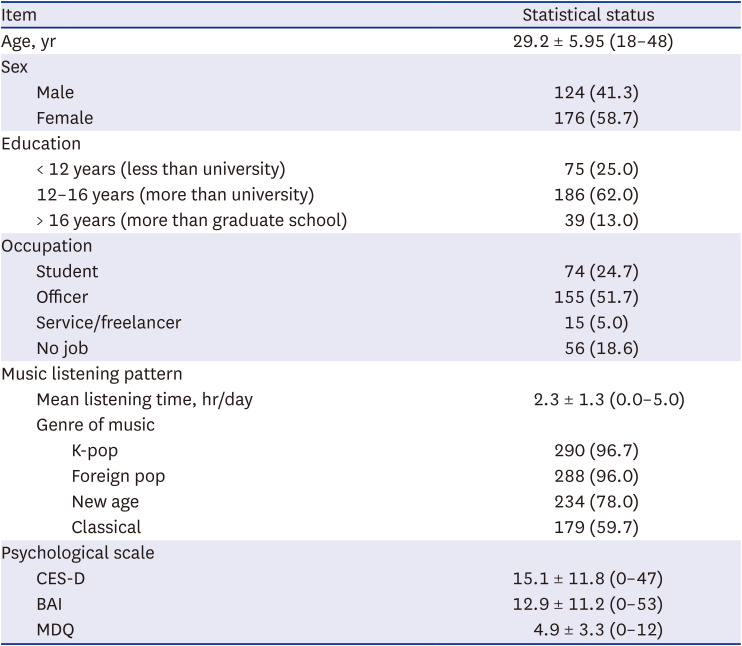
Table 2
Demographic characteristics: Phase 2
Values are presented as mean ± standard deviation (range) or number (%).
CES-D = Center for Epidemiologic Studies Depression Scale-Revised, BAI = Beck Anxiety Inventory, MDQ = Mood Disorder Questionnaire.
![]()
Procedure
We completed the entire process online using SurveyMonkey (Momentive, San Mateo, CA, USA) to create a survey and sending survey invitations via university online bulletin boards, internet cafés, and social media sites, such as Facebook. The invitation included a detailed study description, information about participants’ rights, and online survey limitations. Before answering the survey items, all participants provided their consent online to participate in the study.
Survey construction
The survey included questions across four parts: demographic information, musical background and listening habits, current mood, and perception of expressed emotions and their intensity in the selected musical passages. We added a section on current mood given the inseparable relationship between mood and emotion perception.35
Demographic information included age, sex, and education. Musical background and listening habits comprised the type and duration of musical training, time spent listening to music per day, and listening frequency by genre. The section on mood used validated instruments for assessing anxiety, depression, and mood disorder symptoms.
Anxiety levels were measured using the Korean version of the Beck Anxiety Inventory (BAI).36 For this 21-item questionnaire, respondents rate their perceived anxiety level from the past week using a 4-point Likert-type scale. In this study, Cronbach’s α was 0.92.
Depression was measured with the Center for Epidemiologic Studies Depression Scale (CES-D), which comprises twenty 4-point Likert-type questions assessing the perceived frequency of depressive symptoms. We used the Korean version devised by Cho and Kim,37 and Cronbach’s α was 0.88.
We also employed the Korean version of the Mood Disorder Questionnaire (MDQ), which was initially devised by Hirschfeld et al.38 and then translated and validated by Jon et al.39 The Korean version of the MDQ consists of 13 items assessing the presence and severity of mood disorder symptoms. Cronbach’s α was 0.83.
The section asking participants for their perception of the type and intensity of emotion expressed in music was prepared by embedding 60 randomly presented musical passages under each question. We purchased MP3 files of the musical pieces selected during the first study phase and used an audio editing tool to trim each file into a 15-second passage. We uploaded all passages to SoundCloud (Berlin, Germany) and linked each segment using the embed function in SurveyMonkey. Participants listened to a passage by clicking the play button next to each item number and then selected one of three Likert-type scales specified as happy, sad, or angry. Next, they rated the intensity of expressed emotion from 1 (extremely weak) to 7 (extremely strong). Participants were not allowed to choose more than one emotion type.
In summary, we used the emotion classification verified by 20 music therapy specialists in the first phase as comparison data for the second phase. When 300 responses from phase 2 matched the verified answer from phase 1, each item was coded as 1, if not 0. With factor loading in exploratory factor analysis (EFA), we wanted to confirm the similarities among the happy, sad, and angry musical passages.
Statistical analysis of the music emotion perception test
The data were visually analyzed to screen for undesirable answer behaviors before the analysis. We noted demographic characteristics, including age, sex, education, music-listening habits, and psychological status, with means, standard deviations, and minimum and maximum ranges.
The factor analysis for the MPEP items included Cronbach’s α and the consistency coefficient. We used EFA to determine whether the MPEP items accurately indicated music emotion perception among the participants. With the means of total item scores assessed by the general participants, a k-means cluster analysis was performed to segregate participants into either low music emotion perception or general music emotion perception groups. All analyses were conducted using SPSS (version 24.0; IBM Corp., Armonk, NY, USA).
We controlled for covariates, including participants’ demographic characteristics and psychological status, and adopted a hierarchical logistic regression analysis. A discrete set of hierarchical variables was added in a multiple hierarchical regression analysis of emotional perception: model 1, demographic characteristics; model 2, demographic characteristics plus psychological status; and model 3, demographic characteristics plus psychological status plus music perception. The dependent variable of the low emotion perception group was coded as 1, and the general emotion perception group was coded as 0.
Covariates were selected according to several factors that could influence music perception.2734 Personal variables, including age, sex, and years of musical training, could be regarded as important factors affecting the emotional response to music. As music has been reported to influence human emotion, emotional state can have an impact on emotional reactions to music.40 In addition, because more than 90% of the participants listened to K-pop and Western pop music, we omitted those genres in the regression analysis.
Ethics statements
The study protocol was reviewed and approved by the Institutional Review Board (IRB) of Chung-Ang University (IRB #1041078-202009-HRBM-286-01). Participants from both phases were fully informed about the purpose of the study and the voluntary nature of participation, including their right to withdraw at any time without reprisal. Given that all data were submitted online without any identifiers for the respondents, participants were informed that data could not be deleted once submitted.
RESULTS
Participants
Among the 300 participants, the mean age was 29.2 ± 5.95 years. In addition, 41.3% were male, 51.7% had office jobs, and 62.0% had completed college. The mean duration of music listening was 2.3 ± 1.3 hr/day. The mean scores of the CES-D, BAI, and MDQ were 15.1 ± 11.8, 12.9 ± 11.2, and 4.9 ± 3.3, respectively (Table 2).
Analysis of musical passages for correction rate
The mean score on the happiness scales was 4.25 ± 1.59 (0.40–0.85, skewness = −0.935, kurtosis = −0.239), the mean score on the sadness scales was 4.49 ± 1.58 (0.40–6.95, skewness = −0.998, kurtosis = −0.008), and the mean score on the anger scales was 4.00 ± 1.63 (0.30–7.00, skewness = −0.645, kurtosis = −0.435). Considering the skewness and kurtosis of all the data, the data showed a normal distribution. The mean correction rates for the happy, sad, and angry passages were 83.8%, 85.9%, and 81.6%, respectively. The happy passage with the highest correction rate was “Happy1,” and the passage with the lowest correction rate was “Happy13.” The sad passage with the highest correction rate was “Sad7,” and “Sad1” showed the lowest correction rate. Finally, the anger passage with the highest correction rate was “Anger15,” and the passage with the lowest correction rate was “Anger7” (Table 3).
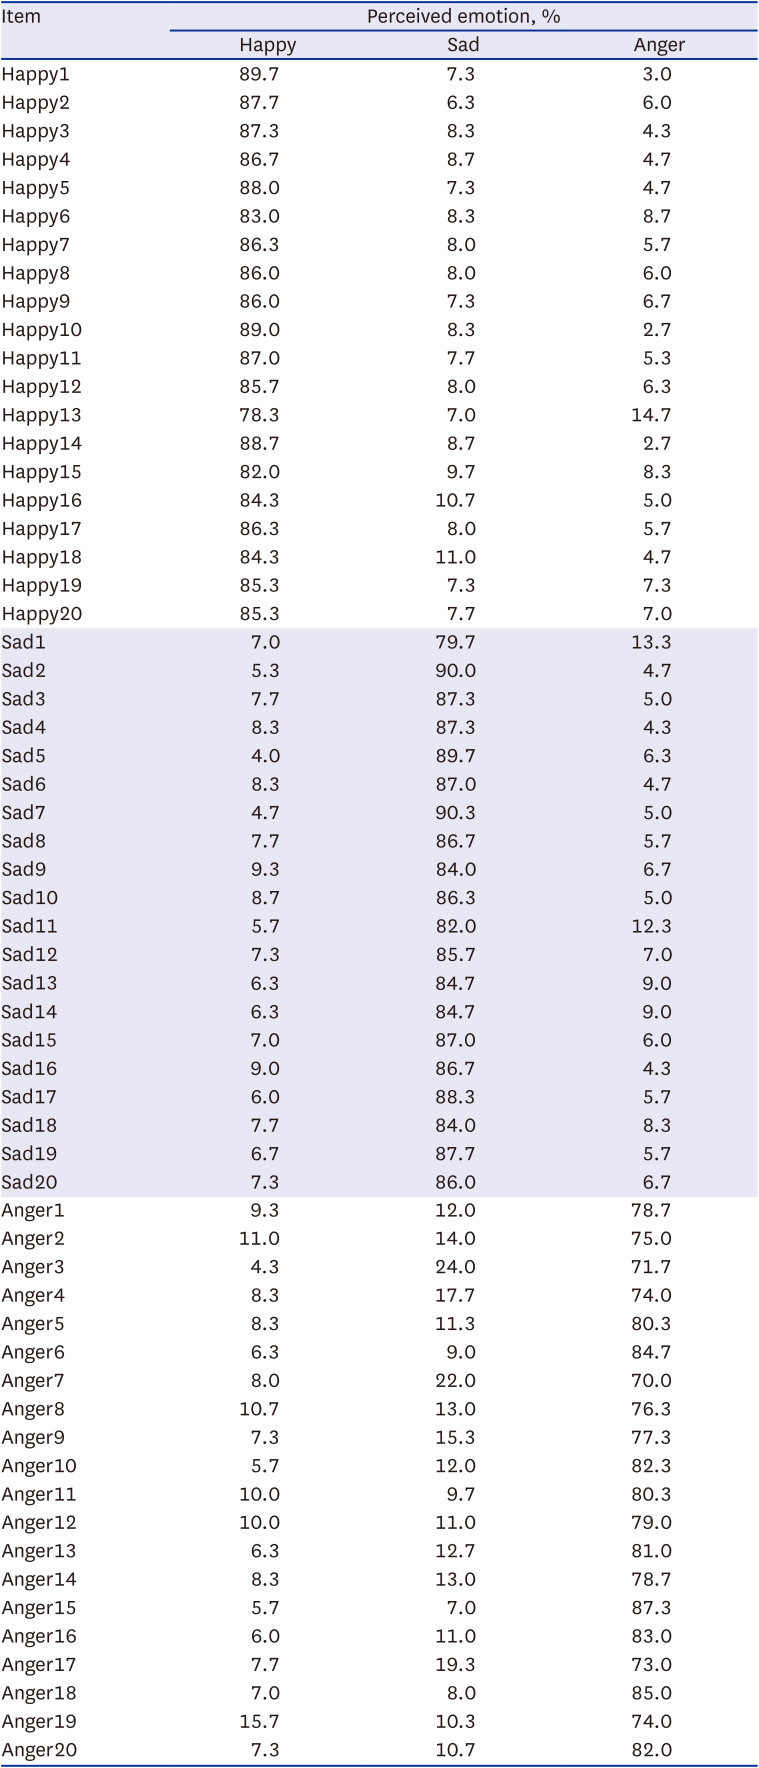
Table 3
Correction rates for the three perceived emotions
![]()
As an exploratory analysis, we evaluated the musical characteristics of the passages that received the highest correction rates in each affective category. The top three happy passages featured relatively fast tempi ranging from 138 to 168 bpm, with repetitive and predictable rhythmic patterns consisting mainly of equally divided eighth or sixteenth notes and multiple staccatos. Happy passages were all in a major mode, with a distinct melody line in a high register and a narrow range, and supported by simple accompaniment parts in a lower range. The melodic line was predictable, with a recurring melodic sequence and frequent stepwise motion. The dynamic levels were medium to loud with no sudden changes, and all pieces were played on a piano. In terms of musical genre, two of the top three happy passages were new age, and one was a classical pianist’s rendition of the opera Don Giovanni.
The top three sadness passages featured extremely slow tempi ranging from 35 to 66 bpm, with frequent use of long dotted note values and reserved rhythmic divisions. All sad passages were in a minor mode with a distinct melodic line appearing in the middle to lower range, and they had a combination of stepwise and intermittent leap patterns. In contrast, the accompaniment employed simple block-chord or arpeggio patterns. In terms of dynamic levels, sad passages were at the mid to quiet level with gradual changes. Two pieces featured a cello solo accompanied by a piano, and one excerpt was a piano solo. In terms of musical genre, one selection was classical and two were new age.
The anger passages showed extremely fast tempi with irregular beat patterns, making it difficult to detect the recurring pulse. Rhythmic patterns were unpredictable, with sudden changes and frequently used smaller rhythmic units. The melody and accompaniment parts were intermingled, making a clear distinction difficult and the melody unpredictable, with a wide range and abrupt changes. All three pieces were performed on the piano and generally were loud with sudden changes. In terms of genre, two of the selections were classical pieces composed by Rachmaninoff and Mussorgsky, and one was a video game soundtrack.
Reliability analysis and exploratory factor analysis
The reliability of the 60 musical passages was high (Cronbach’s α = 0.978). There was no significant difference in Cronbach’s α between the standard and corrected items when some items were removed (Cronbach’s α = 0.979). Hence, all 60 musical passages were retained for the analysis.
According to the EFA, the Kaiser-Meyer-Olkin (KMO) value was 0.969, and the result of Bartlett’s test of sphericity was significant (P < 0.001, χ2 = 12,996.759). The factor loading was > 0.4, and the three emotional factors were successfully constructed using the 60-item passage (Table 4).
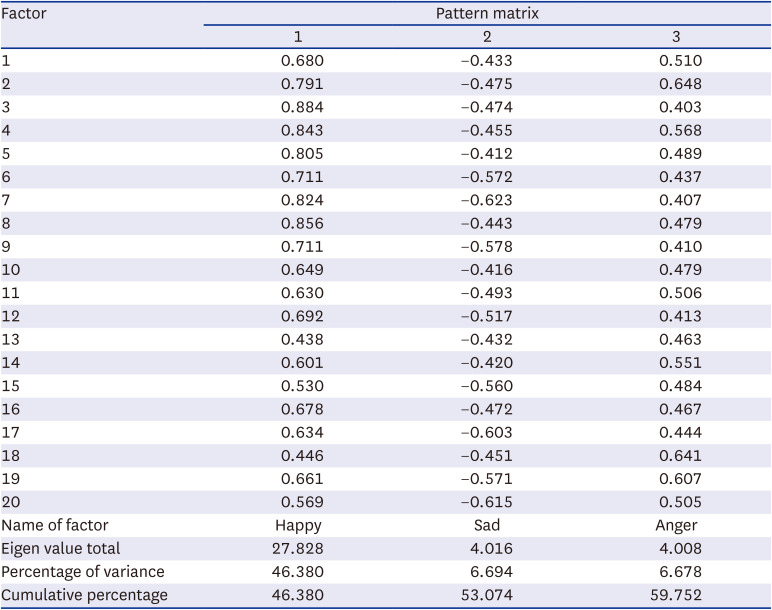
Table 4
Factor loading for the MPEP
Extraction method: maximum likelihood; rotation method: Oblimin with Kaiser normalization.
MPEP = musical passages for emotional perception test.
![]()
Cluster analysis of all participants
In the k-means cluster analysis of the 300 participants, the highest total scores among the general music emotion perception group (n = 60) and the low music emotion perception group (n = 11) were selected as initial seeds (centroids) of the respective groups. The final centroid and mean ± standard deviation of the general perception group’s total music emotion perception scores were 55 and 55.21 ± 13.81, respectively. The corresponding scores of the low perception group were 28 and 28.03 ± 13.81, respectively. Following the k-means cluster analysis, 185 participants were classified into the general music emotion perception group and 115 into the low music emotion perception group (F = 1,120.63, P < 0.001). Based on these results, the cut-off score of the low emotion perception group was 41.
Determining the low music emotion perception group
Of the three models suggested in the current study, only model 3 was significantly associated with the low music emotion perception group. In model 3 (model 2 + music perception), the model χ2 (240.3, P < 0.001) and Nagelkerke’s R2 (0.735, 73.5% of the variance in the dependent variable of the low perception group) indicated that the model was adequate for predicting the low music emotion perception group. As mentioned before, the low emotion perception group was defined by an MPEP score below 41. With step χ2 (227.8, P < 0.001), music perception items could predict the low music emotion perception group. According to the Wald statistics for all independent variables, happiness, sadness, anger, and total item scores were significant predictors of improved low music emotion perception (Table 5).
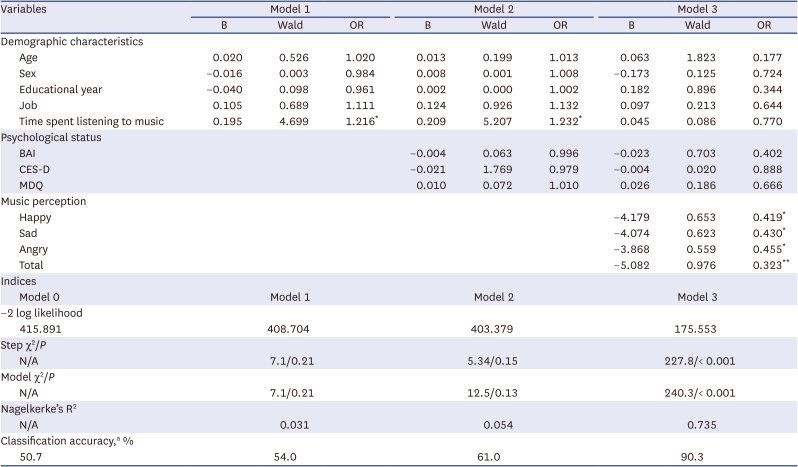
Table 5
Hierarchical logistic regression analysis
Model 1: demographic characteristics; Model 2: demographic characteristics + psychological status; Model 3: demographic characteristics + psychological status + music perception.
OR = odds ratio, BAI = Beck Anxiety Inventory, CES-D = Center for Epidemiologic Studies Depression Scale-Revised, MDQ = Mood Disorder Questionnaire, N/A = not applicable.
aClassification accuracy: dependent variable, low music emotion perception scale group.
*P < 0.05, **P < 0.01.
![]()
DISCUSSION
The MPEP has high reliability and supports the construction of three factors for identifying emotional perceptions of happiness, sadness, and anger. The cut-off score for low emotion perception was 41. Neither psychological status nor individual demographic characteristics affected emotional perception as assessed by the MPEP.
According to the reliability test and factor analysis, the current results showed that musical passages could assess emotional perception abilities in the general population. Perceived emotions were classified into three categories: happy, sad, and angry. While several trials have used music to investigate perceived emotions,2021 the MPEP is the first trial, to the best of our knowledge, that systematically identified musical passages for the development of a music-based emotion perception test. Using musical passages for the three emotions, the MPEP could detect individuals with and without an adequate ability to recognize emotions.
The musical passages with the highest ratings under each affective category shared musical traits that resembled the typical characteristics of musical pieces used in MER studies. For example, the sadness passages in the MPEP also demonstrated the traits of melancholic music specified by Huron41; they were quiet, slow, low in pitch, minor in mode, and legato. Juslin et al.42 utilized cello music to induce sadness in listeners, with the rationale that the cello has the “sound closest to the human voice.” Interestingly, two of our sad passages involved cello solos. The music for anger showed traits reported by Mohn et al.,43 which included loud volumes, rapid tempos, and tempo changes. Likewise, the happy passages shared characteristics like major mode, relatively fast tempi, and use of staccatos.2543 These resemblances are meaningful as they provide support for the identified musical passages. We plan to conduct an in-depth analysis of all the MPEP passages to investigate whether the degree of such musical traits is associated with the intensity of emotions perceived by the participants.
In a comparison of correction rates for the three types of passages, the mean score for anger was lowest with the greatest variance (78.68 ± 4.73) compared with happiness (85.85 ± 2.62) and sadness (86.26 ± 2.6). This variance can be explained in two ways. Huron attributes such variance to people’s conceptual differences in perceiving anger as either cold or hot. Cold anger refers to an unexpressed furious feeling that is not easily noticeable, whereas hot anger is distinctive and accompanied by outbursts.44 Another explanation for this variance is similarities in valence and arousal levels. According to the arousal and valence dimensions often used to classify emotional stimuli, happiness is located in the top-right corner, indicating a pleasant valence and high arousal,45 whereas sadness is located in the bottom-left corner, indicating an unpleasant valence with low arousal.46 Anger is placed at the top-left corner, with high arousal and an unpleasant valence, meaning that anger shares certain characteristics with happiness and sadness.47 Thus, a listener may only focus on one aspect of emotion appraisal, leading to a higher disagreement rate for anger music.
Moreover, we need to consider alexithymia when interpreting these outcomes. Alexithymia refers to difficulties in acknowledging, explaining, and differentiating emotions, and it affects 5% to 19% of the general population.4849
Interestingly, alexithymia’s prevalence seems to explain the disagreement rate observed in this study. Given that the MPEP was designed to screen the ability to perceive emotion, members of the low music emotion group with scores of 41 should be regarded as having low sensitivity for emotional perception through music. From this perspective, further studies are needed to evaluate the possibility of implementing the MPEP for screening people with alexithymia and other psychological conditions that interfere with emotion recognition. Furthermore, future research should incorporate both music- and non-music-based emotion recognition tests, comparing neurotypical groups with experimental groups of people who have psychological conditions.
One controversy surrounding MER studies is that some variance exists in the degree or type of emotions perceived through music, which can be explained in different ways. Levinson argued that people often experience more than one emotion at a time.50 As music conveys complex emotions, it is difficult to analyze dichotomously. One’s mental health status and personality traits often affect the level of response to music.12 Emotional responses to music also are related to cognitive status, physiological arousal, motor behavior, and subjective feelings.
However, in this study, hierarchical multiple regression analysis showed that emotion perception of musical passages was unaffected by participants’ demographic characteristics and psychological status, suggesting that such factors did not yield significant differences among the analyzed subgroups. In other words, the MPEP could assess emotional perception unaffected by individual emotional conditions or demographic factors. Further studies should be conducted to test the reliability of musical passages across different age groups and personality traits that were not investigated in this study.
This study had some limitations. First, the possibility of reporting bias should be considered, as the collected data were based on online self-report questionnaires. Based on previous studies, we set the duration of the musical passages to 15 seconds. While the study outcome may support the use of a 15-second passage to elicit emotions in listeners, some could argue that 15 seconds may not be long enough. Thus, further investigation might be helpful in comparing reactions among listeners for different durations.
Second, the one-sided phase 1 study population consisting almost entirely of women could have affected music passage recognition. Several studies have suggested that musical recognition sensitivity could be influenced by age and gender.51 The gender sensitivity of music recognition should be considered for future study. Third, we did not control for the extensiveness of musical training or background among the participants. Although we excluded those with music-related degrees or careers, some participants may have had extensive musical training, possibly affecting the study outcomes. Finally, one should be mindful that this was a preliminary study aimed at identifying musical passages that could be used to develop a music-based emotion perception test in the near future. Thus, our study outcomes should not be generalized to include musical passages other than those assessed.
In conclusion, the musical passages assessed in this study for emotion perception presented highly viable options for evaluating an individual’s emotional perception without the interference of demographic or psychological status. Carefully selected musical passages verified by a group of experts and healthy adults showed more than sufficient inter-rater agreement. Consequently, we conclude that musical passages can serve as a tool for assessing the ability to recognize happiness, sadness, and anger.
Further studies are needed to test the reliability and validity of the MPEP. First, we developed a unity-based application to assess the level of emotional perception using MPEP. Initially, we plan to implement the application for IDDs and then expand it to people with other health needs to field-test the MPEP in conjunction with a preexisting facial emotion assessment tool. Second, we propose a thorough analysis of the musical characteristics of the passages included in the MPEP and the identification of musical elements corresponding to each emotion category. Such an evaluation could improve the validity of the MPEP and lead to a better understanding of reliable musical passages for MER studies.
 XML Download