

 PDF
PDF Citation
 Print
Print


INTRODUCTION
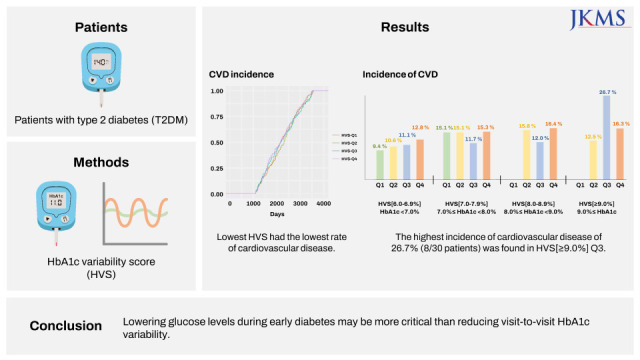
The initial treatment goal for patients with type 2 diabetes (T2DM) is glycemic control, and glycated hemoglobin (HbA1c) is an easy measure to determine the glycemic control trend over 2–3 months.1 Because every 1% reduction in HbA1c levels reduces the risk of diabetic complications by 12–43%, several guidelines recommend a strong HbA1c reduction in patients with T2DM as a top priority.234 However, in the Action to Control Cardiovascular Risk in Diabetes trial, glycemic control close to normoglycemia increased mortality and the number of cardiovascular events.5 Consequently, reaching a set goal by exclusively controlling blood glucose levels does not appear to be suitable. Therefore, interest in glycemic variability has increased in addition to traditional blood glucose control based on fasting blood glucose, postprandial blood glucose, and HbA1c levels. Previous studies have reported that complications from diabetes can be minimized by reducing glycemic variability.678
It is well known that glycemic variability influences the development of cardiovascular disease (CVD).89 Patients with a high baseline HbA1c generally show a higher tendency for glycemic variability after aggressive treatment, whereas those with a low baseline HbA1c have relatively small variability. However, the question that still requires an answer is whether a combination of low glycemic variability and high HbA1c status or vice versa leads to a higher incidence of developing CVD. In addition, there is a paucity of long-term studies on glycemic variability in relation to baseline HbA1c levels. Therefore, it is necessary to investigate the risk of CVD according to the glucose control status during early diabetes. In this study, we investigated the difference in HbA1c variability according to the baseline HbA1c level for the first 3 years after initial presentation to determine the risk of CVD.
METHODS
Study population and design
This 9-year retrospective cohort study was conducted to determine the incidence of CVD among patients with T2DM who first visited Seoul St. Mary’s Hospital in Korea. For 3 years, from July 1, 2009 to December 31, 2011, patients ≥ 40 years old who were diagnosed with T2DM and visited our hospital for blood glucose control for the first time were included in this study.
The date of the first visit was designated as the index date (Fig. 1). Patients with CVD prior to the index date were excluded from this study. The total study duration, beginning from the index date, was 9 years and sequentially included a 3-year observation window, buffering window, and target outcome window. During the initial observation window, HbA1c levels were measured. After the buffering period, in the last 3 years (target outcome window), the patients were evaluated for CVD. Based on the HbA1c values obtained within the observation window, we calculated the visit-to-visit HbA1c variability. Only patients with at least one HbA1c measurement a year and at least three times in total were included in the study. Patients who were diagnosed with CVD within the buffering window were excluded.
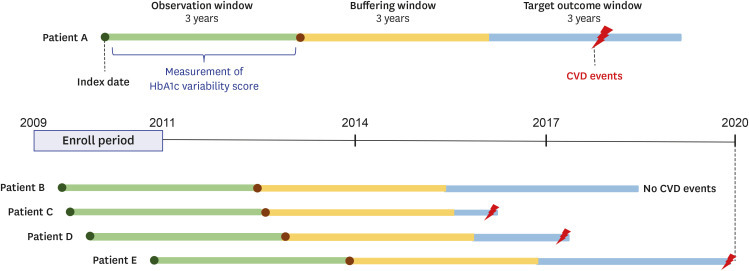
Fig. 1
The 9-year research design showing the observation, buffering and outcome windows (3 years each). The observation window indicates the first detection of type 2 diabetes, and the target outcome window indicates the detection of CVD after the 3-year buffering window.
CVD = cardiovascular disease, HbA1c = glycated hemoglobin.
![]()
Personal information, such as age, sex, height, weight, body mass index (BMI), systolic blood pressure, and diastolic blood pressure, were collected during the observation period. In addition, blood urea nitrogen, creatinine, estimated glomerular filtration rate, aspartate transaminase, alanine transaminase, total cholesterol, triglyceride, high-density lipoprotein cholesterol, low-density lipoprotein cholesterol, and blood laboratory test results were collected. The potential prescription of 3-hydroxy-3-methylglutaryl coenzyme A reductase inhibitors (statins), insulin, and blood pressure medications, such as angiotensin-converting enzyme inhibitors, angiotensin II receptor blockers, and calcium channel blockers was evaluated.
The 10th revision of the International Statistical Classification of Diseases and Related Health Problems (ICD-10 classification) was used for the operational definition of CVD in the target outcome window. CVDs included stroke or transient ischemic attack (ICD-10 I60–66, I67.2, I67.8, I69, G45), ischemic heart disease (ICD-10 I20–25), aortic aneurysm (ICD-10 I70–72), and peripheral artery disease (ICD-10 I73). Among the patients diagnosed during the study period, those who underwent the following procedures were included in this study: percutaneous coronary intervention, peripheral angiography, coronary artery bypass graft surgery, graft angiography, and aortic surgery (endovascular repair of aortic aneurysms or thoracic endovascular repair of the aorta).
Visit-to-visit HbA1c variability
In this study, the HbA1c variability score (HVS) was used to measure visit-to-visit HbA1c variability.710 HVS values were divided into quartiles to compare the incidence rates of each type of CVD. To evaluate the validity and reliability of a specific HVS in this study, the standard deviation of HbA1c (HbA1c-SD), coefficient of variation of HbA1c (HbA1c-CV), and adjusted standard deviation of HbA1c (adjusted-HbA1c-SD), which are additional indicators of blood glucose variability, were also measured.1112 Given that the baseline HbA1c value likely affects the HVS, we calculated the mean HbA1c for the observation window. After each HVS was calculated, the derived values were divided into quartiles of < 7%, 7–7.9%, 8–8.9%, and ≥ 9% according to the baseline HbA1c value.
Direct chart review
The most important part of a retrospective cohort study is the verification of the operational definition of the disease.1314 Among the patients who visited the endocrinology department for the first time, patients with diabetes according to ICD-10 classification (E11–14) were first selected. Afterward, patients with a first diagnosis of diabetes were screened by direct chart review. Here, 3% of the total number of samples was randomly selected to determine the accuracy of the operational definition of our research design. An endocrinologist with more than 10 years of experience directly reviewed the charts. Ultimately, it was confirmed whether the study design and operational definitions deployed in this study were consistent with those in the actual medical chart.
Protection of privacy
All personal information and personally identifiable information were deleted from the data extracted in this study, and random numbers were assigned; the data were stored as an encrypted file on the principal investigator’s encrypted computer. An additional encrypted file was required to re-identify the anonymized file, which was stored on an additional encrypted computer; only the principal investigator had access to all of these. For statistical analysis, the principal investigator sent exclusively anonymized data to the statistician.
Statistical analysis
Data are expressed as mean ± SD for continuous variables and numbers with percentages for categorical variables. The patients were grouped by quartile based on their initial HVS. P values were calculated using a t-test for continuous variables and a χ2 test or Fisher’s exact test for categorical variables. All statistical analyses were performed using SAS (version 9.4; SAS Institute, Cary, NC, USA), and P values < 0.05 were considered statistically significant.
Ethics statement
As this was a retrospective cohort study, we used data from patients who had already passed the time of treatment. Therefore, this study does not pose a physical or psychological risk to the patients, and patient consent was not required. This study was approved by the Institutional Review Board (IRB) of The Catholic University of Korea (IRB No. KC21RISI0673), and all guidelines were followed.
RESULTS
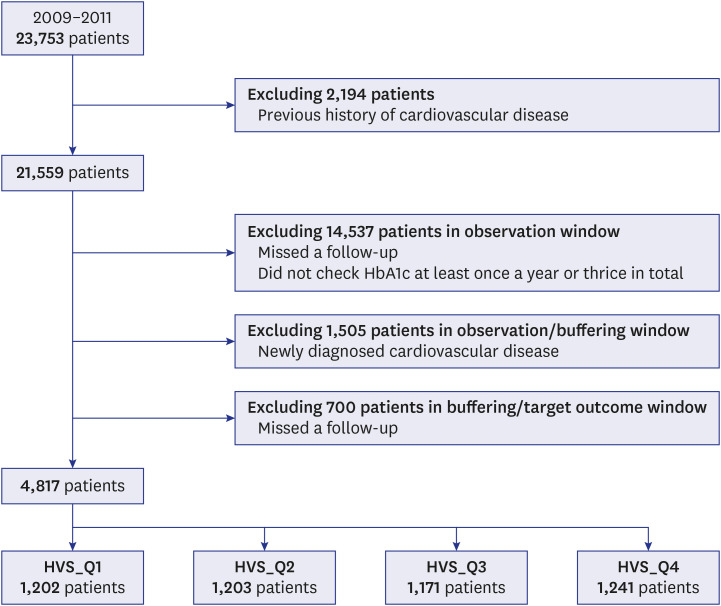
A total of 23,753 patients aged ≥ 40 years were diagnosed with T2DM (Fig. 2). Among them, 14,537 patients who missed a follow-up within the observation window or who did not undergo tests for HbA1c measurement at least once a year or at least three times during the observation window were excluded. Additionally, 2,194 patients with a previous history of CVD and 1,505 patients with newly diagnosed CVD within the buffering window were excluded. Finally, after excluding 700 patients who did not present at follow-up within the buffering window and target outcome window, 4,817 patients were included in this study.
Baseline characteristics
The mean age was 59.9 ± 9.8 years (Table 1). After dividing the HVS into quartiles, HVS_Q1 was < 12.5, HVS_Q2 was 12.5–29.9, HVS_Q3 was 30–49.9, and HVS_Q4 was ≥ 50. The mean BMI was 24.2 ± 3.3 kg/m2, and the mean HbA1c was 7.2 ± 1.4%. The average HbA1c values of HVS_Q1, HVS_Q2, HVS_Q3, and HVS_Q4 were 6.4 ± 0.8%, 7.0 ± 1.3%, 7.4 ± 1.4%, and 8.0 ± 1.7%, respectively (trend P value < 0.001). Within the 3-year observation window following the index date, insulin was used in 9.0% (108/1,202), 20.8% (250/1,203), 34.6% (405/1,171), and 50.0% (621/1,241) of patients in HVS_Q1, HVS_Q2, HVS_Q3, and HVS_Q4, respectively (trend P < 0.001). However, there was no significant difference in the proportions of patients using statins within the different quartiles, namely HVS_Q1 = 68.3% (821/1,202 patients); HVS_Q2 = 70.7% (850/1,203 patients); HVS_Q3 = 72.2% (846/1,171 patients); and HVS_Q4 = 70.7% (878/1,241 patients) (trend P value = 0.133).
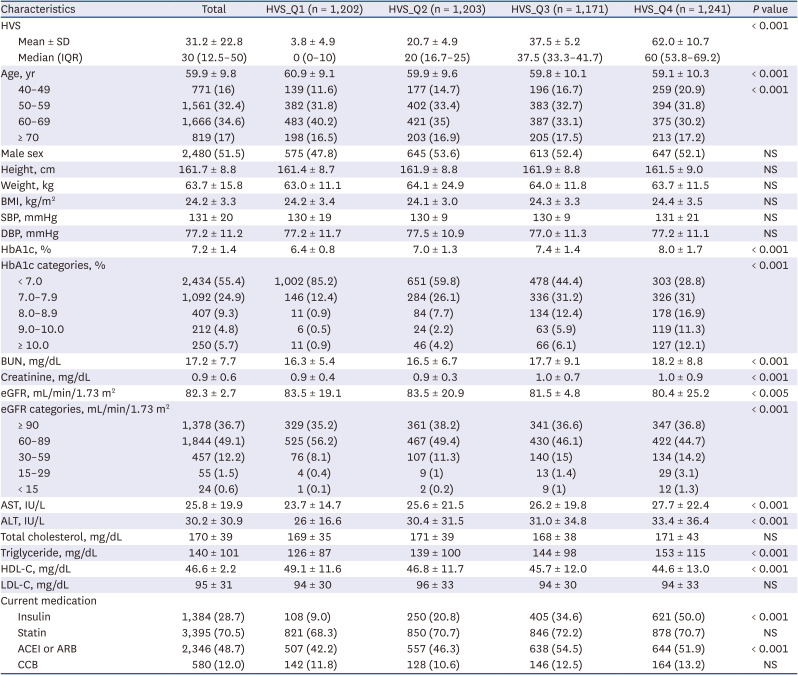
Table 1
Baseline characteristics by group (n = 4,817)
Data are expressed as the number of patients (percentage of total), mean ± SD, and median (IQR).
SD = standard deviation, HVS = glycated hemoglobin variability score, ACEI = angiotensin-converting enzyme inhibitor, ARB = angiotensin II receptor blocker, AST = aspartate aminotransferase, ALT = alanine aminotransaminase, BMI = body mass index, BUN = blood urea nitrogen, CCB = calcium channel blocker, DBP = diastolic blood pressure, eGFR = estimated glomerular filtration rate, HDL-C = high-density lipoprotein cholesterol, IQR = interquartile range, LDL-C = low-density lipoprotein cholesterol, SBP = systolic blood pressure, statin = 3-hydroxy-3-methylglutaryl coenzyme A reductase inhibitor, NS = not significant, HbA1c = glycated hemoglobin.
![]()
Comparison of HbA1c variability
Given the scarcity of studies on the HVS, we assessed HbA1c-SD, HbA1c-CV, and adjusted-HbA1c-SD in addition to the HVS (Table 2). The HbA1c-SD was 0.3 ± 0.3, 0.6 ± 0.5, 0.7 ± 0.5, and 1.1 ± 0.8 in HVS_Q1, HVS_Q2, HVS_Q3, and HVS_Q4, respectively; the differences between HbA1c-SD of all HVS_Q groups were significant (all P < 0.001). We obtained HbA1c-CV values of 0.04 ± 0.04, 0.10 ± 0.10, 0.10 ± 0.10, and 0.20 ± 0.10 in HVS_Q1, HVS_Q2, HVS_Q3, and HVS_Q4, respectively (all P < 0.001). The adjusted-HbA1c-SD were 0.2 ± 0.3, 0.6 ± 0.5, 0.7 ± 0.5, and 1.1 ± 0.7 in HVS_Q1, HVS_Q2, HVS_Q3, and HVS_Q4, respectively (all P < 0.001).
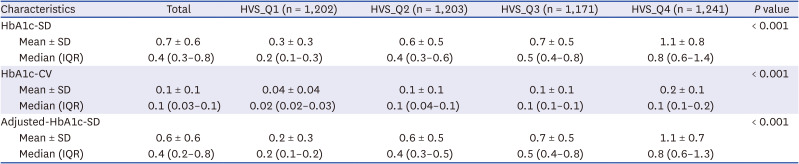
Table 2
Comparison of HbA1c variability to evaluate the reliability of the calculated HbA1c variability score
The P values are calculated using the t-test for continuous variables and the χ2 test or Fisher’s exact test for categorical variables.
HbA1c = glycated hemoglobin, HVS = glycated hemoglobin variability score, adjusted-HbA1c-SD = adjusted standard deviation of glycated hemoglobin, HbA1c-CV = coefficient of variation of glycated hemoglobin, HbA1c-SD = standard deviation of glycated hemoglobin, SD = standard deviation, IQR = interquartile range.
![]()
Blood glucose variability according to baseline HbA1c
At a baseline HbA1c of < 7.0% (6.0–6.9%) the HVS_Q1 group with the lowest blood glucose variability had the lowest rate of CVD at 9.4% (104/1,109 patients) (Fig. 3). As the HVS increased, the incidence of CVD also tended to increase, although there was no statistically significant difference (P = 0.064). However, the HVS [7.0–7.9%]_Q1 group showed a statistically significant decrease in the incidence of CVD compared to all HVS [all]_Q4 groups (P = 0.001 for HVS [7.0–7.9%]_Q4, P = 0.011 for HVS [8.0–8.9%]_Q4, and P = 0.012 for HVS [≥ 9.0%]_Q4) (Fig. 3). The HVS [6.0–6.9%]_Q2 group showed a significantly lower CVD incidence rate than the HVS [7.0–7.9%]_Q2 group (10.6–15.1%, P = 0.042), HVS [7.0–7.9%]_Q4 group (10.6–15.3%, P = 0.011), HVS [8.0–8.9%]_Q4 group (10.6–16.4%, P = 0.010), and HVS [≥ 9.0%]_Q3 group (10.6–26.7%, P = 0.013).
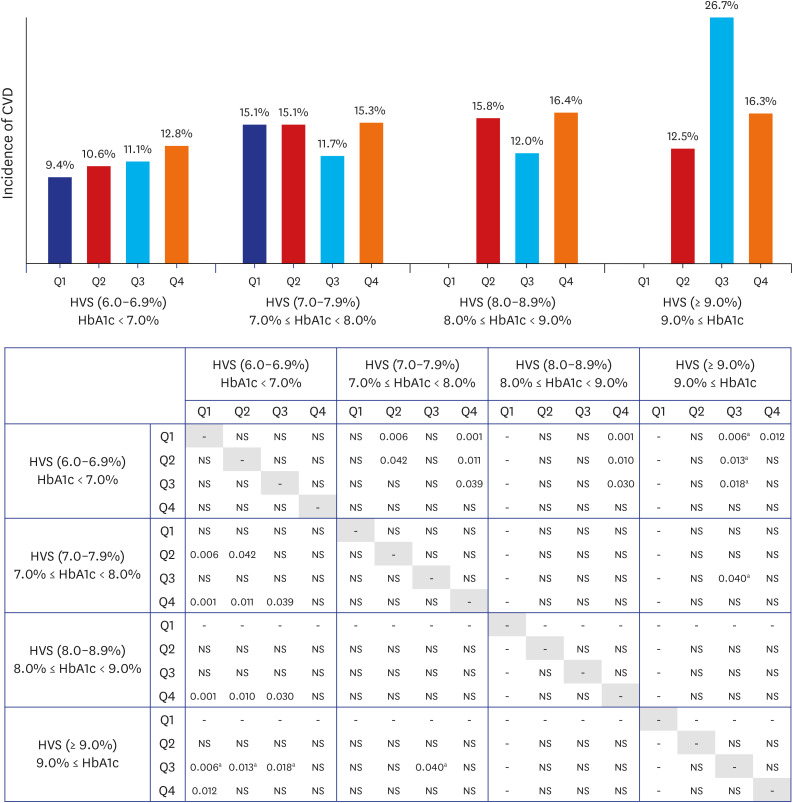
Fig. 3
Comparison of the incidence of CVD according to baseline HbA1c and the HVS P values were calculated using the χ2 test or aFisher’s exact test for categorical variables.
HbA1c = glycated hemoglobin, HVS = glycated hemoglobin variability score, NS = not significant, CVD = cardiovascular disease.
![]()
The groups with baseline HbA1c 7.0–8.0% (P = 0.903) and 8.0–9.0% (P = 0.459) did not show differences in the incidence of CVD according to the HVS. There was no HVS_Q1 in the groups with a baseline HbA1c of 8.0–9.0% and ≥ 9.0%.
Within the group with a baseline HbA1c of ≥9.0%, the incidence of CVD in HVS [≥ 9.0%]_Q3 was 26.7% (8/30 patients), showing the highest CVD incidence. The incidence for developing this disease was significantly higher in the HVS [≥ 9.0%]_Q3 group than in the HVS [6.0–6.9%]_Q1 group (P = 0.006), HVS [6.0–6.9%]_Q2 group (P = 0.013), HVS [6.0–6.9%]_Q3 group (P = 0.018), and HVS [7.0–7.9%]_Q3 group (P = 0.040).
When comparing only the same quartiles, the risk of developing CVD increased with an increasing baseline HbA1c level. However, in the case of HVS [≥ 9.0%]_Q2, the incidence of CVD was low (12.5%, 1/8 patients).
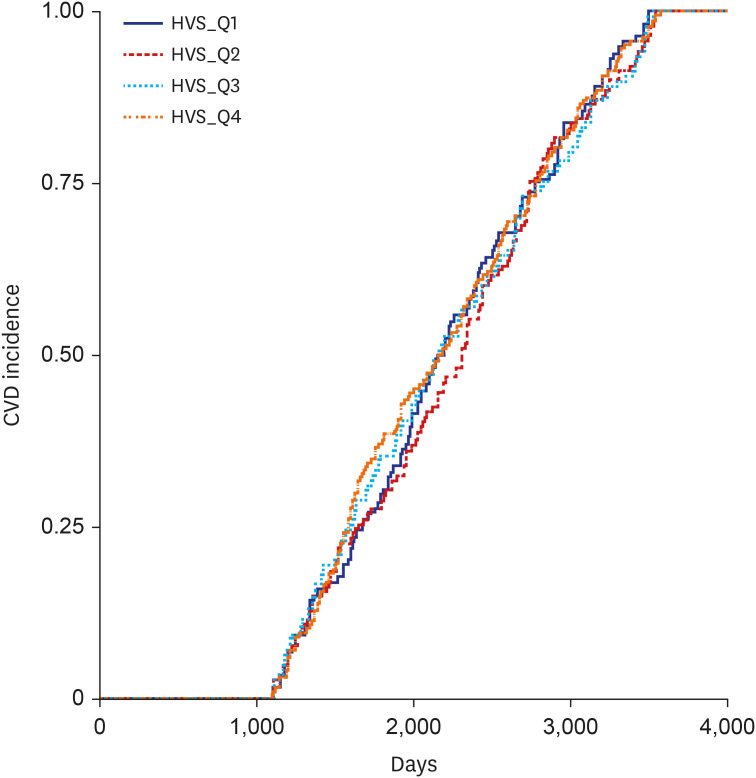
Time point of developing CVD
The average onset of CVD was 2,230 ± 705 days from the index date (Fig. 4). We found no differences between quartiles regarding the time point at which CVD was first diagnosed (P = 0.613 between Q1 and Q2, P = 0.957 between Q1 and Q3, P = 0.762 between Q1 and Q4, P = 0.650 between Q2 and Q3, P = 0.383 between Q2 and Q4, and P = 0.714 between Q3 and Q4). Similarly, in the multivariate analysis that adjusted for age, sex, and BMI, no significant difference by HVS_Q was shown (Supplementary Table 1).
DISCUSSION
Many recent studies have demonstrated that both aggressive blood glucose control during the early stages of diabetes315 and glycemic variability are important risk factors for CVD.89 To the best of our knowledge, this is the first long-term study to analyze the importance of both HbA1c change and visit-to-visit HbA1c variability during the first 3 years of outpatient visits after initial presentation.
Short-term blood glucose variability indicates glycemic variability, whereas long-term blood glucose variability indicates HbA1c variability.45 As this was a long-term study, the association between HbA1c variability and incidence of CVD was determined.6 Among the various methods to measure long-term HbA1c variability, we used the HVS rather than HbA1c-SD, HbA1c-CV, or adjusted-HbA1c-SD, all of which may be suitable for this purpose in other studies. However, although few studies have used the HVS, from a clinical perspective, it is said to be more translatable and more easily interpretable than HbA1c-SD, HbA1c-CV, or adjusted-HbA1c-SD.57 Therefore, we also calculated the HbA1c-SD, HbA1c-CV, and adjusted-HbA1c-SD for each HVS_Q group to reduce bias and verify the reliability and suitability of the HVS in this context (Table 2). Because the same results were obtained for each HVS_Q group, we could estimate the potential objectivity and suitability of the HVS in this study.
In this study, we found that if the mean HbA1c of the observation period (first 3 years) was lower than 7.0%, the incidence of CVD was lower than that of other HbA1c groups. Conversely, within the group with an HbA1c of < 7.0%, there was no significant difference in cardiovascular events by HVS_Q. However, as the HVS_Q increased, the incidence of CVD also showed a tendency to increase, meaning that exposure to hypoglycemia or hyperglycemia was high,5 which likely had a significant impact on the occurrence of CVD. Taken together, when the baseline HbA1c level is less than 7.0%, it can be estimated that blood glucose variability plays a significant role in the development of CVD. This is in line with previous reports showing that blood glucose variability played an important role in patients with an HbA1c of 6.9% or less, which is relatively close to normal.16 Although we found the glycemic variability to be an important measure in addition to the HVS, during the early stage of diabetes, the hypoglycemic effect appears to be more important for the prevention of CVD than glycemic variability. Ultimately, it is most important to maintain a low HbA1c level, preferably within the range at which hypoglycemia does not occur. In our study, the measurement of the HVS was limited to the first 3 years after the diagnosis of T2DM; therefore, future studies with a longer-term HVS assessment will be needed.
There was no difference in the incidence of CVD by HVS_Q in patients with an HbA1c level of 7.0–7.9% or 8.0–8.9%; however, blood glucose control was found to be more important in these patient groups than in those with an HbA1c level < 7.0%, the initial average. Considering the high average blood glucose levels in patients with an HbA1c level ≥ 9.0%, it is not surprising that the overall risk of cardiovascular events was higher in these patients than in those with an HbA1c level < 7.0%. Although the difference was not statistically significant, HVS_Q3, not HVS_Q4, had the highest incidence of CVD. This surprising finding could be explained by the fact that high blood glucose variability in an already high blood glucose level may reflect the number of times the blood glucose level improved. Realistically, in patients with a high baseline HbA1c level ≥ 9.0%, it would be advantageous to strongly lower the blood glucose level, in which case the blood glucose variability would increase. Designating the interval of HbA1c with a small interval of 1.0% may be one of the reasons. The difference in the incidence rate starts to show only when there is a difference between HVS [6.0–6.9%] and HVS [≥ 9.0%] (Fig. 3). Whether a constantly high blood glucose level or high variability in the blood glucose level increases the risk of developing CVD is unclear. One study observed that apoptosis increased more in the group with severe blood glucose fluctuations than in the group with consistently high blood glucose levels.17 However, we found that the HbA1c variability was affected differently according to the diabetes control status (baseline HbA1c). Therefore, according to this study, it may be more important to significantly lower blood glucose levels rather than variability, particularly in patients with high blood glucose levels, during the early stage of diabetes; thus, the blood glucose variability should be considered thereafter.
Reducing glycemic variability in this study may have contributed to a reduction in cardiovascular complications. Various studies have reported that high glycemic variability increases the incidence of CVD.89 For this reason, we focused on the need for lowering HbA1c levels to the target and reducing glycemic variability.1819 It should still be kept in mind that a strong reduction in blood glucose at high HbA1c levels increases glycemic variability. In this study, HVS_Q4 with an HbA1c of less than 7.0% showed a higher tendency to develop CVD than HVS_Q2 with an HbA1c of 9.0% or higher. However, it was difficult to make direct comparisons and draw conclusions because the number of groups with low blood glucose variability was very small when HbA1c was 9.0% or higher. Unfortunately, from these results alone, it is difficult to infer whether high glycemic variability combined with low HbA1c levels or low glycemic variability at high HbA1c levels leads to an increased incidence of CVD. In conclusion, both HbA1c levels in early diabetes and visit-to-visit HbA1c variability are important considerations; nevertheless, early glycemic control should be prioritized, and this is the first study to confirm this.
In a retrospective cohort study using the HVS in patients newly diagnosed with T2DM, the occurrence of cardiovascular events was greater in the group with the highest HVS as opposed to that with the lowest HVS.7 Therefore, it is argued that an increased visit-to-visit HbA1c variability should be viewed as an independent risk factor that worsens the prognosis of diabetes patients. However, since the HVS was an exclusive measure, the actual blood glucose control status could not be identified in that study, which was amended in the present study. In clinical practice, it is necessary to simultaneously maintain HbA1c levels at the target level and to manage glycemic variability in patients with diabetes.
In the HVS [6.0–6.9%], HVS [7.0–7.9%], HVS [8.0–8.9%], and HVS [≥ 9%] groups, the incidence of CVD is variable, in particular Q2, Q3, and Q4. Fig. 3. demonstrates that the highest incidence of CVD was Q3 in the HVS [≥ 9%] group. It is likely that the difference in the number of samples for each group also had a significant effect. In fact, among 4,817 patients, the baseline HbA1c ≥ 9.0% group accounted for only 3.6% of the total patients (173/4,817). Among them, 30 patients had HVS [≥ 9.0%]_Q3 and 135 patients had HVS [≥ 9.0%]_Q4. Since the absolute number was small in HVS [≥ 9.0%]_Q3, the incidence of CVD was relatively increased in HVS [≥ 9.0%]_Q3. Although there are many limitations, as we mentioned above, it is worth paying attention to the overall large trend in which the incidence of CVD increases as the baseline HbA1c or HVS increases.
It is not easy to compare the incidence of specific diseases in a retrospective cohort study. This is because different results are derived depending on the research design, methods used, period of observation, average HbA1c levels, and the characteristics of enrolled patients. Accordingly, the relationship between HbA1c variability and cardiovascular risk in patients with T2DM differs among studies. Most found that a reduction in HbA1c variability helped reduce the development of CVD,78 while others have revealed that HbA1c variability was not an independent variable affecting cardiovascular risk.2021 Moreover, depending on the characteristics of a retrospective cohort study, different results may be obtained depending on the study design;1322 we designed this study by referring to various published studies on the incidence of various diseases to analyze these conflicting findings.232425 In retrospective cohort studies, the duration of the observation, target outcome, and buffering windows may not be clearly defined.26
If the observation window is long, the number of participants can be secured, but the number of cardiovascular events will be small. If the buffering window becomes smaller, the possibility of cardiovascular events due to causes other than blood glucose variability increases. Therefore, in such a study, it is important to have a large sample size, sufficient buffering window period to evaluate the number of cardiovascular events within the target outcome window. In this study, to have objective confidence in the incidence of CVD, the observation window, buffering window, and target outcome window were set to 3 years each. Assessing the occurrence of CVD in the buffering window ensured that it was unrelated to blood glucose variability in the observation window. Although there may be differences in the incidence of CVD according to the presence or absence of buffering periods, such periods have been used in many previous studies.2728 While 3 years may not be particularly long for a target outcome window, considering the duration of the entire study, it was judged to be reasonable. Ultimately, this study is a long-term, meticulously planned study examining the occurrence of CVD over a total of 9 years, with the measurement of blood glucose variability during the first 3 years of outpatient visits.
This study has some limitations. First, ascertaining a causal relationship is challenging owing to the retrospective study design.1322 This is because electronic medical records do not contain data on various confounding factors that could affect the results. For example, it may change with cardiovascular risk based on the duration of diabetes. However, it is not easy to confirm the duration of diabetes even after a direct chart review by an endocrinologist. Other than the various factors included in the study, further confounding factors that may have affected the results could not be identified; to minimize potential confounders, the study design was carefully developed based on previous studies.2324252728 Second, the operational definition of CVD in the target outcome window may also have some limitations, although both the ICD-10 classification and all the necessary treatment codes for diagnosing CVD were considered to avoid misdiagnoses. In particular, although an expert’s direct chart review was performed for the first diagnosis of diabetes, CVD was determined based on an operational definition. Third, the difference in the cardiovascular outcomes according to the duration of the observation, buffering, and target outcome windows could not be determined.
We found that patients with good initial blood glucose control had a low incidence of CVD. Even if the baseline HbA1c reached the target level, the occurrence of CVD tended to be high when the visit-to-visit HbA1c variability was high, confirming that both mean blood glucose and glycemic variability are important. Altogether, in the early stages of diabetes, reducing the glucose level seems to be more important than reducing glycemic variability. Of course, careful attention is still needed in the interpretation of the results of the retrospective cohort study. A large-scale, long-term study is needed on visit-to-visit HbA1c variability and the identification of factors contributing to its increase. In addition, improving the average blood glucose level and maintaining a stable visit-to-visit HbA1c variability is important for long-term diabetes management and the prevention of complications. It is expected that the results of this study will serve as a basis for future randomized controlled studies.
 XML Download