

 PDF
PDF Citation
 Print
Print


INTRODUCTION
Magnesium is an essential nutrient and the fourth most mineral in the human body. It plays an important role in physiological processes such as protein synthesis, energy and glucose metabolism, and cell replication [1]. It also affects muscle contraction and relaxation, neurological functions, release of neurotransmitters, and blood pressure regulation [23].
Magnesium levels in the body remain within a certain range depending on the homeostatic mechanisms controlled by intestinal adsorption and tubular reabsorption [1]. Thus, magnesium deficiency, which is entirely due to the low intake of dietary magnesium, is rare. However, long-term insufficient intake of magnesium, the use of drugs, and specific health conditions which cause magnesium wasting may result in magnesium deficiency. Magnesium is abundant in vegetables, nuts, legumes, and whole grains, and is also widely found in other plant and animal foods [4].
Despite the several source foods and the beneficial role of magnesium for health, inadequate magnesium intake is commonly found worldwide [56]. There are very few studies on the dietary magnesium intake of Koreans. These studies reported that a substantial number of Korean adults did not achieve the estimated average requirement (EAR) [478]. Along with a reduced consumption of magnesium-containing vegetables and fruits and increased consumption of magnesium-depleted refined or processed foods [19], the problem of inadequate magnesium intake is likely to be more serious. Low dietary magnesium intake has been linked to high risks of metabolic syndrome [10], hypertension [2], stroke [11], cancer [12], depression [1314], and mortality [15]. There is growing concern about the status of dietary magnesium intake but recent studies that illustrate the magnesium intake of Koreans (including children and older adults) and its source foods are lacking.
Therefore, a database of magnesium content for foods reported to be consumed has recently been established in the Korea National Health and Nutrition Examination Survey (KNHANES) 2016–2019 [16]. Using the newly established magnesium database, the current study aims to estimate the dietary magnesium intake of Koreans, evaluate the dietary adequacy of magnesium, and examine the dietary sources.
Go to : 
SUBJECTS AND METHODS
Study design and study population
This study used cross-sectional data from the KNHANES conducted between 2016 and 2019. The KNHANES provides information about the health and nutrition status of Koreans aged 1 yr and above, accumulated through a health interview survey, a health examination survey, and a nutrition survey. The survey participants were sampled representative of non-institutionalized Koreans using a multi-stage stratified cluster sampling method. A total of 31,379 Koreans aged 1 yr and above were surveyed in the KNHANES 2016–2019. Of these, 28,418 individuals who completed the 24-h recall of the nutrition survey were included in this study.
We used the raw data released by Korea Disease Control and Prevention Agency (https://knhanes.kdca.go.kr/, accessed on 2021 November 21). More details are described elsewhere [1718].
Ethical approval
The KNHANES survey protocols and procedures were approved by the Institutional Review Board (IRB) of the Korea Disease Control and Prevention Agency (IRB approval number in 2016–2018 and 2019–2021: 2018-01-03-P-A and 2018-01-03-C-A). Written informed consent was obtained from all the participants.
Dietary assessment
Dietary intake was assessed via one-day 24-h recall. Trained dietitians surveyed which food and beverage each participant consumed on the previous day and how much they consumed, in an in-depth interview method according to the standardized protocol. Dietary intake of food and nutrients was calculated using the recipe database for dishes and the nutrient content database for each food, developed for the KNHANES. It is well-known that the KNHANES provides information on dietary intake of diverse nutrients including energy, macronutrients, fatty acids, and micronutrients such as minerals and vitamins. However, the survey had no information on the dietary magnesium intake of Koreans since the database for magnesium content of each food is yet to be compiled. More details on the 24-h recall of the KNHANES are available elsewhere [1719].
Magnesium database and estimation of dietary magnesium intake
In order to assess dietary magnesium intake, a database on the magnesium content of each food item consumed by participants of the KNHANES 2016–2019 was established [16]. For compiling and calculation of the magnesium value for the food composition database, we used the ‘Food composition data, production, management and use’ written by Greenfield and Southgate [20], and the food composition compiling and management tool of Food and Agriculture Organization/International Network of Food Data Systems [21]. Principles for data sources to be used for database construction, priorities, and application of substitute values were established, and guidelines were determined based on these principles [16]. First, the Korean food composition table was used to construct the DB, but values for only 1,211 foods could be obtained here. The remainder was replaced or calculated using domestic and foreign data. All available resources were used for compiling the magnesium content of food, including domestic and overseas food composition tables [22232425262728] and nutrition fact labels of processed foods. When analytical content values from multiple data sources were available, the content from domestic and latest data was selected. However, for foods imported from other countries, the content data was selected from the country of origin. For foods with no analytical information, the content was replaced with the analytical content of similar food. The magnesium database established by us for the present study covered 99.93% of the food items reported in the KNHANES (n = 4,214), and with data obtained from domestic (n = 3,800) and foreign (n = 411) sources.
Sociodemographic variables
Sociodemographic variables included in this study were sex, age, residence area, and income. The variables were categorized as follows: sex (male or female), age (1–2, 3–5, 6–11, 12–18, 19–29, 30–49, 50–64, or ≥ 65 yrs), residence area (urban or rural), and household income (in quintiles).
Statistical analysis
Mean daily magnesium intake (mg/d) and standard error were presented for all Koreans aged 1 yr and above, as well as stratified by sex, age, residence area, and income status. In addition, magnesium intake (%) relative to sex- and age-specific EAR suggested by Korean Dietary Reference Intakes 2020 [29] and the prevalence (%) of magnesium intake adequacy were estimated, which represents the proportion of subjects who met the EAR. In order to investigate the dietary sources of magnesium intake, we calculated the dietary intake from various food groups and its dietary contribution (%) to total daily magnesium intake. For the classification of food groups, we used the information on food groups included in the KNHANES raw dataset without any modification. The KNHANES groups each food item consumed by respondents into 20 groups according to the classification suggested by the Korean food composition table [2230]. We also present the top 20 individual foods for dietary magnesium intake and its % contribution by sex and age groups. In this analysis, we used the tertiary food code in the KNHANES dataset which was assigned to each food item consumed by respondents.
All analyses were performed using the SAS 9.4 software (SAS institute, Cary, NC, USA). In all analyses, we considered the sampling weights and survey design of the KNHANES. The results are considered significant at a P-value < 0.05.
Go to :
RESULTS
Dietary magnesium intake and prevalence of adequacy intake
The mean dietary magnesium intake and prevalence of magnesium adequacy intake of Koreans are presented in Table 1. The mean magnesium intake of Koreans aged 1 yr and above was 300.4 mg/d. The mean intake for males was 73 mg higher than females (P-value < 0.001). Overall, older individuals had higher magnesium intake than younger individuals, but this upward tendency was observed only up to the age of 50–64 yrs. Dietary magnesium intake relative to the recommended EAR was greater than 100% in almost all groups, regardless of sex and age. However, females aged 12–18 yrs consumed only 85.9% of their EAR. The proportion of individuals whose magnesium intake met the EAR was only 56.8% among Koreans aged 1 yr and above. Inadequate intake of magnesium was more prevalent among adolescents and young adults aged 12–29 yrs and elders aged 65 yrs and above.
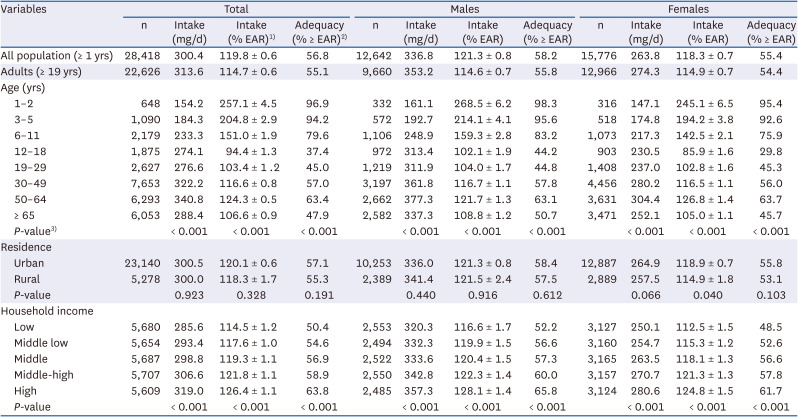
Table 1
Dietary magnesium intake and prevalence of magnesium adequacy intake, KNHANES 2016–2019
Data are mean ± SE or percentage.
EAR, estimated average requirement; KNHANES, Korea National Health and Nutrition Examination Survey.
1)Dietary intake relative to sex- and age-specific EAR of the Korean Dietary Reference Intakes 2020.
2)Prevalence of subjects whose intakes were ≥ EAR.
3)Differences between groups.
![]()
The difference of magnesium intake when considering the areas of residence was not notable, whereas dietary magnesium intake was positively associated with household income. Significant differences of magnesium intake according to income status were observed in both males and females (all P-value < 0.001).
Dietary sources of magnesium intake
Table 2 shows the mean magnesium intake from various food groups in the total population, and sex and age subgroups. For total population, 78.9% of total magnesium intake was from plant-based foods. Females and older individuals consumed relatively higher magnesium intake from plant-based foods than males and younger individuals, respectively. For infants aged 1–2 yrs, magnesium intake from plant-based foods accounted for 67.2% of total intake, but elders aged 65 yrs and above consumed nearly 90% of total magnesium intake through plant-based foods.
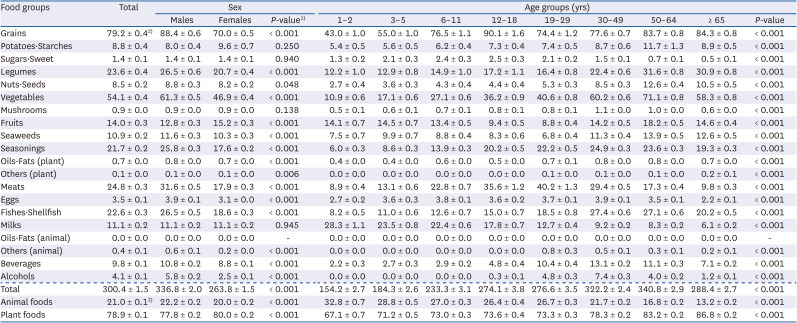
Table 2
Dietary magnesium intake from various food groups by sex and age groups, KNHANES 2016–2019
Data are mean ± SE.
KNHANES, Korea National Health and Nutrition Examination Survey.
1)Differences between groups.
2)Unit is mg/d.
3)Unit is % contribution of total magnesium intake.
![]()
Figs. 1 and 2 present the percentage contribution of various food groups to the daily total magnesium intake by sex and age groups, respectively. For total population, the major food groups contributing to daily magnesium intake were grains, vegetables, and meats, which accounted for 28.3%, 17.6%, and 8.4%, respectively, of daily total intake. Dietary sources of magnesium intake differed slightly by sex and age groups. For children under 12 yrs, the primary 3 food groups contributing to total magnesium intake were grains, milks, and fruits (or vegetables). However, in adolescents and young adults aged 12–49 yrs, grains, vegetables, and meats were the main source groups contributing to the total magnesium intake. In older adults aged 50 yrs and above, the top 3 food groups contributing to magnesium intake were all plant-based, viz., grains, vegetables, and legumes.
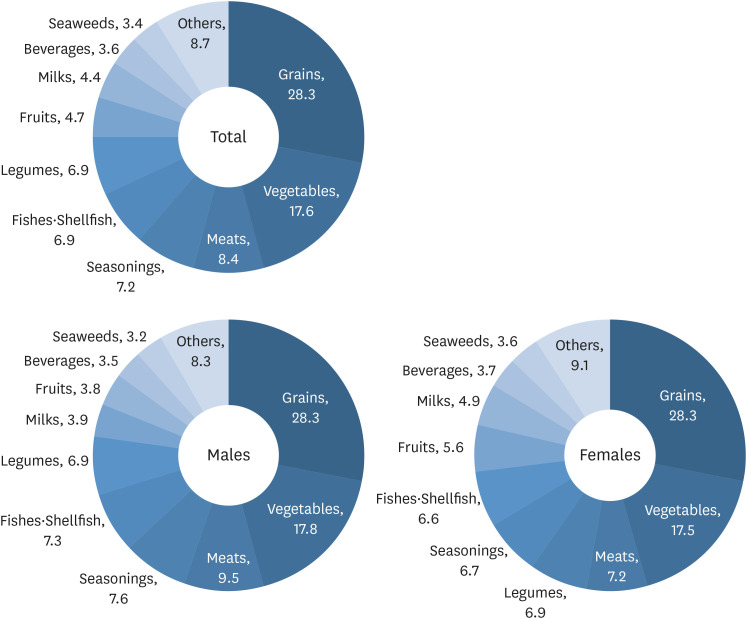 | Fig. 1Percentage contribution of various food groups to dietary magnesium intake of Koreans, KNHANES 2016–2019. In this analysis, food groups were classified into 20 groups as presented in Table 2. In each pie graph, the category ‘others’ means the rest of the 20 food groups, other than the top 10.KNHANES, Korea National Health and Nutrition Examination Survey.
|
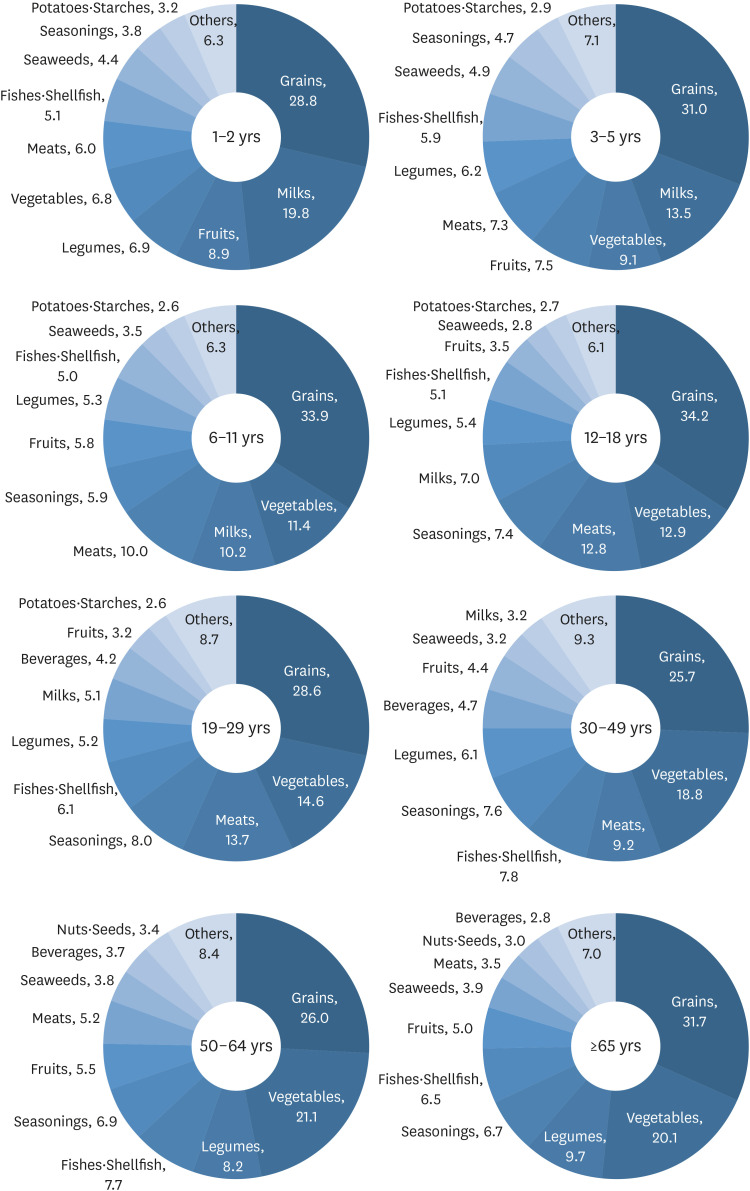 | Fig. 2Percentage contribution of various food groups to dietary magnesium intake of Koreans by age groups, KNHANES 2016–2019. In this analysis, food groups were classified into 20 groups as presented in Table 2. In each pie graph, the category ‘others’ means the rest of the 20 food groups, other than the top 10.KNHANES, Korea National Health and Nutrition Examination Survey.
|
We also present the top 20 individual food contributors to total magnesium intake by sex and age group in Tables 3 and 4. Overall, the top 20 individual food items contribute more than 50% of the daily magnesium intake. Similar to the results of major food groups contributing to total magnesium intake, the top 20 individual food contributors for magnesium intake were slightly different by sex and age groups. Rice, Baechu kimchi, tofu, pork, and beef were the top 5 individual food items contributing to total magnesium intake for males, whereas rice, Baechu kimchi, tofu, milk, and brown rice were the top contributors to females. Unlike the top contributory foods found among younger age groups, almost all top food contributors of elders aged 65 yrs and above were plant-based foods, although a small percentage of magnesium was contributed through some animal foods such as milk, anchovy, and pork.
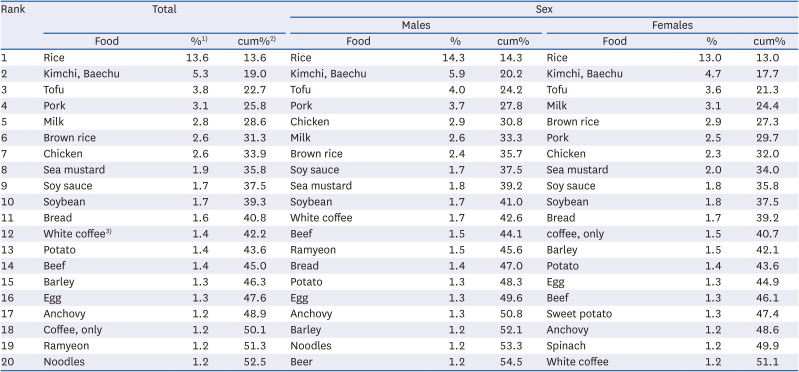
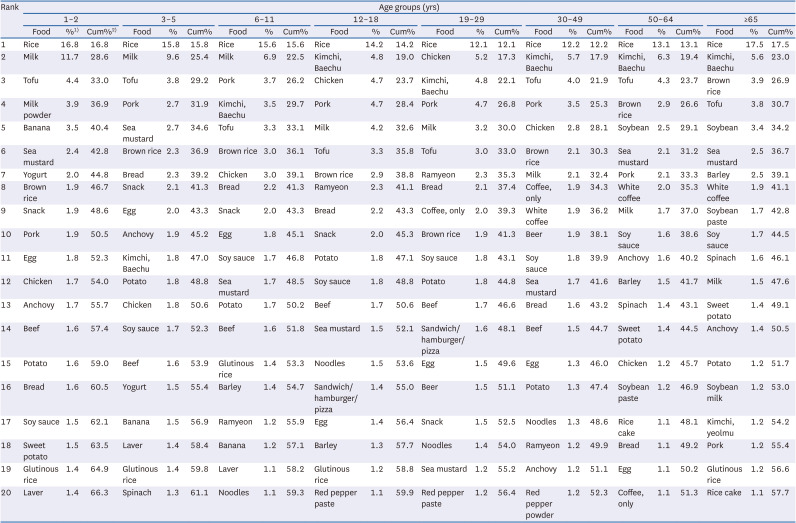
Table 3
Top 20 individual foods for dietary magnesium intake and their contribution, KNHANES 2016–2019
KNHANES, Korea National Health and Nutrition Examination Survey.
1)Data are mean contribution (%) of dietary magnesium intake from each food.
2)Data are cumulative contribution (%) of dietary magnesium intake.
3)Coffee with sugar and cream.
![]()
Table 4
Top 20 individual foods for dietary magnesium intake and their contribution by age groups, KNHANES 2016–2019
KNHANES, Korea National Health and Nutrition Examination Survey.
1)Data are mean contribution (%) of dietary magnesium intake from each food.
2)Data are cumulative contribution (%) of dietary magnesium intake.
![]()
Go to :
DISCUSSION
This study estimates the dietary magnesium intake among the Korean population by applying the newly established database of magnesium content in foods to the most recent data obtained from KNHANES 2016–2019. In the current study, the mean daily magnesium intake among Koreans aged 1 yr and above was 300.4 mg, which was 119.8% of the EAR. Overall, more than half the Korean population consumed adequate amount of magnesium, meeting the recommended EAR. Nearly 80% of dietary magnesium intake came from plant-based foods, and the major food groups contributing to more than half the total daily magnesium intake were grains (28.3%), vegetables (17.6%), and meats (8.4%).
It is widely known that even if Korea has experienced a nutrition transition along with the rapid economic growth and the introduction of Westernized lifestyle, the Korean diet retains its own unique features, characterized by a high intake of fruits and vegetables [31]. Due to high intake of magnesium-rich plant-based foods, we expected that the dietary magnesium intake of Koreans may be sufficient. Contrary to our expectation, one in 2 Koreans were determined to consume dietary magnesium below the EAR. However, these findings are in line with several previous studies for Koreans. In the early 1990s, when there was insufficient information on the magnesium content in food, Sung et al. [7] assessed dietary magnesium intake by directly analyzing diet samples consumed by healthy adults living in rural areas. They found that the mean magnesium intake of the study participants was 240.4 mg/d. Yeon and Sung [32] compiled the magnesium content information in food with reference to domestic and international data sources and subsequently applied it to 24-h recall data to estimate dietary magnesium intake. They reported that the mean intake of Korean postmenopausal women was 254.6 mg. Another study conducted by Bae et al. [4] produced their own magnesium content databases by directly analyzing 366 foods commonly consumed by Koreans and using these results. They reported that the mean magnesium intake of healthy adult participants was 279.2 mg/d, and 54.8% of study participants did not meet the EAR. Later, Choi and Bae [8] established the magnesium content database using available information and estimated the dietary magnesium intake of Korean adult participants in the KNHANES 2007–2008; the mean magnesium intake was determined to be 301.3–321.0 mg for men and 230.0–247.0 mg for women, and the prevalence of inadequate intake was about 50% for men and slightly higher for women. Such inadequate magnesium intake has been commonly observed worldwide [563334353637].
Trends in magnesium intake also differ slightly between countries. In some countries, the magnesium intake has increased [3438], whereas no change has been observed in others [36], and some have reported a decreased intake during the past decade [6]. However, even in countries where magnesium intake has increased, the inadequate intake prevalence is still high [3438]. As mentioned above, magnesium is particularly abundant in vegetables, fruits, and whole grains [429]. In Korea, the consumption of these foods has been observed to be on the decrease over the past 2 decades [9] and, contrary to this, the dietary share of highly processed foods has increased in the Korean diet [39]. The refining and processing of food results in a loss of the original magnesium content of the food [40], and the minerals content of processed foods such as ready-to-cook foods fails to meet the recommended intake [41]. Thus, the dietary magnesium intake of Koreans is likely to decrease and a consistent monitoring of this situation is required.
To the best of our knowledge, almost all previous studies on magnesium intake in the Korean diet have dealt with intake in adults [47832]. There is little information on the magnesium intake of other age groups such as children, adolescents, and elders in Korea. However, magnesium plays a crucial role in bone growth as well as cofactors in diverse physiologic processes in over 300 enzymatic reactions [2940]. Thus, magnesium is essential for human health, regardless of age. In the current study, we found that nearly all children under 6 yrs consumed adequate amount of magnesium, whereas some in age groups, including adolescents (12–18 yrs), young adults (19–29 yrs), and elders (≥ 65 yrs), a substantial number of individuals failed to meet their EAR. Inadequate intake was slightly more prevalent in females, consistent with the results of other studies [7842]. We also found disparity in dietary magnesium intake by income status, similar to reports from other countries [6]. High magnesium intake potentially decreases the risk of disease and improves health [121011121415], and thus strategies for sufficient intake in vulnerable groups should be sought.
Magnesium, a constituent of chlorophyll, is rich in plant foods such as green-leafy vegetables, legumes, and fruits, and is also found in some animal-based foods [2229]. In our population, nearly 80% of the total magnesium intake was obtained from plant-based foods. Consistent with a previous study [32], the major food groups contributing to dietary magnesium intake were grains, vegetables, and meats, followed by seasonings, fishes and shellfishes, and legumes. The top 5 individual food items contributing to daily intake were rice, Baechu kimchi, tofu, pork, and milk. However, the major source foods varied slightly by sex and age groups: females and older individuals consumed more magnesium from plant-based food. Grains and vegetables were the common main sources in all age groups, but milk, meats, and legumes were the other leading sources of magnesium intake in children, adolescents and adults, and elders, respectively.
In this study, we established a new magnesium content database in foods using the available diverse data for magnesium content. Our database covers almost all foods reported to be consumed in the KNHANES 2016–2019. Using the database, we showed the most recent dietary magnesium intake of Koreans, the major source foods, and the differences between sociodemographic characteristics. However, our study has several limitations. First, although magnesium intake mainly comes from foods, drinking water can be an important source, especially hard water which contains 30 mg per liter magnesium [1]. A previous study for Austria surveyed the consumption of drinking water as well as foods and beverages. They found that breads, grains and potatoes, fruits, vegetables, and legumes were the main sources of magnesium [37]. Interestingly, they reported that Austrians consumed 6.4% of total magnesium intake from drinking water. However, in the current study, we were unable to estimate the magnesium intake from drinking because water consumption information is not collected by the KNHANES. Second, our study could assess magnesium intake from food alone. Recently, the KNHANES surveyed the consumption of dietary supplements and assessed nutrients intake from dietary supplements; however, magnesium intake from supplements has not yet been included. Besides, the KNHANES only assessed one day dietary intake by a 24-h dietary recall [3043]; thus, it is difficult to believe that the dietary intake assessed in our study reflects an individual’s usual intake. Also, the prevalence of inadequate magnesium intake may be partially overestimated [44].
In conclusion, we found that the mean dietary magnesium intake among Koreans was above the recommended intake, but a substantial proportion of Koreans consumed inadequate amount of magnesium. Inadequate intake varied by sociodemographic characteristics. Further research is needed to better understand the status of magnesium intake and to seek strategies for sufficient intake.
Go to :
 XML Download