

 PDF
PDF Citation
 Print
Print


INTRODUCTION
Benign prostatic hyperplasia (BPH) is a urinary disease that is common in men aged more than 50 years. BPH is characterized by non-cancerous hypertrophy of prostate tissues with epithelial and stromal cell proliferation [12]. As an overgrowth of the prostate, BPH can cause symptoms such as thinning and weakening of the urine stream, increased frequency of urination, nocturia, and urinary urgency [34]. Although the underlying cause of BPH is not fully understood yet, several studies have reported that androgen changes due to aging and hormonal imbalance are associated with an enlarged prostate [25]. Therefore, BPH is known to decrease quality of life of older men. Activation of the androgen/androgen receptor (AR) pathway has been recognized as a typical mechanism of BPH progression [23]. Activated AR as a transcription factor leads to the expression of androgen-dependent growth factors. AR is activated by binding of androgens such as testosterone and dihydrotestosterone (DHT). DHT is converted from testosterone by 5α-reductase. It could bind to AR with higher binding affinity and biological activity compared to testosterone, indicating that uncontrolled DHT by activation of 5α-reductase is critically responsible for the development of BPH [26]. Furthermore, increased prostate-specific antigen (PSA) is widely used as a diagnostic marker for prostate cancer and BPH, because the expression level of PSA is increased by activated AR [78]. These observations suggest that the androgen/AR pathway might be an effective target for treatment of BPH. Although treatments for BPH include minimally invasive surgical options such as transurethral microwave hyperthermia and surgery, the main treatment option is drug therapy, including α-blockers, 5α-reductase inhibitors, and their combination [910]. Among them, α-blockers are α-adrenoreceptor antagonists. They can improve urine flow by relaxing the smooth muscle of the prostate, thus exerting effects on BPH [1112]. On the other hand, 5α-reductase inhibitors such as finasteride (Fina) block the enzyme activity of 5α-reductase, which converts testosterone to DHT [1113]. However, these drugs are causing concerns due to their side effects such as fatigue, dizziness, and sexual dysfunction [1014].
Recently, herbal medicines used in traditional medicine have been recognized as alternatives for the treatment of various diseases. Among them, Corni Fructus (CF), the fruit of Cornus officinalis Sieb. et Zucc. and Schisandrae Fructus (SF), the fruit of Schisandra chinensis Turcz. (Baill.), have been widely used for a long time to solve various medical problems in East Asia including Korea [15161718]. According to the theory of traditional medicine, CF has been widely used in the treatment of kidney, liver, and genital diseases due to its properties of tonifying the kidney and liver and nourishing the essence [1519]. SF has also been widely used to treat liver, cardiovascular, and neurological diseases, and has been documented to possess a calming effect on the mind, stopping coughing and sweating [1920]. Many previous studies have isolated physiologically active substances from these fruits, investigated their pharmacological efficacies, and found that they possess excellent antioxidant and anti-inflammatory activities in common [15161720]. Interestingly, recent studies have demonstrated that oxidative and inflammatory stresses are related to the pathogenesis of BPH, suggesting that herbal medicines with antioxidant and anti-inflammatory effects have a high potential treating BPH [1921222324]. Although the effects of CF and SF on BPH have been partially reported [2526], studies about effects of their mixtures have not been reported yet. Therefore, the purpose of this study was to demonstrate the effect of a mixture of CF and SF on the testosterone propionate (TP)-induced BPH animal model by evaluating weight of prostate, histological changes of prostate, and factors linked to the pathogenesis of BPH.
Go to : 
MATERIALS AND METHODS
Chemicals and reagent
TP was purchased from Tokyo Chemical Industry Co., Ltd. (Tokyo, Japan). Corn oil, Fina and hematoxylin were obtained from Sigma-Aldrich Chemical Co. (St. Louis, MO, USA). Supercritical fluid extract of saw palmetto (SP) was provided by Daehan Chemtech Co., Ltd. (Seoul, Korea). Formaldehyde and eosin were purchased from Junsei Chemical Co., Ltd. (Tokyo, Japan). Paraffin was obtained from Leica Biosystems Co. (Wetzlar, Germany). Antibodies against 5α-reductase type 2 and basic fibroblast growth factor (bFGF) were purchased from Biorbyt (Cambridge, UK) and Bioss Antibodies Inc. (Woburn, MA, USA), respectively. Antibodies against PSA, proliferating cell nuclear antigen (PCNA), AR, AR coactivator 70 (ARA70), steroid receptor coactivator 1 (SRC1), α-smooth muscle actin, epidermal growth factor (EGF), Bax and Bcl-2 were purchased from Santa Cruz Biotechnology, Inc. (Santa Cruz, CA, USA). VECTASTAIN ABC kit and 3,3-diaminobenzidine (DAB) were obtained from Vector Laboratories Inc. (Burlingame, CA, USA). Enzyme-linked immunosorbent assay (ELISA) kits for 5α-reductase type 2, testosterone, DHT, and PSA were purchased from Cloud-Clone Corp. (Katy, TX, USA), BioVision Inc. (Milpitas, CA, USA), Mybiosource Inc. (San Diego, CA, USA) and LifeSpan Biosciences, Inc. (Seattle, WA, USA), respectively. All other chemicals used in this study, not mentioned, were of analytical grade.
Preparation of ethanol extracts of CF or SF, and their mixture
The dried CF and SF were kindly donated by Chungbuk TechnoPark (Ochang, Korea). To prepare ethanol extracts of CF and SF, the dried materials were cut into small pieces and pulverized, and then extracted with 60% ethanol at 50°C for 4 h at a ratio of 1:10 (v/v) using an Ultra-high-speed low-temperature extractor (Kyungseo E&P Co., Incheon, Korea). The extracts (CF and SF) were filtered to remove undissolved residues, concentrated using a vacuum rotary evaporator (Tokyo Rikakikai Co. Ltd., Tokyo, Japan), and then lyophilized using a freeze dryer (SP Industries, Inc., Warminster, PA, USA). They were dissolved in distilled water and subsequently used in all of the experiments. Equal amounts of CF, SF, and their mixture (1:1 ratio, MIX) were used to evaluate the diverse effects on BPH.
Animals and treatment
Six-week-old male Sprague-Dawley rats (220 ± 10 g) were obtained from Koatech (Pyeongtaek, Republic of Korea). All animals were housed at a temperature of 22 ± 2°C with a humidity of 70 ± 5% under a regular 12/12 light/dark cycle. Water and standard diet were provided ad libitum. The experimental procedures were managed according to the Animal Experimental Ethics Committee of Dong-eui University (Confirmation number: R2020-003). To induce the BPH, all rats those in except the control group were subcutaneously injected with 100 μL of TP (3 mg/kg) dissolved in corn oil as previously described [25]. In brief, the animals were randomly divided into the seven groups (n = 8 in each group) as follows: (a) Control group (oral DW and subcutaneous injection of corn oil), (b) BPH group (oral DW and subcutaneous injection of TP), (c) SP group (oral SP at 45 mg/kg and subcutaneous injection of TP), (d) positive control (PC) group (oral Fina at 5 mg/kg and subcutaneous injection of TP), (e) CF group (oral CF at 50 mg/kg and subcutaneous injection of TP), (f) SF group (oral SF at 50 mg/kg and subcutaneous injection of TP), and (g) MIX group (oral SF/CF mixture at 50 mg/kg and subcutaneous injection of TP). All groups were administrated and injected in a volume of 0.1 mL for 7 weeks. During the experiment, body weight was measured once a week. All rats were sacrificed and blood samples were collected from the heart for hematological and biochemical analyses. The prostate tissues were fixed with 10% formaldehyde for histological analysis.
Blood analysis
For hematological analysis, whole blood samples were stored in tubes containing ethylenediaminetetraacetic acid and rotated for mixing as previously described [27]. The counts of red blood cells, hematocrit, hemoglobin, mean corpuscular volume, mean corpuscular hemoglobin concentration, mean corpuscular hemoglobin, mean platelet volume, red cell distribution width, and platelet were determined using an ADVIA 2120i Hematology System (Siemens Healthineers, Munich, Germany). The serum samples were obtained by centrifuging whole blood at 3,000 rpm for 10 min and stored at −80°C for subsequent analysis. The levels of alanine aminotransferase, aspartate aminotransferase, blood urea nitrogen, total cholesterol, lactate dehydrogenase, and uric acid were assessed using an AU680 Clinical Chemistry Analyzer (Beckman Coulter Inc., Brea, CA, USA).
Histological analysis and immunohistochemistry (IHC)
The fixed prostate tissues were embedded in paraffin and cut into a thickness of 4 μm using a microtome (Leica RM2125, Leica Biosystems Co.). To observe histological changes in the prostate tissues, the sections were rehydrated by deparaffinization and washed with distilled water for hematoxylin and eosin (H&E) staining as previously described [25]. For immunohistochemistry analysis, sections were incubated with primary antibodies at 4°C overnight followed by incubation with secondary antibodies at room temperature for 30 min. To visualize the immunoreaction, the sections were stained with DAB and counterstained with hematoxylin. After the stained tissues were dehydrated, they were mounted and observed using a Cell Imaging System (Thermo Fisher Scientific, Waltham, MA, USA). Epithelial thickness and luminal area of the prostate were measured and stained spots were quantified using a Celleste Image Analysis Software (Thermo Fisher Scientific).
Serum analysis for 5α-reductase type 2, DHT, testosterone, and PSA
The levels of 5α-reductase type 2, testosterone, DHT, and PSA in serum samples were determined using ELISA kits according to the manufacturer’s instructions. The optical density of each sample was determined at 450 nm using an ELISA plate reader (Beckman Coulter Inc.) installed at the Core-Facility Center for Tissue Regeneration of Dong-eui University (Busan, Korea).
Statistical analysis
All numerical data are expressed as mean ± SD from triplicate experiments. All statistical analyses were performed with the GraphPad Prism 8.4.2 (GraphPad Software, Inc., San Diego, CA, USA) using one-way analysis of variance for multiple comparisons, followed by Tukey’s post hoc test. P-value of < 0.05 was considered to be statistically significant.
Go to :
RESULTS
Mixture of CF and SF (MIX) attenuates the prostate weights and volumes of TP-induced BPH rats
The prostate is generally located below the bladder and in front of the rectum, and consists of several lobes. The rat prostate consists of a ventral prostate lobe (VP), a dorsal prostate lobe (DP), and an anterior prostate lobe (AP) named based on their positions relative to the bladder and morphological characteristics. To investigate the effects of CF, SF, and MIX on the prostatic hyperplasia, prostate tissues including VP, DP, and AP were obtained from BPH rats induced by TP for 7 weeks. As shown in Fig. 1A and B, the prostate weight and index (prostate weight/body weight) were remarkably increased in BPH-induced rats compared to those in the control group. However, these values increased by TP were significantly reduced in the PC and MIX groups. We also measured the width of the VP to determine if the prostate size was altered. As a result, administration of PC, SF and MIX clearly diminished the width of VP increased by TP, but there was no significant change in prostate weight, index and width of VP in CF group (Fig. 1C and D), indicating that MIX was more effective in reducing prostate weight and size than CF or SF alone.
 | Fig. 1Effects of ethanol extracts of CF and SF, and their mixture (MIX) on prostate weight and volume in TP-induced BPH rats. The rats with BPH induced by TP (3 mg/kg) were treated with SP(45 mg/kg), finasteride (Fina, 5 mg/kg) as a PC, CF (50 mg/kg), SF (50 mg/kg), and MIX (50 mg/kg). Changes in prostate weight (A), prostate index (B), and width of VP (C). Data are expressed as the mean ± SD (n = 6). (D) Representative photographs of prostate tissue in each group.Con group, corn oil injection and DW fed group; BPH group, TP injection and DW fed group; SP group, TP injection and saw palmetto fed group; PC group, TP and finasteride injection group; CF group, TP injection and CF fed group; SF group, TP injection and SF fed group; MIX group, TP injection and SF/CF mixture fed group; BPH, benign prostatic hyperplasia; SP, saw palmetto; PC, positive control; CF, Corni Fructus; SF, Schisandrae Fructus; AP, anterior prostate lobe; DP, dorsal prostate lobe; VP, ventral prostate lobe; TP, testosterone propionate; DW, distilled water.
***P < 0.001 compared to the control group. ##P < 0.01 and ###P < 0.001 compared to the BPH group.
|
MIX improves the histological changes in TP-induced BPH rats
To confirm the histological changes in the BPH-induced prostate tissues, H&E staining was conducted. As shown in Fig. 2A, the BPH group exhibited histological changes of hyperplasia including reduced lumen area and thickened epithelium compared to the control group. It was also found that the constricted lumen area and the thickness of epithelium tissue from prostate (TETP) were significantly inhibited in the PC and MIX groups compared to those in the BPH group (Fig. 2C and D). In addition, the control group had histologically appropriate structures of germinal epithelium, Sertoli cells, and spermatocytes in testicular tissues, but the BPH group did not (Fig. 2B). These histological changes of testicular tissue in the BPH group were improved in the MIX group. However, the inappropriate testicular tissue structure could not be restored in other groups including the PC group. Therefore, the administration of MIX could notably ameliorate the histological changes of the prostate and testicular tissues of TP-induced BPH rats.
 | Fig. 2Effects of CF, SF, and MIX on histological changes in TP-induced BPH rats. Representative images of hematoxylin and eosin-stained prostate (A) and testis (B) tissue are shown. Scale bar = 100 μm. (C) The lumen area of the prostate tissue in each group was measured. (D) The thickness of epithelium tissue from prostate in each group was evaluated. Each value indicates the mean ± SD (n = 6).Con group, corn oil injection and DW fed group; BPH group, TP injection and DW fed group; SP group, TP injection and saw palmetto fed group; PC group, TP and finasteride injection group; CF group, TP injection and CF fed group; SF group, TP injection and SF fed group; MIX group, TP injection and SF/CF mixture fed group; BPH, benign prostatic hyperplasia; SP, saw palmetto; PC, positive control; CF, Corni Fructus; SF, Schisandrae Fructus; TP, testosterone propionate; DW, distilled water.
***P < 0.001 compared to the control group. ##P < 0.01 and ###P < 0.001 compared to the BPH group.
|
MIX regulates the levels of 5α-reductase type 2, testosterone, and DHT in TP-induced BPH rats
To demonstrate the role of 5α-reductase type 2 in the alteration of testosterone and DHT levels by administration of MIX, the expression and concentration of 5α-reductase type 2 in the prostate and serum samples were verified, respectively. As shown in Fig. 3A, the expression of 5α-reductase type 2 was enhanced in the BPH group compared to that in the control group, whereas its expression was decreased in the PC and MIX groups. Quantitative evaluation of 5α-reductase type 2 positive area after IHC staining also revealed that 5α-reductase type 2 expression was increased by TP, but decreased by PC and MIX (Fig. 3B). In parallel with the immunoblotting results, the concentration of 5α-reductase type 2 in the serum induced by TP was significantly reduced in the PC and MIX groups (Fig. 3C). Moreover, the concentrations of testosterone and DHT in serum elevated in the BPH group compared to those in the control group (Fig. 3D and E). In contrast, the levels of testosterone and DHT in the PC and MIX groups were significantly lower than observed in the BPH group.
 | Fig. 3Effects of CF, SF, and MIX on the expression and concentration of 5α-reductase type 2 in TP-induced BPH rats. (A) Expression of 5α-reductase type 2 in prostate tissues of each group was determined by immunohistochemistry. Scale bar = 100 μm. (B) 5α-reductase type 2 expression was quantified in the regions of each group. The levels of SRD5A2 (C), testosterone (D) and DHT (E) in serum of each group were detected through ELISA analysis. Each value indicates the mean ± SD (n = 6).Con group, corn oil injection and DW fed group; BPH group, TP injection and DW fed group; SP group, TP injection and saw palmetto fed group; PC group, TP and finasteride injection group; CF group, TP injection and CF fed group; SF group, TP injection and SF fed group; MIX group, TP injection and SF/CF mixture fed group; BPH, benign prostatic hyperplasia; SP, saw palmetto; PC, positive control; CF, Corni Fructus; SF, Schisandrae Fructus; SRD5A2, 5α-reductase type 2; DHT, dihydrotestosterone; TP, testosterone propionate; DW, distilled water.
***P < 0.001 compared to the control group. #P < 0.05, ##P < 0.01 and ###P < 0.001 compared to the BPH group.
|
MIX suppresses the levels of PSA in TP-induced BPH rats
We next investigated the effect of MIX on the expression of PSA, which is closely related to the pathogenesis of BPH and prostate cancer [728]. As shown in Fig. 4A, the level of PSA in the serum was also significantly enhanced in the BPH group, but was significantly inhibited in the PC and MIX groups compared to that in the BPH group. Consistent with the results of serum level, PSA expression was increased in the BPH group compared to that in the control group. However, such increase of PSA expression was decreased by MIX and PC (Fig. 4B and D). Moreover, the expression of PCNA, a marker of cell proliferation, was significantly elevated in the BPH group compared to that in the control group. Such elevation was decreased by PC and MIX (Fig. 4C and E). In addition, the increases of PSA and PCNA expression levels by TP treatment were somewhat decreased by the SP.
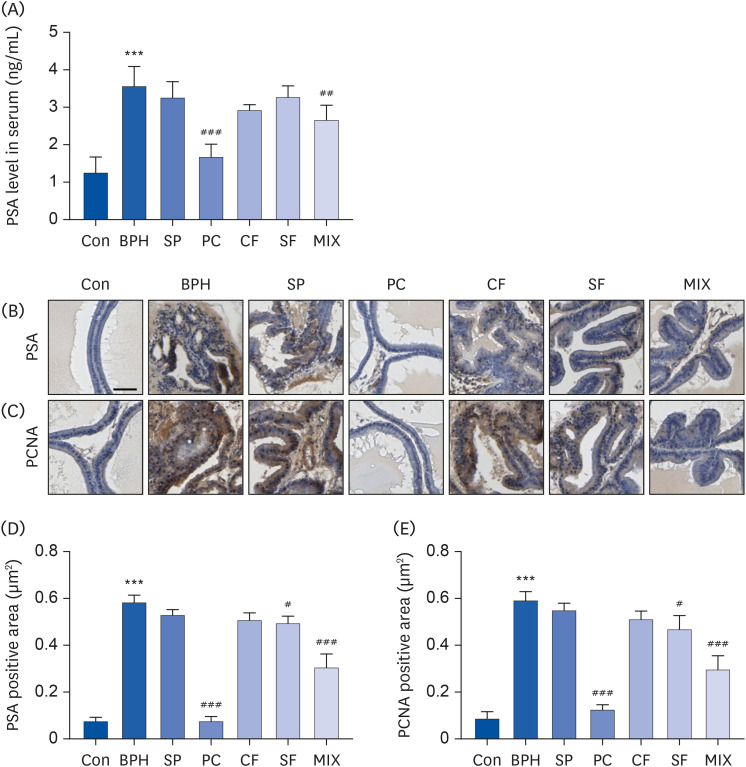 | Fig. 4Effects of CF, SF and MIX on the expression of PSA and PCNA in TP-induced BPH rats. (A) The serum concentrations of PSA in each group were examined by ELISA. (B and C) The expression of PSA and PCNA in prostate tissues of each group examined by immunohistochemistry. Scale bar = 50 μm. (D and E) The expression of PSA and PCNA in prostate tissues was quantified. Data are expressed as the mean ± SD (n = 6).Con group, corn oil injection and DW fed group; BPH group, TP injection and DW fed group; SP group, TP injection and saw palmetto fed group; PC group, TP and finasteride injection group; CF group, TP injection and CF fed group; SF group, TP injection and SF fed group; MIX group, TP injection and SF/CF mixture fed group; PSA, prostate-specific antigen; BPH, benign prostatic hyperplasia; SP, saw palmetto; PC, positive control; CF, Corni Fructus; SF, Schisandrae Fructus; PCNA, proliferating cell nuclear antigen; TP, testosterone propionate; DW, distilled water.
***P < 0.001 compared to the control group. ##P < 0.01 and ###P < 0.001 compared to the BPH group.
|
MIX regulates the AR signaling pathway-related proteins in TP-induced BPH rats
To study the mechanism involved in the inhibitory effect of MIX on BPH, the effect of MIX on the AR signaling pathway known to play a key role in the development of BPH was investigated [23]. According to our IHC results, the protein expressions of AR, ARA70 and SRC1 as key factors involved in AR signaling [2] was remarkedly increased in the BPH group compared to those in the control group (Fig. 5A-C). However, their expressions were greatly attenuated in prostate tissues of PC and MIX groups, and slightly decreased in SP and SF groups. Additionally, the expression of SMA, which is highly expressed in hyperplasia of prostate stromal cells [2930], was upregulated in the BPH group compared to that in the control group, but less in the PC and MIX groups than in the BPH group (Fig. 5D).
 | Fig. 5Effects of CF, SF, and MIX on AR and its co-activators in prostate tissues of TP-induced BPH rats. To evaluate the expression of AR, ARA70, and SRC1, paraffin blocks of prostate tissue of each group were sectioned into 4 μm in thickness and stained with specific antibodies (n = 6). Representative images of prostate tissues immunostained with an anti-AR (A), ARA70 (B), SRC1 (C), and α-SMA (D) are presented. Scale bar = 50 μm. Quantifications of immunohistochemistry staining of AR (E), ARA70 (F), SRC1 (G), and α-SMA (H). Data are expressed as the mean ± SD (n = 6).Con group, corn oil injection and DW fed group; BPH group, TP injection and DW fed group; SP group, TP injection and saw palmetto fed group; PC group, TP and finasteride injection group; CF group, TP injection and CF fed group; SF group, TP injection and SF fed group; MIX group, TP injection and SF/CF mixture fed group; BPH, benign prostatic hyperplasia; SP, saw palmetto; PC, positive control; CF, Corni Fructus; SF, Schisandrae Fructus; AR, androgen receptor; ARA70, AR coactivator 70; SRC1, steroid receptor coactivator 1; α-SMA, α-smooth muscle actin; TP, testosterone propionate; DW, distilled water.
***P < 0.001 compared to the control group. ##P < 0.01 and ###P < 0.001 compared to the BPH group.
|
MIX modulates the expression of growth factors and apoptosis-related proteins in TP-induced BPH rats
In order to investigate additional mechanisms related to the inhibitory effect of MIX on BPH, the expressions of growth factors and apoptosis regulation-related proteins in prostate tissues were further evaluated. As indicated in Fig. 6A and B, the expressions of growth factors such as EGF and bFGF were greatly increased in the BPH group, but decreased to the control level in the PC and MIX groups. However, the pro-apoptotic protein Bax was hardly expressed in any groups except for the MIC group (Fig. 6C). Moreover, TP treatment promoted the expression of Bcl-2, an anti-apoptotic protein, compared to the control (Fig. 6D). Conversely, Bcl-2 expression was inhibited by treatment with Fina and MIX.
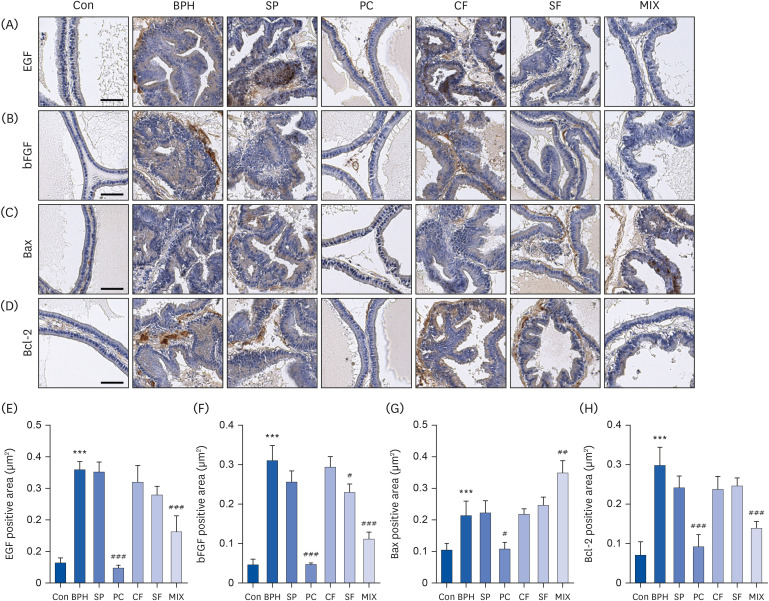 | Fig. 6Effects of CF, SF, and MIX on expression of growth factors, Bax, and Bcl-2 in prostate tissues of TP-induced BPH rats. After treatment with TP and/or chemicals for 7 wk, the prostate tissues were obtained and their paraffin blocks of prostate tissues were sectioned into 4 μm in thickness and stained with specific antibodies. The prostatic expression levels of epidermal growth factor, basic fibrosis growth factor, Bax, and Bcl-2 were detected by immunohistochemistry (n = 6). Scale bar = 50 μm. Quantifications of IHC staining of EGF (E), bFGF (F), Bax (G), and Bcl-2 (H). Data are expressed as the mean ± SD (n = 6).Con group, corn oil injection and DW fed group; BPH group, TP injection and DW fed group; SP group, TP injection and saw palmetto fed group; PC group, TP and finasteride injection group; CF group, TP injection and CF fed group; SF group, TP injection and SF fed group; MIX group, TP injection and SF/CF mixture fed group; BPH, benign prostatic hyperplasia; SP, saw palmetto; PC, positive control; CF, Corni Fructus; SF, Schisandrae Fructus; TP, testosterone propionate; EGF, epidermal growth factor; bFGF, basic fibroblast growth factor; DW, distilled water.
***P < 0.001 compared to the control group. ##P < 0.01 and ###P < 0.001 compared to the BPH group.
|
MIX does not induce toxicity in TP-induced BPH rats
To evaluate the toxicity of MIX, body weight, organ weight, blood biochemical analysis and hematological analysis were investigated. At the end of the experiment, body weight decreased slightly in all groups receiving TP injection, although the decrease was not statistically significant (Table 1). In addition, in the TP-induced BPH model, the weights of major organs such as heart, lung, spleen, and kidney in all groups including MIX showed no significant changes (Table 2). Moreover, serum biochemical (Table 3) and hematological analyses (Table 4) also showed no significant differences between groups.
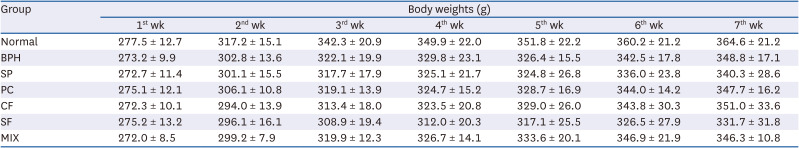
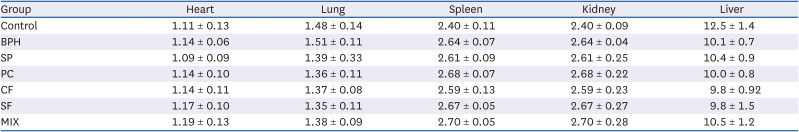
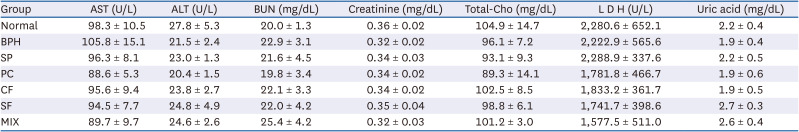
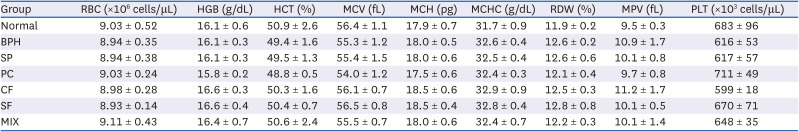
Table 1
Effects of CF, SF and MIX treatment on the organ weights of BPH rats
There was no significant difference between all groups (P > 0.05).
BPH group, TP injected group; SP group, TP injected and saw palmetto fed group; PC group, TP and finasteride injected group; CF group, TP injected and CF fed group; SF group, TP injected and SF fed group; MIX group, TP injected and MIX fed group; BPH, benign prostatic hyperplasia; SP, saw palmetto; PC, positive control; CF, Corni Fructus; SF, Schisandrae Fructus.
![]()
Table 2
Effects of CF, SF and MIX treatment on the organ weights of BPH rats
There was no significant difference between all groups (P > 0.05).
BPH group, TP injected group; SP group, TP injected and saw palmetto fed group; PC group, TP and finasteride injected group; CF group, TP injected and CF fed group; SF group, TP injected and SF fed group; MIX group, TP injected and MIX fed group; BPH, benign prostatic hyperplasia; SP, saw palmetto; PC, positive control; CF, Corni Fructus; SF, Schisandrae Fructus.
![]()
Table 3
Effects of CF, SF and MIX treatment on the serum biochemical analysis of BPH rats
There was no significant difference between all groups (P > 0.05).
BPH group, TP injected group; SP group, TP injected and saw palmetto fed group; PC group, TP and finasteride injected group; CF group, TP injected and CF fed group; SF group, TP injected and SF fed group; MIX group, TP injected and MIX fed group; BPH, benign prostatic hyperplasia; SP, saw palmetto; PC, positive control; CF, Corni Fructus; SF, Schisandrae Fructus.
![]()
Table 4
Effects of CF, SF and MIX treatment on the hematological analysis of BPH rats
There was no significant difference between all groups (P > 0.05).
BPH group, TP injected group; SP group, TP injected and saw palmetto fed group; PC group, TP and finasteride injected group; CF group, TP injected and CF fed group; SF group, TP injected and SF fed group; MIX group, TP injected and MIX fed group; BPH, benign prostatic hyperplasia; SP, saw palmetto; PC, positive control; CF, Corni Fructus; SF, Schisandrae Fructus.
![]()
Go to :
DISCUSSION
BPH is a common urinary system disease in elderly men and decreases their quality of life. There is no way to completely cure BPH, and the surgery and medication can only improve its symptoms such as frequent urination, difficulty in starting to urinate, weak stream, feeling the urgency to urinate, and incomplete emptying [31]. Since surgical and pharmacological treatment have side effects, additional research is needed to improve BPH. Meanwhile, many studies have reported the efficacy of traditional medicinal extracts with few side effects and high efficacy for BPH treatment [323334353637]. In addition, attempts are being made to enhance the efficacy while further reducing the side effect of each treatment due to a combination therapy of the two natural products. For example, Karunasagara et al. [38] have demonstrated that a combination of ethanol extracts from Stauntonia hexaphylla leaves and CF was effective in protecting against BPH by inhibiting 5α-reductase type 2 and inducing prostate cell death. Similarly, Uroko et al. [39] reported that a mixture of ethanol extracts of Funtumia africana and Abutilon mauritianium leaves was significant in improving of BPH, including the protection against kidney damage, in BPH-induced rats. In fact, several studies have been reported on the component analysis of CF and SF [4041], and previous studies demonstrated that loganin, a representative bioactive substance of CF, has improvement effects on acute kidney injury and diabetic neuropathy by alleviating oxidative stress and inflammation [4243]. In addition, Nasser et al. [44] confirmed that schisandrin B was included as bioactive substance in SF and inhibited the cell proliferation of prostate cancer cells. High performance liquid chromatography analysis of our CF ethanol extract demonstrated that CF primarily contained morroniside, cornin and loganin. And analysis of our SF extract showed that it contained active substances such as schisandrin, gomisin A and gomisin N (data not shown). Since various bioactive substances are expected to act in a complex way and contribute to beneficial bioactivity of CF and SF, further mechanism study on each active substance would be necessary. In the current study, we investigated whether a combination of CF and SF extracts could be an effective treatment for BPH based on a previous report showing the potential of SF for improving BPH [26] and our prior previous study [25].
Animal models for studying BPH include xenograft model, transgenic mice, induction of BPH by hormone and chemical carcinogen, and spontaneous BPH [4546]. Among them, TP, a sex steroid hormone, has been commonly used for promoting prostate hyperplasia. Although the cause of BPH has not been clearly elucidated yet, the association of BPH with an imbalance of hormones in the beginning and progression of BPH has been suggested [26]. BPH induced by TP is a non-malignant, but is the result of abnormal prostate cell proliferation [1]. Overgrowth of prostate cells is accompanied by an enlargement of prostate volume, increase of prostate weight, and histological changes [5]. Our findings showed that a mixture of CF and SF could remarkably reduce the weight and width of prostate in TP-induced BPH rats (Fig. 1). Additionally, histological examination represented that the features of BPH including decreasing lumen area and increasing TETP were observed in the BPH group treated with TP. However, these characteristics of BPH mentioned above were significantly improved in the MIX group (Fig. 2). These results supported the results of the weight and size of the prostate. They were consistent with the effects of Fina, a representative 5α-reductase inhibitor that is widely used for the treatment of BPH [1113]. Although Fina used as a PC in the present study could improve symptoms of BPH, it can also cause testicular damage [1447]. However, in histological observation of the damaged testis in rats with TP-induced BPH, we confirmed that the MIX-treated group ameliorated the damaged testis (Fig. 2B).
It is well-known, 5α-reductase can induce the conversion of testosterone to DHT, thereby promoting the proliferation of prostate cells and leading to prostate enlargement [6]. Although both testosterone and DHT are androgens with important roles in male sexual and reproductive function and could bind directly to AR, the binding capacity of DHT is higher than that of testosterone [48]. The DHT-AR complex translocate to the nucleus and bind to androgen response elements along with AR coactivators such as ARA70 and SRC1 to express growth factors and PSA [78]. Therefore, while DHT can act on prostate cells to regulate proliferation, dysregulation of DHT by 5α-reductase is associated with the development and progression of BPH [649]. According to the results of this study, administration of MIX decreased TP-induced expression and concentration of 5α-reductase type 2 in the prostate and serum, respectively (Fig. 3). Likewise, expression and concentration levels of 5α-reductase type 2 were decreased in the group treated with Fina. Moreover, the increased serum levels of testosterone and DHT by TP were decreased by MIX and Fina. Hence, these results indicate that the reduction of 5α-reductase type 2 might play a critical role in the ameliorating effect of MIX on prostate weight gain and histologic changes. Furthermore, the expression and serum concentration of PSA, a biomarker for prostate cancer and BPH [728], and the expression of PCNA were increased in the TP-induced BPH group, but markedly decreased by MIX (Fig. 4). Additionally, the expression of AR and AR co-activator proteins such as ARA70 and SRC1 induced by TP was diminished more by MIX than by CF or SF alone (Fig. 5). Therefore, our results suggested that MIX could ameliorate 5α-reductase-mediated BPH through inhibiting androgen signal transduction.
Along with the importance of androgen signaling, previous studies have suggested that growth factors are closely related to the initiation stage of BPH development [50]. This means that homeostasis of prostate cell growth and apoptosis are important for the progression of BPH [51]. Considering the antiproliferative properties of CF and SF in cultured human BPH epithelial and prostate smooth muscle cells [5253], respectively, MIX might affect growth factors and apoptosis-related regulatory proteins in prostate cells. These assumptions led us to investigate the effect of MIX on the expression of growth factors and apoptosis factors in BPH rats. Our results showed that the expression of growth factors, including bFGF and EGF, tended to decrease in prostate tissues from BPH rats. Concomitantly, the expression of Bax, a representative pro- apoptotic protein, was downregulated, while the expression of Bcl-2, an anti-apoptotic protein, was upregulated. However, in the MIX group, these changes were notably offset (Fig. 6), demonstrating that the growth factor and apoptosis-related protein were involved in the efficacy of MIX for BPH.
In summary, our results indicated that a mixture of CF and SF can improve TP-induced BPH by mediating the androgen/AR signaling pathway and growth factors. These inhibitory effects of MIX on BPH are attributed to reduced DHT levels in serum through inhibition of 5α-reductase. However, SF rarely had effects on BPH. Although Fina was effective for BPH, it known to have side effects. Based on our results, co-treatment of extracts from CF and SF with synergistic effects provide a promising and effective treatment for BPH.
Go to :
 XML Download