

 PDF
PDF Citation
 Print
Print


INTRODUCTION
Diabetes affects 10.5% of the world’s population and causes socio-economic and health problems [1]. Diabetes is characterized by persistent hyperglycemia [2]. Hyperglycemia activates the pathogenesis of diabetic complications by changing several inflammatory genes and proteins [3]. That is, hyperglycemia induces reactive oxygen species and causes oxidative stress, final glycosylation product formation, inflammatory gene activation, and nuclear factor-kappa B (NF-κB) activity in monocytes [45].
Hyperglycemia promotes the release of transcription factors, NF-κB, and pro-inflammatory factors, such as monocyte chemoattractant protein-1 and tumor necrosis factor-α (TNF-α) in vitro and in vivo [67]. Clinical studies have shown that the complications of type 1 diabetes (T1DM) and type 2 diabetes (T2DM) are directly related to chronic hyperglycemia [8]. A rapid increase in interleukin-6 (IL-6) and TNF-α was reported in the monocytes of T1DM and T2DM patients, and the activation of NF-κB, a transcription factor of inflammatory factors, was confirmed [910]. These inflammatory factors have been reported to be associated with cardiovascular disease, metabolic disease, or diabetic complications [11]. Previous studies have shown that high glucose (HG) activates inflammatory gene expression, including epigenetic mechanisms [1213].
In contrast to genetic changes, epigenetic changes are reversible, making them good targets for disease treatment. Abnormal epigenetic histone alterations are associated with disease-related changes in gene expression [14]. Histone acetylation/deacetylation is a pivotal regulator that plays a vital role in inflammatory conditions [15].
Stimulation of histone acetylation regulates the expression of NF-κB, a key transcription factor that regulates the activity of various inflammatory mediators at many lysine residues [16]. Acetylation modifications have been reported to affect the DNA binding affinity, positively and negatively regulate subcellular localization, and influence the transcriptional activity of NF-κB [16]. p300, which possesses intrinsic histone acetyltransferase (HAT) activity, acetylates histones and other proteins, including other epigenetic enzymes and transcription factors. CREB-binding protein/p300 (CBP/p300)-mediated hyperacetylation of RelA is critical for NF-κB activation [17]. Hyperglycemia activates NF-κB by recruiting the transcriptional coactivator CBP/p300. Increased histone acetylation and DNA unwinding allow RNA polymerase to access DNA, leading to pro-inflammatory gene expression [17].
Histone deacetylases (HDACs) promote DNA winding and inhibit gene transcription by removing an acetyl group from a lysine residue located at the N-terminus of histone in nucleosomes [1518]. There is mounting evidence that HDACs play a crucial part in modulating inflammation. Altered HDAC activation can lead to various diseases, such as renal fibrosis, metabolic disorders, diabetes, cardiac hypertrophy, and Alzheimer’s disease [19]. Therefore, studying HAT and HDAC can provide important data for preventing diabetes and its related complications. Dietary factors, such as fisetin, luteolin, and gallic acid, have a positive effect on various diseases, such as diabetes, asthma, and cancer, by regulating HDAC and HAT activity [151720].
Sodium butyrate (NaB) is a short-chain fatty acid and an end metabolite typically produced by the intestinal microbial fermentation of dietary fiber. It is found mainly in butter and Parmesan cheese [21]. NaB can induce cell differentiation, growth arrest, cell death, and epigenetic modification [22]; it is best known as a HDAC modulator. Recently, studies have shown that treating diabetic rats with NaB reduced insulin resistance and beta cell death and improved plasma insulin levels and glucose homeostasis through the regulation of MAPK [23].
This study hypothesized that NaB prevents pro-inflammatory cytokine secretion by regulating histone acetylation/deacetylation through the NF-κB signaling pathway. Hence, the effects of NaB on regulating the NF-κB signaling pathway, inflammatory gene expression, and HAT and HDAC activity were evaluated using HG-treated human monocytes.
Go to : 
MATERIALS AND METHODS
Materials
NaB was purchased from Sigma-Aldrich (St. Louis, MO, USA). IL-6 and TNF-α ELISA kits were also obtained from Abcam (Cambridge, MA, USA). HDAC and HAT assay kits were acquired from Biovision (Mountain View, CA, USA). Real-time quantitative polymerase chain reaction (qPCR) primers were procured from Bioneer (Daejeon, Korea). Antibodies against TNF-α, NF-κB p65, acetylated NF-κB p65, p300, and acetylated CBP/p300 were supplied by Cell Signaling Technology (Beverly, MA, USA). The BCATM protein assay kit was bought from Pierce (Rockford, IL, USA). All other chemicals, unless otherwise stated, were obtained from Sigma-Aldrich.
Cell culture and sample treatment
The human monocytic THP-1 cell line was obtained from the Korean Cell Line Bank (Seoul, South Korea). The THP-1 cells were cultured in RPMI 1640 medium (Welgene, Daegu, Korea) supplemented 5% CO2 at 37°C. THP-1 cells (1 × 10⁵ cells/mL) were treated with NaB in the presence of an osmotic control (14.5 mM mannitol) for 48 h under normoglycemia (NG, 5.5 mM glucose) or high glucose (HG, 20 mM glucose) conditions. Next, the medium was stored for the cytokine release measurement, and the cells were harvested after washing with phosphate-buffered saline (PBS).
Measurement of cell viability
The cytotoxicity of NaB on cultured THP-1 cells was measured according to the manufacturer’s protocol of the Cell Counting Kit-8 (CCK-8; Dojindo Molecular Technologies, MD, USA). THP-1 cells were seeded in 96-well plates at 4 × 10³ cells/well and treated with NaB for 48 h. The absorbance was measured using a Wallac EnVision microplate reader (PerkinElmer, Turku, Finland).
Enzyme-linked immunosorbent assay (ELISA)
The cytokine levels were determined using an ELISA kit (Abcam) according to the manufacturer’s instructions. The values for analysis were calculated based on a standard curve.
Evaluation of mRNA levels
The total RNA was isolated with TRIzol reagent (Thermo Fisher Scientific, Waltham, MA, USA). The concentration of RNA was measured at absorbance 260 and 280 nm using a NanoDrop 2000 (Thermo Fisher Scientific). The cDNA templates were synthesized using 2 μg of total RNA on an Omniscript RT kit (Qiagen, Hilden, Germany). SYBR green-based quantitative PCR was performed with a Stratagene Mx3000P Real-Time PCR system and Brilliant SYBR Green Master Mix (Stratagene, San Diego, CA, USA) according to the manufacturer’s protocols. The primers designed with an online program (Bioneer) were as follows: human TNF-α, Forward 5’-CAATGTAGGAGCTGCCTTGG-3’ and Reverse 5’-CAGAGGCTCAGCAATGAGTG-3’; human IL-6, Forward 5’-AGTGGCTGCAGGACATGACA-3’ and Reverse 5’-CAATCTGAGGTGCCCATGCT-3’.
The data were normalized using glyceraldehyde 3-phosphate dehydrogenase as a housekeeping gene and analyzed using the 2-ΔΔCT value method.
Measurement of HAT and HDAC activity using ELISA
The cells were treated with NaB for 48 h and harvested to prepare 50 μg of nuclear lysate. The nuclear lysates were used to measure the HAT and HDAC activity. The experiment was carried out according to the manufacturer’s protocol, and the absorbance was measured at 405 and 440 nm.
Immunoblot analysis
Protein (20 μg) was mixed with buffer (100 mM Tris-HCl at pH7.5, 1% 2-mercaptoethanol, 2% glycerol, 2% sodium dodecyl sulfate, and 0.01% bromophenol blue), incubated at 100°C for 5 min, and loaded on 8–12% polyacrylamide gels. Electrophoresis was performed using the Mini Protean 3 Cell system (Bio-Rad, Hercules, CA, USA). Subsequently, the protein was transferred to a nitrocellulose membrane (Life Technologies, Carlsbad, CA, USA) and blocked in a blocking buffer (5% nonfat dry milk) for 2 h. The membranes were incubated with the primary antibody, washed, and incubated for 2 h with the diluted secondary antibody. The membranes were washed 3 times (10 min each) and visualized and photographed with a Chemidoc MP System (Bio-Rad) using an ECL assay kit (Amersham GE Healthcare, Chicago, IL, USA).
Immunoprecipitation assays
The cell nuclear fractions were isolated according to the manufacturer’s protocol. After removing 300 µg protein with Protein A/G and agarose (Santa Cruz Biotechnology Inc., Santa Cruz, CA, USA) at 4°C for 1 h, the supernatant was transferred to a new tube and incubated at 4°C overnight with the antibody (2 µg/mL). After incubation, the samples were combined with 40 μL of protein A/G and agarose at 4°C for 2 h. After microcentrifugation, the sample was washed 3 times with PBS, combined with 15 µL of 2× SDS buffer, and then subjected to immunoblot analysis.
Statistical analysis
The experiments were performed at least 3 times, and the results are expressed as the mean ± SD. A significance test was performed using the SPSS statistical program (SPSS Institute, Chicago, IL, USA). The statistical significance test used a one-way analysis of variance and the multiple range test of Tukey’s HSD test, and the significance was shown at the levels of #
P < 0.05, ##
P < 0.01 compared to NG; *P < 0.05, **P < 0.01 compared to HG.
Go to :
RESULTS
Cytotoxic effects of NaB in HG-treated THP-1 cells
The non-cytotoxic concentrations in HG-treated THP-1 cells were observed using a CCK-8 assay (Fig. 1A). No toxicity was detected after treatment with 1–30 μM NaB for 48 h. Therefore, the non-toxic concentration range of NaB (1–30 μM) was used in further studies (Fig. 1B).
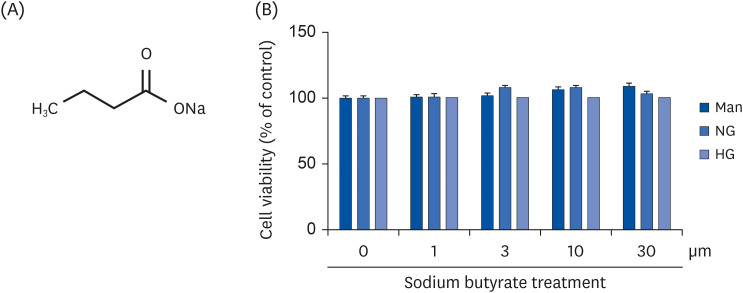 | Fig. 1Cytotoxicity of NaB to cultured HG-treated THP-1 cells. (A) Chemical structure of NaB. (B) The effect of NaB on the cell viability after 48 h was evaluated by the CCK-8 assay. Human monocytic THP-1 cells (1 × 10⁵ cells/mL) were cultured in the presence of an osmolar control (14.5 mmol/L mannitol), under NG (5.5 mmol/L glucose) or HG (20 mmol/L glucose) conditions, or in the absence or presence of NaB (0, 1, 3, 10, 30 μM) for 48 h. The cell culture media was collected for the measurement of cytokine release. The data represent the mean ± SD of 3 independent experiments.CCK-8, Cell Counting Kit-8; NaB, sodium butyrate; Man, mannitol; NG, normoglycemia; HG, high glucose.
|
Effects of NaB on inflammatory cytokines production of HG-treated THP-1 cells
Mannitol did not affect cytokine release as a hyperosmolar control, but the cytokine levels were significantly higher in the HG-treated cells than in the NG-treated cells. By contrast, the NaB treatment suppressed the mRNA levels of IL-6 and TNF-α in HG-treated THP-1 cells (Fig. 2A). The effects of NaB on inflammatory cytokine expression were determined by measuring the TNF-α levels using ELISA and immunoblotting assays of the nuclear lysates. As shown in Fig. 2B and C, the NaB treatment remarkably decreased the secretion of TNF-α in HG-treated THP-1 cells.
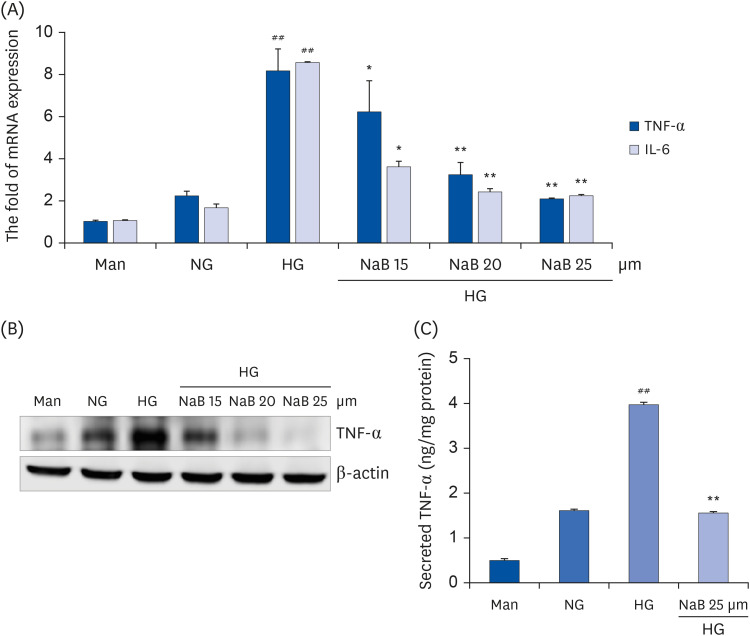 | Fig. 2NaB-mediated inhibition of cytokine release in HG-treated THP-1 cells. (A) Cells (1 × 10⁵ cells/mL) were treated with NaB for 48 h, and the mRNA levels were evaluated by a quantitative real-time polymerase chain reaction. (B) Cell lysates were prepared, and TNF-α levels were evaluated by western blot analysis, as described in the Materials and Methods section. Equal protein loading was confirmed by stripping the immunoblot and reprobing it for β-actin protein. The immunoblots shown here are representative of 3 independent experiments. (C) TNF-α in the cell media was measured using an ELISA assay kit. The cytokine levels in the media were measured using an ELISA assay kit according to the manufacturer’s instructions. The values were calculated based on the assay’s standard curve. The data represent the mean ± SD of 3 independent experiments.NaB, sodium butyrate; Man, mannitol; NG, normoglycemia; HG, high glucose; TNF-α, tumor necrosis factor-α; IL-6, interleukin-6; ELISA, enzyme-linked immunosorbent assay.
##P < 0.01 compared with NG; *P < 0.05, **P < 0.01 compared with HG.
|
Modulatory effect of NaB on HAT and HDAC activity of HG-treated THP-1 cells
The mechanism for the NaB-induced suppression of cytokine gene expression in monocytes was examined. A study was conducted to obtain additional data on the mechanism of NaB-induced inflammatory cytokine downregulation. ELISA was used to examine the effects of the NaB treatment on HDAC and HAT activity. As shown in Fig. 3A and B, HAT activity was significantly increased, and the HDAC activity decreased (P < 0.01) under HG conditions compared to NG-treated cells. On the other hand, the NaB treatment increased the HDAC activity, but there was no significant difference between the HG treatment and NaB treatment in THP-1 cells. The level of the relevant HAT protein using immunoblotting was also investigated. The HG-treated cells showed significant upregulation and an acetylation level of p300 compared to NG-treated cells (Fig. 3C). Mannitol treatment did not affect p300. On the other hand, p300 activation was inhibited by NaB (25 μM) treatment. In addition, the levels of acetylated CBP/p300 in HG-treated cells were reduced significantly by the NaB treatment (Fig. 3C-E).
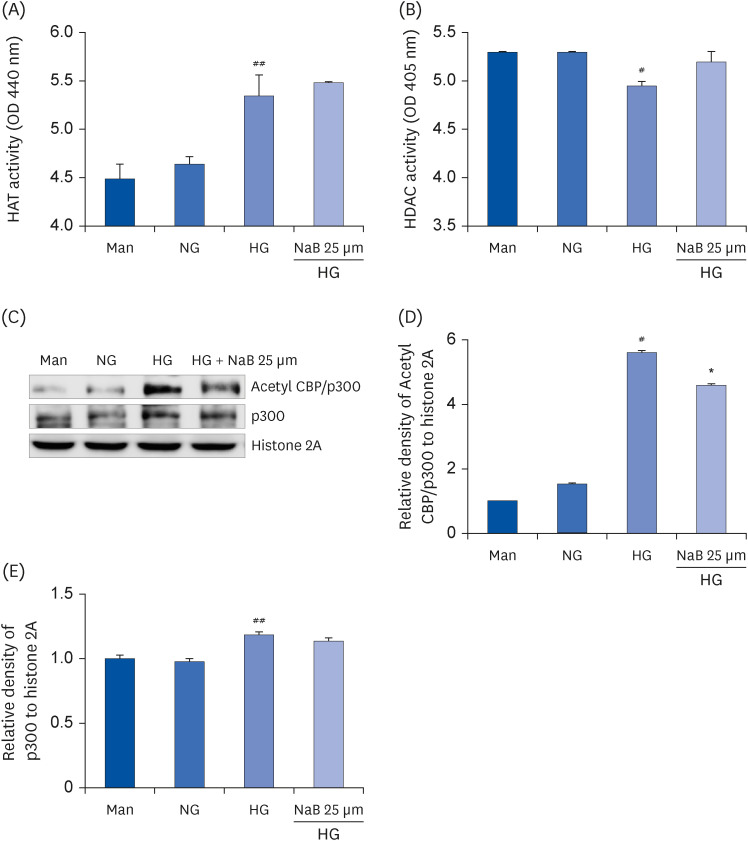 | Fig. 3Effect of NaB on the HAT and HDAC activity as well as p300 and Acetyl CBP/p300 levels in HG-treated THP-1 cells. The cells were harvested after 48 h of the NaB treatment, and nuclear lysates were prepared. The samples were analyzed to determine the HAT (A) and HDAC activity (B). After nuclear protein extraction, the p300 and Acetyl CBP/p300 levels (C) were evaluated by western blot analysis. Densities of (D) Acetyl CBP/p300, (E) p300 normalized to β-actin using ImageJ software. The data represent the mean ± SD of 3 independent experiments.NaB, sodium butyrate; Man, mannitol; NG, normoglycemia; HG, high glucose; HAT, histone acetyltransferase; HDAC, histone deacetylase; CBP/p300, CREB-binding protein/p300; OD, optical density; Acetyl, acetylated.
#P < 0.05, ##P < 0.01 compared with NG; *P < 0.05 compared with HG.
|
Effect of NaB on NF-κB p65 activation in HG-treated THP-1 cells
Histone acetylation is associated with the acetylation of the RelA/p65 subunits of NF-κB and increased NF-κB activation [24]. Accordingly, the effects of NaB on NF-κB activity and p65 acetylation in HG-treated THP-1 cells were confirmed. NaB reduced the phosphorylation and acetylation of NF-κB p65 in the nuclear fraction of HG-treated THP-1 cells (Fig. 4).
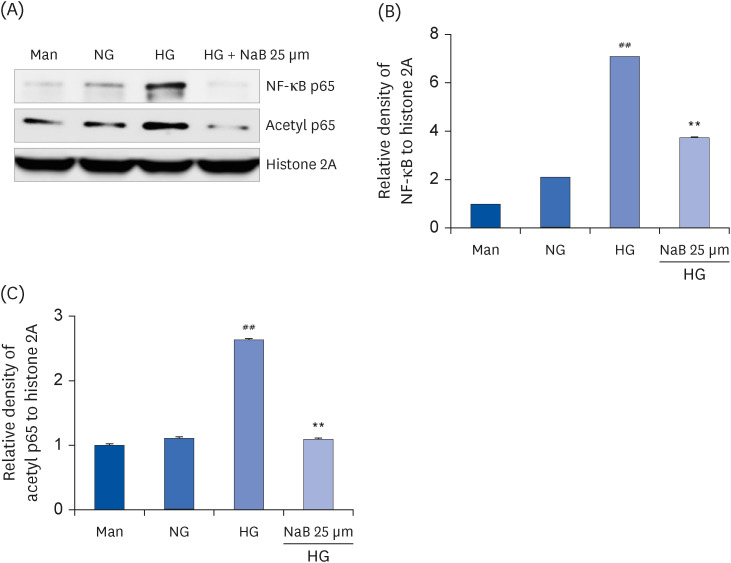 | Fig. 4NaB-induced suppression of NF-κB activation in HG-treated THP-1 cells. (A) The protein levels were evaluated by western blot for NF-κB p65 and Acetyl p65. An equal protein loading was confirmed by stripping the immunoblot and reprobing it for the histone 2A protein. Densities of (B) NF-κB p65, (C) Acetyl p65 normalized to β-actin using ImageJ software. The data represent the mean ± SD for 3 independent experiments.NaB, sodium butyrate; Man, mannitol; NG, normoglycemia; HG, high glucose; NF-κB, nuclear factor-κB; Acetyl, acetylated.
##P < 0.01 compared to NG; **P < 0.01 compared with HG.
|
Effect of NaB on the interaction between inflammation-involved genes and p300
HG conditions induce the recruitment of the transcription activator molecule p300, which maintains HAT activity to activate transcription factors, such as NF-κB. This activation triggers DNA unwinding and histone acetylation, giving DNA polymerase access to DNA and leading to pro-inflammatory gene expression. HDAC activity induces cross-linking with HAT and RelA/p64 for repressor gene transcription [25]. Therefore, the effects of NaB on the interaction between p300 and NF-κB were investigated. NaB decreased the interaction of p300 in acetylated NF-κB and TNF-α (Fig. 5). Hence, NaB is related to reduced TNF-α gene transcription in HG-conditioned monocytes.
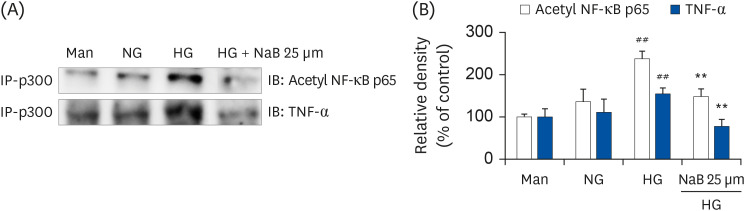 | Fig. 5NaB-induced interaction of p300 with Acetyl p65 and TNF-α in HG-treated THP-1 cells. (A) The cells were treated with NaB for 48 h, and nuclear lysates were prepared. p300 was immunoprecipitated, and the interaction with Acetyl p65 and TNF-α was assessed by western blotting. The immunoblots shown here are representative of 3 independent experiments. (B) Quantitative representation of Acetyl p65 and TNF-α in p300. The data represent mean ± SD for 3 independent experiments.NaB, sodium butyrate; Man, mannitol; NG, normoglycemia; HG, high glucose; NF-κB, nuclear factor-κB; TNF-α, tumor necrosis factor-α; Acetyl, acetylated.
##P < 0.01 compared with NG; **P < 0.01 compared with HG.
|
Go to :
DISCUSSION
HG is a major determinant of the onset and progression of diabetic nephropathy in T1DM and T2DM [78]. The HG state activates the expression of inflammatory cytokines, transcription factor NF-κB, pro-inflammatory cytokine C-reactive proteins, IL-6, and TNF-α in monocytes. Bierhaus et al. [26] reported that activation of the transcription factor NF-κB affects chronic diseases. Therefore, targeting the inflammation pathway can be a possible strategy for regulating and preventing diabetes and secondary complications.
The extent of NF-κB activity is regulated by RelA/p65 acetylation and deacetylation mediated by HAT and HDAC, respectively. The p65 protein is a key factor in NF-κB activation, and several coactivators, such as CBP/p300, enhance its transactivation potential [17]. CBP/p300-mediated hyperacetylation of RelA is critical for NF-κB activation [17]. Multiple acetylation sites on p65Acetylation at lysines 218, 221, and 310 differentially regulate the RelA DNA binding activity, assembly with IκBα, and transcriptional activity. Acetylation at lysine 221 enhances DNA binding by p65 and inhibits its interaction with IκBα, whereas acetylation at lysine 310 is required for full transcriptional activity [17]. Accordingly, reduced p65 acetylation is a potential molecular target for preventing chronic inflammation.
Antagonism of HAT/HDAC plays a key role in modulating chromatin remodeling and regulating pro-inflammatory responses. Nevertheless, little is known about the effects of NaB by HAT/HDAC and regulatory mechanisms on the chromatin levels under diabetic conditions.
NaB is non-toxic and is produced naturally in the large intestine through microbial fermentation [21]. The present study showed that NaB exerts anti-inflammatory effects under HG conditions, which are associated with chromatin remodeling and histone modifications in monocytes and other cells. In particular, NaB appears to have anti-inflammatory effects mediated by the inhibition of HDAC and signaling pathways, such as NF-κB.
As shown in Fig. 1, toxicity was not observed for 48 h at 1–30 μM of NaB, and 25 μM showed the highest anti-inflammatory effect (Fig. 2). Therefore, 25 μM NaB was applied for a detailed investigation of NF-κB physiological and epigenetic modulation effects. The NaB treatment (25 μM) in HG-treated THP-1 cells suppressed the expression of NF-κB target genes, including pro-inflammatory cytokines. This paper presented new data showing that NaB prevents HG-treated nuclear p65 translocation, demonstrating that hyperacetylation is essential for NF-κB activity and translocation under hyperglycemic conditions. Therefore, NaB inhibits the NF-κB transcriptional activity by interfering with HG-treated p65 acetylation at lysine 310.
These results confirmed that a NaB treatment in HG-treated THP-1 cells suppressed the expression of inflammatory cytokines (TNF-α, IL-6) and NF-κB target genes. Attenuation of p65 acetylation is a potential molecular target for preventing chronic inflammation. NaB prevents the release of inflammatory cytokines by controlling the acetylation of NF-κB p65 and HAT activity caused by hyperglycemia. Therefore, NaB is expected to be a natural therapeutic agent for treating chronic inflammation and the complications caused by diabetes.
Go to :
 XML Download