

 PDF
PDF Citation
 Print
Print


INTRODUCTION
The coronavirus disease 2019 (COVID-19) pandemic has affected the entire world population in many ways. As of January 27, 2022, the total number of confirmed cases of COVID-19 reached 362 million people, with about 5.6 million deaths worldwide [1]. To manage the spread of the virus and minimize the casualty and breakdown of the health system, many governments issued various measures of physical distancing, including lockdown and curfew. It has been suggested that this unprecedented global health crisis affected people’s mental and physical health through various day-to-day behavioral choices [234]. In Korea, the first case was confirmed on January 20, 2020, and since then the country is experiencing multiple waves of the COVID-19 outbreaks. As of January 27, 2022, the total number of confirmed cases reached 777,497 with 6,654 deaths [5]. Compared to other countries, the infection rate and case fatality are low. However, due to the delayed vaccine administration and the spread of more contagious variants, the government has remained high restriction level. These restrictions include strong recommendation for work from home, limited school opening, banning social gathering larger than group of 6, and only allowing take-outs and delivery for restaurants after 9 pm.
Various studies were conducted to examine how people are coping with this “new normal”. Some studies conducted in European countries, where the strictest distancing measures were implemented during the early spread of the virus in 2020, showed that staying at home for an extended period due to lockdown and quarantine leads to a great level of stress among citizens and further changes in diet [6]. The consumption of energy-dense food has increased during lockdown, especially sweets, cookies, and cakes, along with the frequency of uncontrolled eating and snacking between meals [78910]. Stress-related emotional eating has been an issue during lockdown among people with psychosocial preconditions [611].
Food purchase patterns have also been affected as people go to food stores less often during the lockdown and purchase less fresh produce and more frozen and shelf-stable products [1213]. Data from the European Foundation for Innovation (INTEC) showed that online food shopping and the consumption of take-outs or delivery foods increased after the pandemic [1214]. Recent national data from South Korea also revealed a sharp increase in purchases of meal kits and home meal replacements (HMRs) since the outbreak of the virus, and the trend was more salient among the younger age groups. In addition, sales of healthy functional foods claiming to boost immunity was also found to be increased [15].
Social and physical distancing affected leisure time and occupational physical activity. Many people worked from home, which led to increases in being sedentary and screen time and a further decrease in physical activity [91617]. Studies have shown that the majority of the world’s population experienced reduced physical activity to some degree, and there is concern that overweight and obesity statuses would be a more profound public health issue during and after pandemic outbreaks [18].
However, not everyone has been affected in the same way. A study conducted in Spain suggested that some people consumed a healthier diet during lockdown, as measured by Mediterranean diet adherence scores [1419], due to staying at home longer and having more time to prepare meals [20]. Similarly, another study in Croatia showed that the Mediterranean diet adherence scores increased during the pandemic, possibly due to the increased frequency of home cooking. This phenomenon was further associated with an increase in vegetable, legume, fish, and seafood consumption [21].
The pandemic outbreak and subsequent physical confinement would affect people with different socioeconomic backgrounds differently. People with jobs in the sectors that were most influenced by the lockdown (such as restaurants, travel, and entertainment industries) or with less job security suffered more due to household food insecurity [22]. Since people with malnutrition due to food insecurity and the relative lack of resources had a greater chance of being infected [23], it will be important to understand the subgroup of people who were most negatively affected by the pandemic.
Most of the previous studies were conducted in European countries through web-based surveys during the early lockdowns in 2020. Despite its value, as most of the data collection was web-based, it is difficult to generalize the results, as people with higher education attainment, females, and relatively young participants were surveyed [821], potentially resulting in bias, as healthier and less stressed participants answered the survey. We analyzed the data from the Seoul Food Survey (SFS), which has a representative sample of citizens of Seoul, surveyed with face-to-face interviews. The objective of this paper is to analyze the patterns of changes in eating, food purchasing and preparation, physical activity, and subjective health after COVID-19, if there are any, and how those changes differed for various sociodemographic factors. Moreover, we sought to determine which factors were associated with changes in subjective health.
Go to : 
SUBJECTS AND METHODS
Study design and data collection procedure
This study used data from the 2020 SFS, a citywide cross-sectional survey conducted by the City of Seoul, South Korea. This survey was established to monitor food-related psychosocial and behavioral factors among representative Seoul citizens and to assess needs for planning future food policies. The survey was started in 2018 by the Food Policy Team at the Seoul Metropolitan Government and has been conducted annually. Using a stratified and multistage clustered probability sampling method, a total of 3,833 citizens aged more than 18 years old from 2,000 households participated in SFS in 2020. The sampling was based on national census data from 2019.
Trained data collectors from a survey firm, K-stat, visited the selected households to administer the questionnaires, and if any household members were not home during the first visit, the questionnaires were left and collected after the participants filled out the form. The data collectors checked all the missing responses upon retrieving the questionnaires in person or by phone, whichever was more convenient for the participants. The participants were granted a gift certificate to local stores. The data collection was conducted from September 25 to October 30, 2020. Written informed consent was obtained from all participants, and the study protocol was approved by the Dankook University Institute Review Board (DKU 2020-01-006).
Measures
Sociodemographic data, weight status, and food insecurity
In this study, sociodemographic information regarding gender, age, education level, household types, occupations, type of employment, monthly household income, subjective social class, and food security status was measured. These variables were recategorized for data presentation and analyses. For age, we categorized the subjects into 6 groups: 18–29, 30–39, 40–49, 50–59, 60–69, and more than 70 years old. For education attainment, subjects were categorized into 3 groups: less than high school, high school graduates, and more than college entrance. In terms of the composition of household members, we categorized the subjects into 4 groups: one person households, households with couples, households with 2 generations, and others. Occupations were categorized as professionals, service/sales, manual workers, students, housewives and unemployed. All workers with jobs were further divided into wage workers with permanent positions, temporary or contract-based positions, business owners (self-employed), and others. Monthly household income was measured, presented in Korean Won (KRW) and categorized into 5 groups: < 2 million, 2–3.5 million, 3.5–5 million, 5–7 million, and ≥ 7 million KRW. Subjective social class was measured on 5 scales: lowest, lower middle, middle, upper middle, and highest. Food security status was measured with one question, stated as “please select one that best describes your household situation in the past year: 1) we could eat sufficient foods in both quality and quantity, 2) we could eat enough foods, but could not meet the quality we desire, 3) we sometimes could not eat sufficiently, and 4) we often could not eat sufficiently”. The participants with the first choice were categorized into “quantity and quality sufficient”; the participants with the second choice were categorized into “quantity sufficient but not quality”; and the participants with the third and fourth choices were categorized into “quantity and quality insufficient”. Weight status was based on the height and weight responses from the participants. A body mass index (BMI, kg/m2) less than 18.5 was categorized as underweight, 18.5–22.9 as normal, 23–24.9 as overweight, and greater than 25 as obese [24].
Changes in household income, food expenditure, food preparation and purchase practices after the pandemic
The participants were asked whether their household income and household food expenditure were diminished after the outbreak of COVID-19 (February 2020) in a yes or no answer format. Similarly, 5 questions were asked regarding their changes in food preparation and purchase practices before and after the pandemic: 1) frequency of home cooking, 2) frequency of having foods from convenience stores (CVS) for regular meals, 3) frequency of delivery and take-out usage, 4) frequency of ready-made and instant food usage and 5) frequency of online food purchasing. The answer formats were on a 5-point Likert scale: 1) decreased by a large amount, 2) decreased slightly, 3) no change, 4) increased slightly, and 5) increased by a large amount.
Changes in eating amount, physical activity, weight, and subjective general health after the pandemic
The self-assessed changes in eating amount, level of physical activity, weight, and subjective general health were assessed on a 5-point Likert scale, from ‘decreased a lot’ as 1 (or deteriorated a lot in general health) to ‘increased a lot’ as 5 (or improved a lot in general health).
Statistical analysis
We applied individual sampling weights in all analyses, which allowed us to calculate the representative values for current Seoul citizens. P-values for % differences were calculated by the chi-square test. The χ2 test could not be performed directly from the tabulation because of the nonintegral values in the cells after using sampling weights. Therefore, after rounding up the first decimal points for each cell in the tabulation, χ2 tests were performed. To identify the influences on changes in subjective general health, we built a series of a generalized ordinal logistic regression models, not assuming proportional odds between groups.
The outcome variable was changes in subjective general health, categorized into 3 groups: 1) deteriorated after the COVID-19 outbreak, 2) no change, and 3) improved after the COVID-19 outbreak. Odds ratios (ORs) were calculated for various subgroups of participants using dummy variables for gender, age group, education attainment, weight status, monthly household income, subjective social class, and food security status for model 1. In model 2, additional factors were added: decreased household income only or decreased household income and food expenditures after COVID-19, with no change being the reference group. In model 3, changes in food preparation and purchase practices and changes in eating amount, physical activity, and weight were further added to the model. These changes were evaluated on a 5-point scales, from 1 denoting a considerable decrease to 5 denoting a considerable increase. All models were further adjusted for household type, occupation, and employment status for any potential confounding effect.
To check the model fitting properties, the Akaike information criterion (AIC) was calculated and added to the final models. We checked the multicollinearity for all these regression models, and the variance inflation factor was less than 2 for all 3 models, which is an indicator of no multicollinearity. All statistical analyses were conducted using STATA 16.0 (StataCorp LLC, College Station, TX, USA).
Go to :
RESULTS
Sociodemographic characteristics, weight status, and food security status of the participants, SFS
The distribution of sociodemographic factors, weight status, and food security status are presented in Table 1. A total of 3,833 people participated in the study, 47.7% of whom were men and 52.3% of whom were women. The ages were evenly distributed from 18 to 70 years old. Regarding weight status, 49.8% were normal, 25.6% were overweight, 20.8% were obese, and 3.9% were underweight. In terms of monthly average household income, 27.7% of the households responded that their household income was between 5 and 7 million KRW. Finally, 17.8% of participants mentioned that they ate enough in terms of quantity but not quality, and 5.6% answered that they lacked both quantity and quality over the past year.
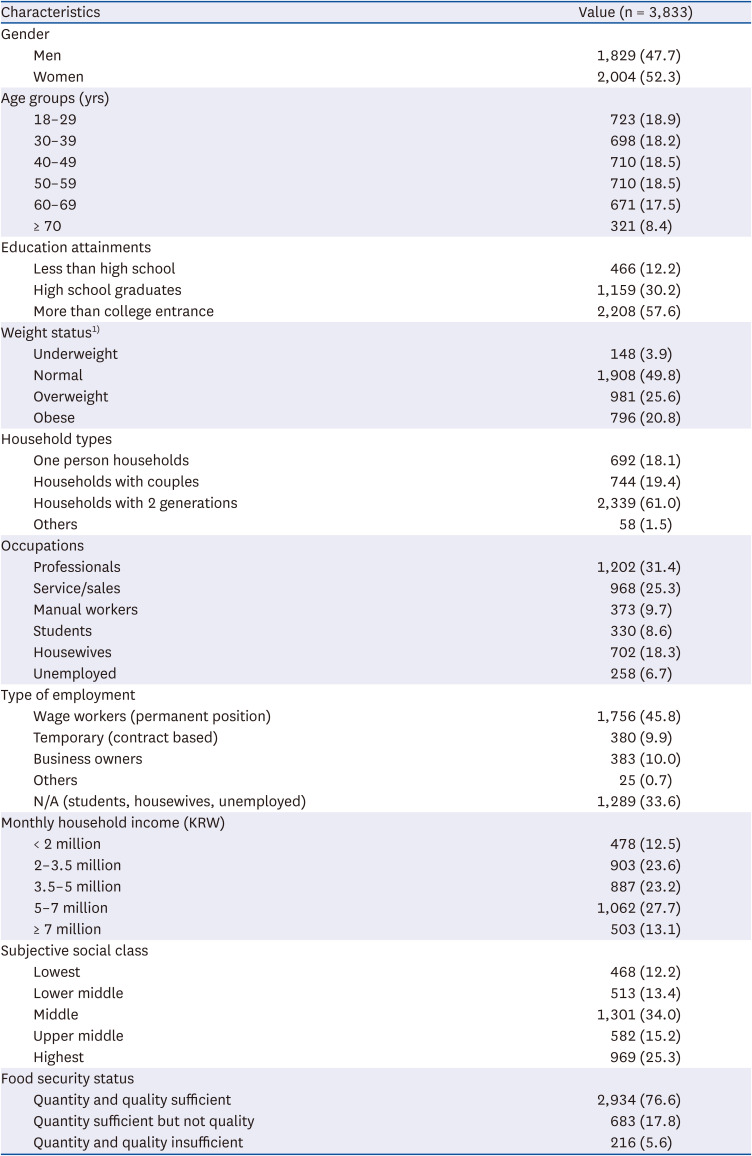
Table 1
Sociodemographic characteristics of the study sample, Seoul Food Survey
Values are presented as number (%).
KRW, Korean Won.
1)Weight status was categorized based on body mass index (kg/m2): underweight < 18.5, normal 18.5–22.9, overweight 23–24.9, and obese ≥ 25.
![]()
Changes in household income and expenditure on food during COVID-19
Table 2 shows which participants lost income after COVID-19. A total of 31.1% of participants responded that their household income decreased after the pandemic. Except for gender, all sociodemographic factors, weight status, and food security status were associated with a decreased income. For example, people in their 50s and 60s, who are obese, who work in service/sales and manual jobs, with temporary jobs and business owners, with 3.5–5 million KRW monthly household income, and with food insecurity, were more likely to report that their household income has decreased after COVID-19 (P < 0.001).
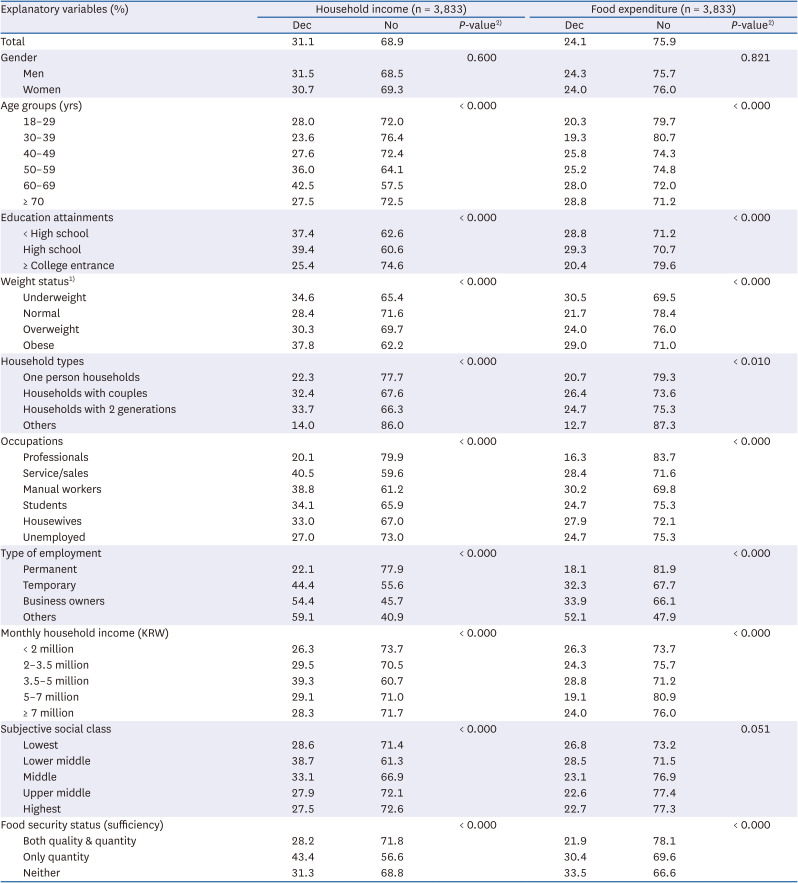
Table 2
Changes in household income and expenditure on food during coronavirus disease 2019
KRW, Korean Won; Dec, decreased.
1)Weight status was categorized based on body mass index (kg/m2): underweight < 18.5, normal 18.5–22.9, overweight 23–24.9, and obese ≥ 25.
2)
P-values for % differences among the groups were calculated using the χ2 test.
![]()
Similarly, those who were older, were underweight or obese, had less secure jobs, and had food insecurity were more likely to respond that they had decreased their spendings on food (P < 0.001). For example, the group lacking both quantity and quality of food had the highest reduction in food expenditure at 33.5% (P < 0.001), whereas 21.9% of the food secure group reduced their food expenditure (P < 0.001).
Changes in food preparation, intake and purchase patterns after COVID-19
Table 3 shows which participants had changes in food consumption and purchase patterns (home cooking, meals from CVS, delivery/take-outs, ready-made and instant foods, and online food purchases) since COVID-19. The 45.6% of participants reported that they cook more after the pandemic. The largest participants between 18–29 years old reported that they increased usage of CVS for meals (41.9%) (P < 0.001). The proportion of people who increased their frequency of using delivery/take-outs was the highest at 52.9%. The changes in frequency of delivery food and take-outs also appeared to differ for different subgroups, especially age, education level, household income, subjective social class, and status of food security. Higher income groups had a higher proportion of people with increased delivery and take-outs, ranging from 52.1% to 61.0% (P < 0.001), indicating that delivery and take-outs are greatly affected by the economic situation. Other socioeconomic status (SES) variables showed similar patterns. The 48.3% of participants reported increased online food shopping. Most sociodemographic factors, weight status, and food security status were associated with changes in food consumption and purchase patterns.
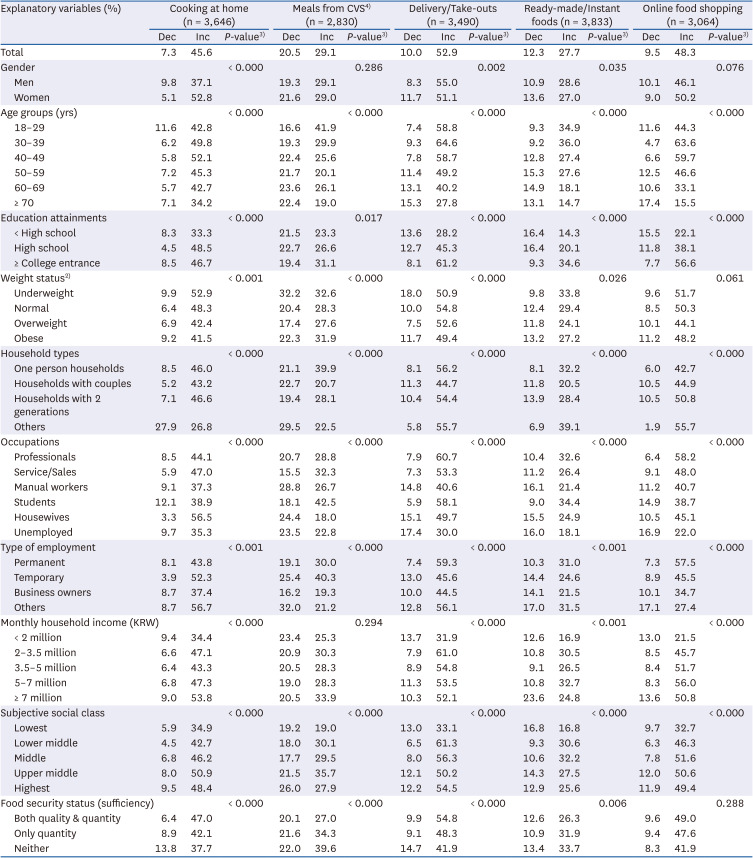
Table 3
Changes in food preparation and purchase patterns after coronavirus disease 20191)
KRW, Korean Won; CVS, convenience stores; Dec, decreased; Inc, increased.
1)The total numbers of responses vary due to the missing values.
2)Weight status was categorized based on body mass index (kg/m2): underweight < 18.5, normal 18.5–22.9, overweight 23–24.9, and obese ≥ 25.
3)The P-values for % differences among the groups were calculated using the χ2 test.
![]()
Changes in health behaviors and health indicators after COVID-19
Table 4 shows the changes in eating amounts, physical activity level, and weight, after COVID-19 using multivariate generalized ordered regression analyses. People who were underweight, were at the highest subjective social class, had food insecurity, and had decreased income and food spending were associated with reporting decreased eating amount after COVID-19. On the other hand, being women, being overweight and obese were associated with increased eating amount after the pandemic.
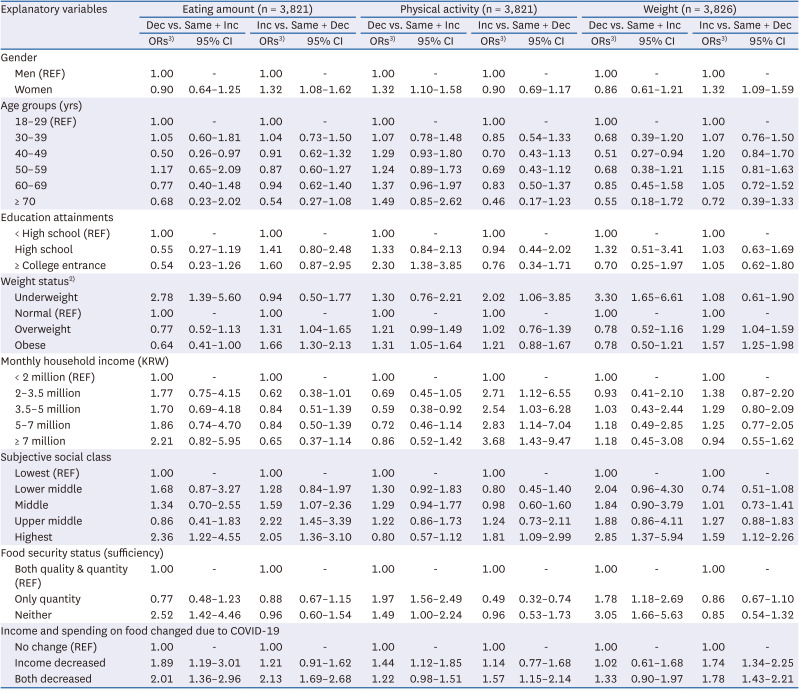
Table 4
Changes in health behaviors and health indicators after COVID-19 outbreak using a generalized ordinal logistic regression analysis1)
Values were further adjusted for household type, occupation, and employment status for any potential confounding effect.
COVID-19, coronavirus disease 2019; KRW, Korean Won; Dec, decreased; Inc, increased; OR, odds ratio; CI, confidence interval.
1)The outcome variable was changes in health behaviors, and health indicators categorized into 3 groups: 1) decreased, 2) no change, 3) increased after COVID-19. For more intuitive readings, the second columns of each result (Inc vs. Same + Dec) had the reverse coding. For example, the ORs greater than 1 can be interpreted as the likelihoods of increasing eating amount, physical activity, and weight.
2)Weight status was categorized based on body mass index (kg/m2): underweight < 18.5, normal 18.5–22.9, overweight 23–24.9, and obese ≥ 25.
3)ORs were obtained by a generalized ordered logistic regression.
![]()
The changes in physical activity were also highly associated with weight status. People with obesity were 1.3 times more likely to report decreased physical activity. Conversely, underweight participants significantly increased physical activity after the pandemic. Those participants who were women, had more than a college entrance education, and had food insecurity reported decreased physical activity. Moreover, people with higher household income were statistically significantly associated with increased physical activity.
Compared to participants who were overweight and obese, underweight participants were 3.3 times more likely to report a decrease in weight. In general, higher subjective social class, and people who had food insecurity were statistically significant in explaining losing weight after the pandemic. Having lost household income and food expenditures after COVID 19 was also associated with changes in weight.
Factors affecting changes in subjective general health after the COVID-19 outbreak using ordinal logistic regression analysis
To understand which factors were associated with the changes in subjective general health after COVID-19, 3 generalized ordinal logistic models were built, and the results are presented in Table 5. The ORs in the first model showed that being women, being older, having more than a college entrance education, being obese, and being food insecure were all statistically significantly associated with reporting a worsened subjective general health after COVID-19, compared to the groups with no changes and a better health. When contrasting decreased and no change groups with increased group, only being old lowered the probability of reporting better health after COVID-19.
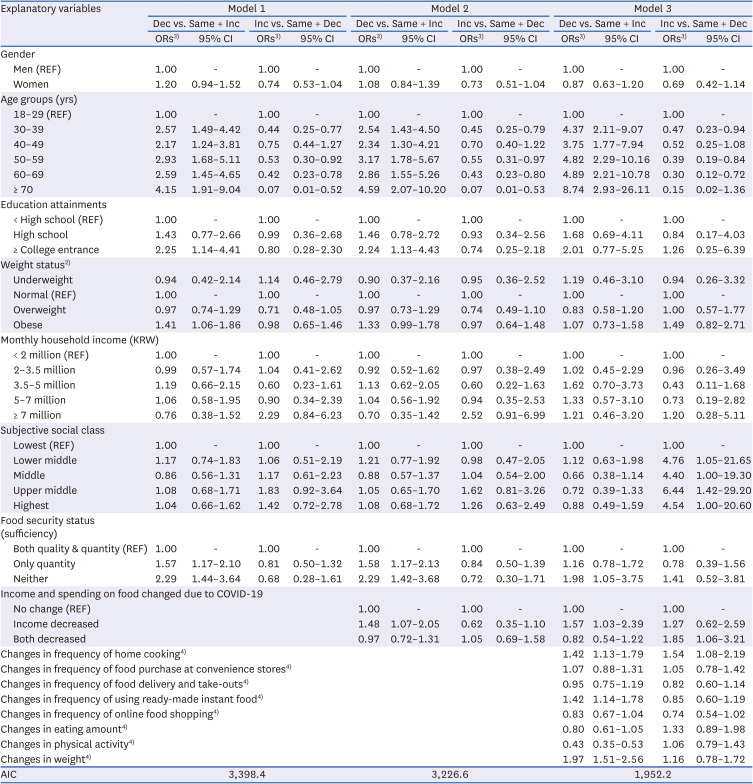
Table 5
Factors affecting changes in subjective general health after the COVID-19 outbreak using a generalized ordinal logistic regression analysis1)
All models were further adjusted for household type, occupation, and employment status for any potential confounding effect.
COVID-19, coronavirus disease 2019; KRW, Korean Won; Dec, decreased; Inc, increased; AIC, Akaike information criterion; OR, odds ratio; CI, confidence interval.
1)The outcome variable was changes in subjective general health, categorized into 3 groups: 1) deteriorated, 2) no change, 3) improved after COVID-19. For more intuitive readings, the second columns of each result (Inc vs. Same + Dec) had the reverse coding. For example, the ORs greater than 1 can be interpreted as the likelihoods of improving subjective health.
2)Weight status was categorized based on body mass index (kg/m2): underweight < 18.5, normal 18.5–22.9, overweight 23–24.9, and obese ≥ 25.
3)ORs were obtained by a generalized ordered logistic regression.
4)Variables for changes in frequencies of food preparation and purchase and eating amount, physical activity, and weight were measured on a 5-point scale: 1) decreased a lot, 2) decreased slightly, 3) no change, 4) increased slightly, 5) increased a lot.
![]()
To generate the second model, changes in household income and spending on food were added to model 1. Most of the ORs remained significant, except for being obese. Those participants who lost household income after COVID-19 were 1.48 times more likely to report deteriorated health conditions, holding other factors constant.
In the final model (model 3), we added all the variables that measured changes in food intake, preparation, purchase, level of physical activity, and weight after COVID-19. Age, food security status, decreased income, changes in home cooking frequency and using ready-made instant foods, changes in physical activity and changes in weight after COVID-19 remained associated with subjective health. It is noteworthy that after controlling for all other factors, those participants who increased their physical activity level after the pandemic were associated with a 57% increased likelihood of reporting improved health conditions. Participants who were older, had food insecurity, and had decreased income and food spending responded that their health conditions were deteriorated after the pandemic after controlling for other factors. The AIC value was the lowest for model 3, which is indicative of the best fit.
Go to :
DISCUSSION
The unprecedented global pandemic since early 2020 has affected all global citizens in a profound way. A representative sample of Seoul citizens from the SFS showed that many people experienced changes in their food preparation, consumption, physical activity, weight, and perceived general health. The most prominent changes were an increased frequency of delivery and take-out usage, online food shopping, and home cooking. Upon further examining the changes by different sociodemographic variables, we found that the patterns of changes in behaviors and health were different for different socioeconomic groups and households with different food security statuses.
Several studies have been published on changes in dietary behavior since the start of the COVID-19 pandemic in South Korea. One study showed that the frequency of delivery food and take-outs increased during the pandemic, with the respondents indicating that they ordered more fast food such as fried chicken, pizza, and hamburgers since the start of the pandemic [25]. Another study with college students showed that their dietary behavior was affected by the fact that classes were administered mainly online. Because these students did not have to leave their homes or dorms to attend classes, they increased the intake of HMR items and delivery food. However, the study also highlighted a positive change in dietary behavior such as decreased frequency of alcohol consumption as a result of social distancing [26].
Previous studies conducted in other countries have shown that changes due to COVID-19 were different for people with different sociodemographic factors. For example, a study conducted in Croatia showed that respondents who were women, had higher education levels, had healthy eating habits before COVID-19, and had a normal weight status had increased scores for Mediterranean diet adherence [21]. Another study from Spain also showed that people who adhered to a Mediterranean diet after the pandemic tended to be women, with higher education attainment, living with family and middle aged (51–65 years old) [14]. Similarly, our study results showed that consumption of meals from convenient stores and ready-made instant foods were more common among younger populations and students. The use of delivery and take-out foods increased more among people with higher education levels, people in their 30s, and households with food security. Online food shopping has increased in greater percentages among people with higher education levels, higher income levels, and in households with food security.
In terms of weight status, various studies have revealed that people with a higher BMI were impacted more negatively than their counterparts with a healthy weight [13]. Studies showed that people who were overweight or obese tended to eat more without feeling hungry during lockdown [712] and further experienced more weight gain [27]. Specifically, one study of Jordanians showed that during COVID-19 quarantine, 36.4% of overweight people and 41.1% of obese people reported a significant increase in body weight, whereas only 12.9% of underweight people reported a significant weight gain [27]. Another study showed that people with a lower BMI purchased more organic produce and consumed more fruits and vegetables [4]. Similarly, this study showed that people who were underweight and had a normal weight status increased their home cooking frequencies more (52.9% and 48.3%, respectively) than people with overweight and obesity (42.4% and 41.5%, respectively) (P < 0.001).
These studies showed that people with a higher BMI before the pandemic were more vulnerable during these stressful and anxious situations. This phenomenon may be explained by maladaptive coping strategies in stressed situations and COVID-related healthy anxiety. It was found that increases in the consumption of snack foods with a high energy density during lockdown were associated with pre-lockdown eating behaviors, such as emotional eating and uncontrolled eating [2]. Emotional eating is defined by the tendency to overeat in response to emotions such as stress, sadness, boredom, and anxiety [28]. Conversely, increases in positive eating practices such as eating more home cooked meals and fruits and vegetables were associated with adaptive coping strategies. Furthermore, greater emotional eating during lockdown was associated with a higher BMI, higher pre-lockdown emotional eating and maladaptive coping strategies [2]. A higher BMI and its associated chronic conditions, such as diabetes and hypertension, are found to be independent risk factors for critical illness and major severity in subjects with COVID-19 [29]. To avoid further risk to people with higher BMI in the era of infectious diseases, it will be important to develop nutrition and mental health interventions for people with overweight and obese weight statuses.
In the multivariable model presented in Table 5, we used changes in general health as a main outcome variable. Without being able to measure functional health in a large population during this pandemic era, perceived health can be a good summary indicator of an individual’s broad range of health-related information [30]. The perceived health measure has been found to be associated with future health care use and mortality, and it has been widely used as an instrument in monitoring population health [3132]. After adjusting for various sociodemographic and economic status indicators, people who managed to increase the level of physical activity during the COVID-19 outbreak responded that their general health had been not changed or improved. However, when contrasting decreased health group and no change group with improved group, the physical activity factor was not statistically significant. This result showed that increasing physical activity may help us not to perceive worse health after the pandemic outbreak. This result is corroborated by another study measuring the relationship between the level of physical activity and self-rated health during the COVID-19 lockdown. The study showed that moderate physical practice predicted better health perceptions. The authors found that this was due to the beneficial impact of physical activity on health perceptions through less anxiety and a more positive mental state during the stressful lockdown [33].
The importance of physical activity in both physical and mental health has been a key issue in health promotion even before the pandemic. However, during the pandemic, there is some evidence showing that regular physical activity is associated with a lower risk of COVID-19 infection and its related mortality [343536]. A nationwide population-based case-control study in South Korea showed that participants with moderate to vigorous physical activity were associated with a lower risk of COVID-19 morbidity (OR, 0.90; 95% confidence interval [CI], 0.86–0.95) and with a lower mortality (OR, 0.47; 95% CI, 0.48–0.88). The authors highlighted the importance of maintaining appropriate levels of physical activity along with social distancing amid the pandemic [36]. One possible mechanism explaining the role of physical activity in reducing the risks of COVID-19 and mortality is boosted immunity and its protective effects against viral infections [37]. Moreover, regular physical activity suppresses inflammation and reduces the risk of overweight and obesity statuses, which are strong risk factors for COVID-19 infection and mortality [38].
It is important to understand who managed to increase the level of physical activity during the pandemic at the population level. Our data showed that people with high income, professional jobs, and normal weight responded that their physical activity increased after COVID-19. This result shows that SES and weight status can mediate the impact of pandemics and social distancing on physical activities. Since the COVID-19 pandemic is still ongoing and we may need to prepare for other pandemics in the future, public health strategies are needed to promote physical activities, especially among people with a low SES and a high BMI, when dealing with infectious diseases.
Not only physical activity but also food insecurity are major factors associated with various changes in health behaviors and indicators during the pandemic. Researchers have shown that the pandemic has impacted people with lower household income more severely and dramatically increased food insecurity, especially among low-income populations [2239]. People with jobs that were most affected by social distancing suffered the most and had the greatest increase in food insecurity in Australia [40]. US data also showed that experiencing food insecurity increased by 30%, and two-thirds of participants reduced their eating amount [41]. In the multivariate model presented in Table 5, food insecurity status was a strong explanatory factor for the deterioration of general health after adjusting for other key factors. Understanding the nutritional needs and health problems among low-income and food-insecure groups during and after COVID-19 and managing these critical issues are not only urgent needed but essential in the post-COVID-19 era.
Increasing usage of ready-made and instant foods was associated with decreased general health after adjusting for key sociodemographic factors (OR, 1.42; CI, 1.14–1.78). Due to its convenience, taste, and price, the usage of ready-made instant food has increased dramatically. During the pandemic, people tended to stock instant foods for their extended shelf life when trips to grocery stores are limited. In an Italian study, 37.5% of the study population reported some increase in ultra-processed foods (UPFs) consumption during lockdown [42]. In a multinational study, increased consumption of UPFs and reduced physical activity were found among adolescents in Latin America during the COVID-19 outbreak [43]. Most instant foods are UPFs, and it has been shown that UPF consumption is associated with an increased risk of obesity, hypertension, and diabetes [444546]. Since these chronic conditions are detrimental to COVID-19 infection risk and fatality [29], it will be crucial to understand the detailed underlying mechanisms to understand the link between instant food consumption and perceived health.
Some recent prospective cohort studies have suggested that the consumption of UPFs can increase the risk of depression. Among the French population, after accounting for a wide range of potential confounders, an increased risk of depression was shown as the consumption of UPF increased in the diet (hazard ratio [HR], 1.12; CI, 1.15–1.27) [47]. Another study conducted in a Spanish population also showed that the incidence of depression was higher among people with higher consumption of UPFs (HR, 1.33; CI, 1.07–1.64) after controlling for potential confounders [48]. Researchers have suggested that nutritional factors, such as high fat, added sugar, processed meat and low intake of fresh fruits and vegetables usually seen in the diet of people who have high UPFs, can be associated with an elevated risk of depression [49]. In addition, the additives in UPFs, such as emulsifiers, or substances resulting from processing at high temperature can affect the gut microbiota, which has been shown to be associated with mental health [5051].
Some limitations of our study should be noted. The major variables of this study were based on perception. For example, the change in perceived general health after the pandemic was asked with one question. Since some studies have suggested that single item measures of perceived health status are not related to any indicator of physical health status [52], the results should be interpreted with caution. In terms of behavioral measures, we did not measure the actual frequencies of the behaviors. By asking about the perception of changes in their health behaviors and health indicators, we may introduce some bias, which may reflect respondents’ chronic health conditions or mental states. These factors were not measured in our study. Last, any formal assessment for testing reproducibility of the questionnaire was not conducted. However, we strived for the content and face validities of the questionnaire by conducting rigorous literature review by the authors and pilot testing with multiple potential respondents. Since this study only used representative samples from the city of Seoul, further study is needed to understand the changes after COVID-19 in areas with different living conditions, such as rural or semi-rural areas.
Despite the limitations, this study was conducted with face-to-face interviews using a representative sample of one of the largest cities in Asia amid the pandemic.
Using a representative sample from Seoul, this study shows the changes in key food- and health-related behaviors after the outbreak of COVID-19. Due to the large sample size from various sociodemographic backgrounds, we showed that the changes in household income, food expenditure, food consumption behaviors and physical activities differed significantly by age, education, occupation, income, weight, and food security status. The data showed that low-income and food-insecure households were affected more severely by the pandemic, and more rigorous public health programs should target these socially disadvantaged groups during and after the pandemic. Younger age, household food security, decreased intake frequency of instant foods, increased physical activity and weight loss were significant factors explaining better or stable perceived health during the COVID-19 pandemic. Our results suggest that focusing on older populations and low-income families with food insecurity should be prioritized during infectious disease outbreaks. In addition, developing strategies for increasing physical activities in a safe way while social distancing measures in place would be important to maintain general health in this prolonged pandemic era.
Go to :
 XML Download