

 PDF
PDF Citation
 Print
Print


INTRODUCTION
The role of school lunches is to provide appropriate nutrition to promote growth, development, and health for target students. The nutritional standards for school lunches are designed to provide balanced diets and help to achieve the role of school lunches. It has been reported that the nutrient intake of students who have school lunches is influenced by the nutritional standards for school lunches [123].
Dietary Reference Intakes (DRIs) and the nutrient intake data of the target students were used to set reference values for nutritional standards for school lunches in several countries [45]. In the United States, after setting a daily target intake using the data from the DRIs for Americans, the School Nutrition Dietary Assessment study (SNDA), and the National Health and Nutrition Examination Survey (NHANES), the reference values were set by multiplying the daily target intake by the ratio of energy consumed at lunch out of a day [6]. In Japan, the reference values were set by multiplying the recommended daily intake of the DRIs for Japanese by a ratio of 33%, 40%, or 50% depending on the kinds of nutrients, considering the nutrient intake of the students using the dietary survey data of elementary and middle school students [7]. In Taiwan, the reference values were set to one-third or two-fifth of the recommended daily intake based on the DRIs for Taiwanese and the data of elementary and middle school students from the Nutrition and Health Survey in Taiwan [89].
However, in South Korea, the nutritional standards for school lunches were established using only the DRIs for Koreans; reference values for each nutrient were set by multiplying uniformly the recommended daily intake of the DRIs by one-third, which signifies the concept of one out of 3 meals [10]. Therefore, it is necessary to employ a scientific method to set the reference values of nutritional standards for school lunches, considering the actual nutrient intake of the target students. Accordingly, through a policy research project ‘Development of Nutritional Standards for School Lunches (Report No. TR 2018-38),’ the Ministry of Education developed new nutritional standards in 2018 using the latest DRIs at the time (i.e., the 2015 DRIs for Koreans) and the data from the 6th KNHANES (KNHANES VI) [11]. The developed standards were presented as 2 draft standards: A and B. In the 2 standards, the ratio of energy to be provided through school lunches was implemented differently after setting the daily target intake of energy and nutrients [11].
It is necessary to secure the feasibility of application to increase the effectiveness of the nutritional standards for school lunches developed on the basis of scientific evidence. In the United States, the feasibility of application in the menu planning of nutritional standards for school lunches was evaluated as follows: (1) menus from 397 schools across the nation were collected from the SNDA III data, (2) representative menus were selected for each school level (elementary, middle, and high schools), (3) the representative menus were modified with minimal changes to meet the new nutritional standards, and (4) the menus before and after modification were compared [6]. In the UK, pilot school lunches applying the new standards were tested for a week at 15 schools representing various school types after developing the nutritional standards for school lunches. The standard recipes and ingredient lists were submitted by the schools, and reviews on the standards were collected from 24 representative British food service providers in order to evaluate the feasibility of application [12].
South Korea developed the nutritional standards for school lunches in 2004 and conducted a pilot operation of school lunches applying the new standards at 96 schools (32 each of elementary, middle, and high schools) to evaluate the feasibility of application of the standards [13]. After the pilot operation, the school lunch nutrition management checklist and the pilot operation evaluation form were collected from the schools. The nutritional values and the standard food compositions were then analyzed.
After developing the nutritional standards for school lunches, it is very important to evaluate and improve the feasibility of application through a pilot operation. As mentioned above, a previous study developed the draft nutritional standards for school lunches [11]. After developing the standards, the pilot operation was conducted to ensure the feasibility of application of the draft standards [14]. The feasibility of application of the standards can be evaluated from the viewpoints of consumers and suppliers. The results of the pilot operation were divided into 2 parts from the viewpoints of consumers and suppliers. A previous study evaluated the feasibility from the consumer perspective through a survey on students’ and teachers’ satisfaction with the pilot school lunches applying the draft standards [15]. This study aimed to evaluate the feasibility of application of the draft standards from the supplier perspective.
Go to : 
SUBJECTS AND METHODS
This study consisted of 3 parts. First, the pilot operation of school lunches applying the draft standards A and B was conducted at 104 participating schools across the nation. Second, the nutritional values and food cost of school lunches before and during the pilot operation were analyzed using the school lunch operation data collected from the participating schools. Last, an online survey was conducted with school dietitians or nutrition teachers working in the participating schools.
This study was a part of the ‘Feasibility Study on the Application of Revised Nutritional Standards for School Lunches (Report No. 2019 TR-06)’ [14] supported by the Korea Educational Environments Protection Agency. In accordance with Article 2 of the Enforcement Regulations of the Bioethics and Safety Act, approval by the Research Ethics Review Committee was exempted.
Pilot operation
The standards A and B were applied to school lunch sites and piloted for 4 weeks at 104 participating schools. A conference was held in advance for the dietitians or nutrition teachers of the participating schools to ensure a successful pilot operation. The 4-week pilot period was divided into 2 weeks each (first period: Monday, November 5 to Friday, November 16, 2018; second period: Monday, November 19 to Friday, November 30, 2018). The participating schools were divided into 2 groups with 52 schools each: the schools in group 1 applied the standards A in the first period and the standards B in the second period, and the schools in group 2 applied the standards in the reverse order. However, some schools in group 2 inadvertently followed the operation order of group 1; therefore, the pilot operation was eventually conducted with 58 schools in group 1 and 46 schools in group 2. The methods and procedures of the pilot operation have been described in detail in the pilot operation study [14].
Table 1 shows the existing standards used before the pilot operation and the draft standards A and B used for the pilot operation. The standards A and B, which were developed as the draft nutritional standards for school lunches in the previous study [11], were developed in 2 steps: (1) selecting the nutrients to be included in the standards by considering the current nutrient intake of the target students and (2) applying the Target Median Intake method to set the reference values of the selected nutrients. The Target Median Intake method can minimize the proportion of subjects who consume insufficient nutrients [16]. The difference between the 2 draft standards was the ratio of energy to be provided through school lunches. The daily target intake of energy and nutrients was multiplied by 29% (the ratio of energy consumed by the target students for lunch during a day) in the standards A and 1/3 (the concept of one out of 3 meals during a day) in the standards B, respectively [11].
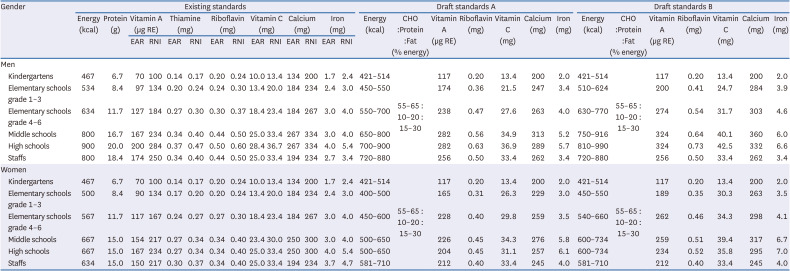
Table 1
Existing nutritional standards and draft standards for school lunches used for pilot operation
Existing nutritional standards for school lunches before the pilot operation:
1. Nutritional standards for school lunches present the reference values per meal. These standards should be used with flexibility considering the individual health, physical activities and variation across regions.
2. School lunches were evaluated through the average daily amount for consecutive 5-day school week every season. Allowance range is as follow:
A. Allowance of energy was up to ±10%. Energy composition ratio of carbohydrates, protein, and fat should be aligned with 55–70%: 7–20%: 15–30%.
B. Provision amounts of protein should be more than reference value. The proportion of protein from total calories should be less than 20%.
C. In the case of vitamin A, B1, B2, and C, calcium, iron, recommended amounts are equal to RNI or more than RNI. Also, mandatory amounts are at least equal to EAR or more than EAR.
Draft nutritional standards A and B for school lunches:
1. The diet should be planned so that the weekly average amount of nutrient supply meets the nutritional standards for school lunches. For energy and energy composition ratio of carbohydrate, protein, and fat, the diet should be planned within the reference ranges. For vitamin A, riboflavin, vitamin C, calcium, and iron, the diet should be planned above the reference values.
2. The nutritional standards for school lunches for each school are set by calculating the weight average of the gender and grade of the students who consume school meals. For the reference range of energy, set the minimum and maximum reference values by calculating the weight average of the minimum reference value and the weight average of the maximum reference value.
RE, retinol equivalent; EAR, estimated average requirement; RNI, recommended nutrient intake.
![]()
Analysis of school lunch operation data
Data collection
The school lunch operation data were collected for 6 weeks (October 22 to November 30, 2018): 2 weeks immediately before the pilot operation, 2 weeks during the first pilot period, and 2 weeks during the second pilot period. The collected data consisted of the following 3 Excel files extracted from the National Education Information System by the school dietitians or nutrition teachers: ‘school lunch ingredients’ origin and nutrition labeling system,’ ‘food cost status,’ and ‘school’s own nutritional standards for school lunches.’ The school’s own nutritional standards were calculated using the standards A and B at each participating school.
The Provincial Office of Education collected the data from the participating schools and submitted them to the Ministry of Education from December 2018 to January 2019. All of the 104 participating schools had completed the data submission. We received the data from the Ministry of Education.
Data analysis
We extracted the daily nutritional value data from the ‘school lunch ingredients’ origin and nutrition labeling system’ file and the daily food cost data from the ‘food cost status’ file. Finally, we analyzed 3,016 days of the nutritional value data and 3,015 days of the food cost data. In addition, 208 of the school’s own nutritional standards (104 each for the standards A and B) were used for analysis.
We analyzed the nutritional values and the food cost of school lunches before and during the pilot operation. The average nutritional values in the first week of each school's pilot operation (during the application of the standards A and B, respectively) were compared with the school’s own nutritional standards to check whether the nutritional values of the pilot school lunches met the reference values of the school’s own nutritional standards. In the case of one school that did not operate school lunches in the first week because of the academic calendar, the average nutritional values in the second week were used for analysis. The average food cost for each school was calculated to verify the significance of the difference in cost for each period: 2 weeks before the pilot operation and 2 weeks under the pilot operation applying the standards A and B, respectively.
Statistical analyses were performed using repeated measures analysis of variance with Bonferroni correction. IBM SPSS Statistics for Windows version 22 (IBM Corp., Armonk, NY, USA) and Microsoft Office Excel 2016 (Microsoft Corporation, Redmond, WA, USA) were used for analysis, and all significance tests were performed at an α-value of 0.05.
Online survey of school dietitians or nutrition teachers
Data collection
After the pilot operation, we conducted 3 surveys through a research company. Two surveys were conducted with students and homeroom teachers, respectively. Another survey was conducted with school dietitians or nutrition teachers. A previous study evaluated the feasibility of application of the draft standards from the consumer perspective through the surveys of students and homeroom teachers [15]. In this study, we analyzed the survey results of the school dietitians or nutrition teachers to evaluate the feasibility of application of the draft standards from the supplier perspective. The survey was conducted online from December 3 to 23, 2018. A total of 102 school dietitians or nutrition teachers responded to the survey.
Survey questionnaire
The questionnaire asked for opinion on the pilot operation in which the standards A and B were applied. The ease of application in terms of nutritional values and food cost for each standard and more appropriate standards among the 2 standards were asked. The general characteristics of the participating schools and the school dietitians or nutrition teachers were also asked.
Data analysis
Chi-square goodness of fit test, χ2 test of independence, and fisher’s exact test were performed to verify the difference in distribution between responses for the standards A and B. After scoring the ease of application for each standard (very difficult = 1, difficult = 2, neither difficult nor easy = 3, easy = 4, very easy = 5 points), the difference in mean scores between the standards A and B was analyzed using the paired t-test. Analyses were performed using IBM SPSS Statistics for Windows version 22 (IBM Corp.) and Microsoft Office Excel 2016 (Microsoft Corporation). All significance tests were performed at an α-value of 0.05.
Go to :
RESULTS
General characteristics of participating schools and school dietitians or nutrition teachers
Table 2 shows the general characteristics of schools and school dietitians or nutrition teachers participating in the pilot operation. The proportion of elementary, middle, and high schools that participated in the pilot operation was approximately 33% each. Most of the school dietitians or nutrition teachers were women (99.0%), and almost half of them were in their 40s (49.0%).
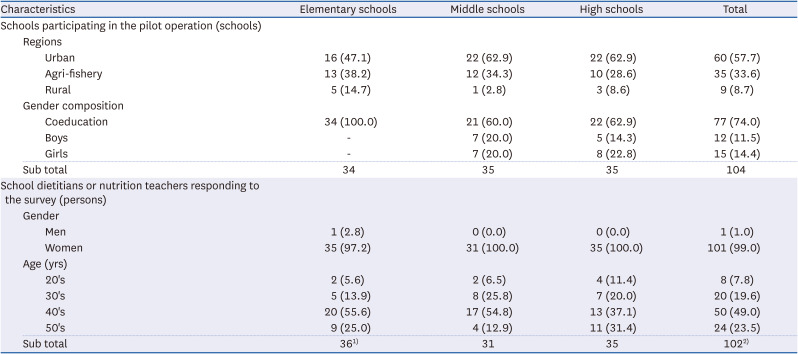
Table 2
General characteristics of schools and school dietitians or nutrition teachers participating in pilot operation
Values are presented as number (%).
1)We used the response data without correction, although there was a response error; there were 34 elementary schools participating in the pilot operation, but 36 dietitians or nutrition teachers answered that they were elementary school dietitians or nutrition teachers.
2)The number of schools that participated in the pilot operation was 104, but only 102 dietitians or nutrition teachers responded to the survey.
![]()
Nutritional values and food cost
Nutritional values of pilot school lunches
Table 3 shows the number of schools of which lunches not having met the reference values of the draft nutritional standards for school lunches during the pilot operation. We compared the average nutritional values of the pilot school lunches with the reference values of the school’s own nutritional standards calculated using the draft standards A and B. The proportions of schools of which lunches met the reference values of energy and all 8 nutrients (carbohydrate as a percentage of energy, protein as a percentage of energy, fat as a percentage of energy, vitamin A, riboflavin, vitamin C, calcium, and iron) were low: 19.2% and 21.2% for the standards A and B, respectively. The proportions of schools of which lunches did not meet the reference values of only one nutrient were 39.4% and 30.8% for the standards A and B, respectively, and in the case of 2 nutrients, the proportions were 20.2% and 26.9% for the standards A and B, respectively.
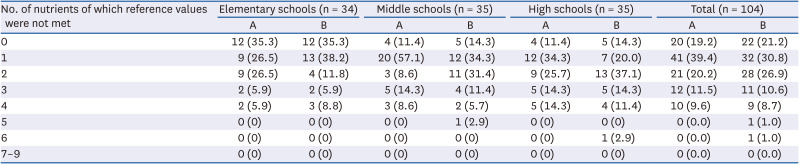
Table 3
Number of schools of which lunches not having met the reference values of the draft nutritional standards for school lunches during pilot operation
![]()
Table 4 shows the number of schools of which lunches not having met the reference values for each nutrient. The proportions of schools of which lunches did not meet the reference values were 38.5% for riboflavin, 32.7% for carbohydrate as a percentage of energy, 21.2% for iron, 20.2% for energy, 20.2% for calcium in the standards A, and 43.3% for carbohydrate as a percentage of energy, 27.9% for calcium, 26.9% for riboflavin, 26.0% for iron, and 14.4% for vitamin C in the standards B. Energy (20.2% for the standards A, 9.6% for the standards B) had a high proportion of schools of which lunches exceeded the reference values, with a higher tendency in the standards A. On the other hand, nutrients with a high proportion of schools of which lunches did not meet the reference values because of the lower values were carbohydrate as a percentage of energy (29.8% for the standards A, 43.3% for the standards B), riboflavin (38.5% for the standards A, 26.9% for the standards B), calcium (20.2% for the standards A, 27.9% for the standards B), and iron (21.2% for the standards A, 26.0% for the standards B).
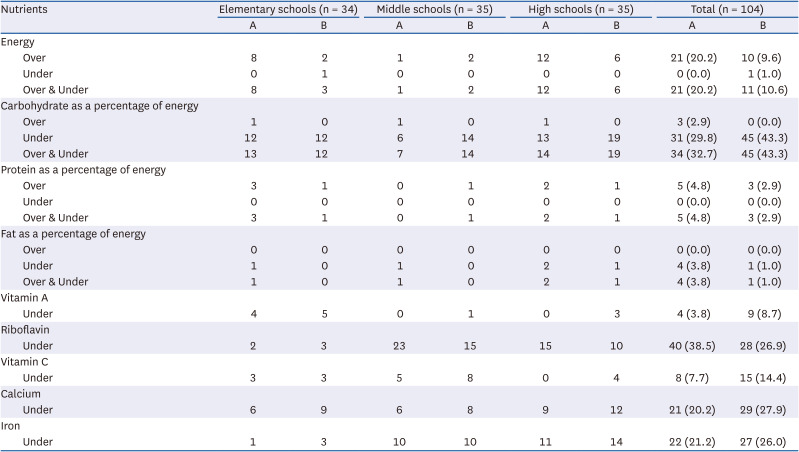
Table 4
Number of schools of which lunches not having met the reference values for each nutrient of the draft nutritional standards for school lunches during pilot operation
![]()
Food cost of pilot school lunches
Table 5 shows the food cost of school lunches according to the applied nutritional standards. The average food cost of school lunches in the application of the existing standards and the draft standards A and B were KRW 2,980, 2,880, and 3,030, respectively. The food cost of school lunches in the application of the standards A was significantly lower than that of school lunches in the application of the existing standards or the standards B.
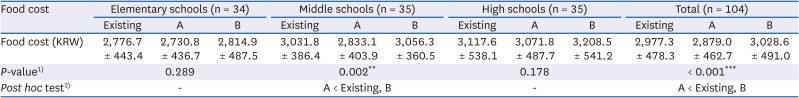
Table 5
Food cost of school lunches according to the applied nutritional standards
Values are presented as mean ± SD.
1)By repeated measures analysis of variance: using the average food cost of school lunches applying each standard (existing standards, draft standards A and B) of each school.
2)The sign of inequality means significant difference between the comparison groups by Bonferroni correction (α = 0.05).
**P < 0.01; ***P < 0.001.
![]()
The food cost of school lunches according to the applied nutritional standards showed a significant difference only in middle schools. The food cost of school lunches in the application of the standards A (KRW 2,830) was significantly lower than that of school lunches in the application of the existing standards (KRW 3,030) or the standards B (KRW 3,060). There was no significant difference in the food cost of school lunches according to the applied standards in elementary and high schools.
Opinion of school dietitians or nutrition teachers on draft nutritional standards
Ease of application of draft nutritional standards for school lunches in terms of nutritional values
Table 6 shows the overall ease of application of the draft standards in terms of the nutritional values through the survey results. The overall ease of application for meeting the reference values of the draft standards was somewhat lower for both standards, but relatively higher for the standards B than for the standards A. About 69% and 43% of the school dietitians or nutrition teachers answered that it was difficult or very difficult to meet the reference values when planning menus by applying the standards A and B, respectively. The mean scores of ease of application were higher for the standards B (2.75) than for the standards A (2.24) (P < 0.001). Therefore, the standards B were determined to be relatively easy standards to apply when planning menus in terms of nutritional values.
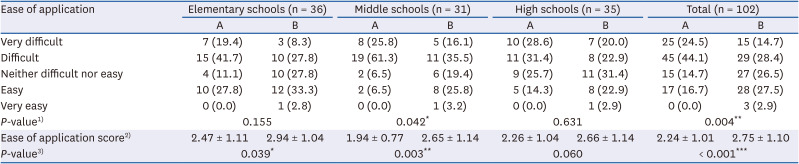
Table 6
Overall ease of application of the draft nutritional standards for school lunches in terms of nutritional values answered by school dietitians or nutrition teachers
Values are presented as number (%) or mean ± SD.
1)By χ2 test of independence or Fisher’s exact test.
2)Very difficult = 1; Difficult = 2; Neither difficult nor easy = 3; Easy = 4; Very easy = 5.
3)By paired t-test.
*P < 0.05; **P < 0.01; ***P < 0.001.
![]()
Table 7 shows the ease of application of the draft standards for each nutrient in terms of nutritional values. The ease of application for meeting the reference values for each nutrient was investigated only by the school dietitians or nutrition teachers reporting difficulty (difficult or very difficult) in meeting the reference values when planning menus by applying the draft standards (70 respondents for the standards A, 44 respondents for the standards B). The main reasons for the difficulty in meeting the reference values of the standards A were the low reference ranges of energy (84.3%) and protein as a percentage of energy (64.3%), and the high reference value of calcium (62.9%). In the case of the standards B, difficulty in meeting the reference values resulted from the high reference values of calcium (84.1%), riboflavin (70.5%), and iron (68.2%).
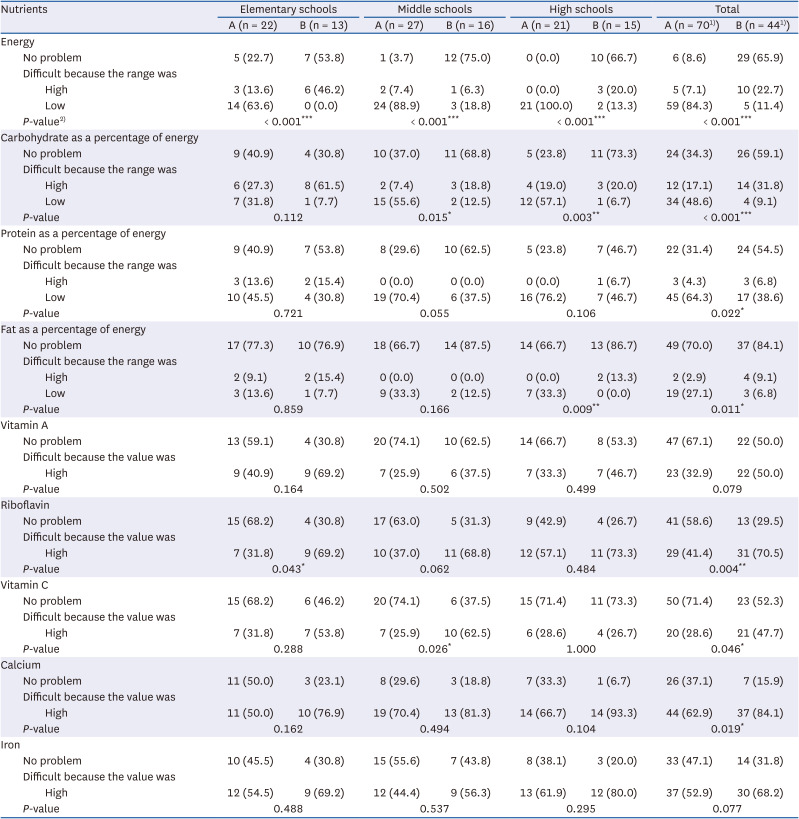
Table 7
Ease of application of the draft nutritional standards for school lunches for each nutrient in terms of nutritional values answered by school dietitians or nutrition teachers
Values are presented as number (%).
1)School dietitians or nutrition teachers who answered that it was difficult or very difficult to meet the overall reference values when planning menus by applying the draft standards (70 respondents for the standards A, 44 respondents for the standards B).
2)By χ2 test of independence or Fisher’s exact test.
*P < 0.05; **P < 0.01; ***P < 0.001.
![]()
The ease of application of the draft standards tended to decrease as the school level increased in some nutrients. School dietitians or nutrition teachers answered that it was difficult to meet the reference values of the standards A because of the low reference range of energy (63.6% for elementary schools, 88.9% for middle schools, 100% for high schools) and protein as a percentage of energy (45.5% for elementary schools, 70.4% for middle schools, 76.2% for high schools). In the case of standards B, the respondents answered that it was difficult to meet the reference values because of the high reference values of calcium (76.9% for elementary schools, 81.3% for middle schools, 93.3% for high schools) and riboflavin (69.2% for elementary schools, 68.8% for middle schools, 73.3% for high schools).
Ease of application of draft nutritional standards for school lunches in terms of food cost
Table 8 shows the ease of application of the draft standards in terms of food cost. The ease of application in terms of food cost was high in both standards. The proportions of school dietitians or nutrition teachers reporting no problem in meeting a existing food cost standard were 72.5% for the standards A and 61.8% for the standards B when planning menus by applying the standards A and B, respectively.
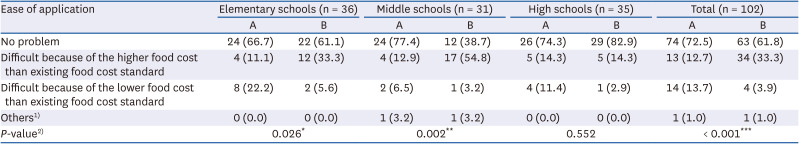
Table 8
Ease of application of the draft nutritional standards for school lunches in terms of food cost answered by school dietitians or nutrition teachers
Values are presented as number (%).
1)Including respondents who answered that they met the existing food cost standard without meeting the reference values of riboflavin and iron.
2)By χ2 test of independence or Fisher’s exact test.
*P < 0.05; **P < 0.01; ***P < 0.001.
![]()
Overall appropriateness of application of draft nutritional standards
Table 9 shows the overall appropriateness of the application of the nutritional standards for school lunches. The proportion of the respondents who chose the standards B (58.8%) as the more appropriate standards was more than 4 times higher than that of the standards A (13.7%). The differences in the proportion tended to increase as the school level increased: 25% for elementary schools, 42% for middle schools, and 68% for high schools.

Table 9
Appropriateness of application of the draft nutritional standards for school lunches answered by school dietitians or nutrition teachers
Values are presented as number (%).
1)Including answers that there was no difference between the standards A and B, another opinion, and no opinion.
2)By χ2 goodness of fit test.
*P < 0.05; ***P < 0.001.
![]()
Go to :
DISCUSSION
In this study, the feasibility of application of the draft nutritional standards for school lunches was evaluated from the supplier perspective. The pilot operation was conducted at 104 participating schools across the nation by applying the draft standards A and B. The ease and appropriateness of application of the draft standards were evaluated using the school lunch operation data and the survey results.
Considering the ease of application in terms of nutritional values, the proportions of schools of which lunches met the reference values of the school’s own nutritional standards for energy and 8 nutrients were low (19.2% for the standards A, 21.2% for the standards B). This could be attributed to the fact that the school dietitians or nutrition teachers were not accustomed to planning menus by applying the draft standards at the time of the pilot operation. Therefore, research on the development of menus and recipes meeting the reference values of new standards is necessary to ensure the feasibility of application of the new standards in school lunch sites.
In the United States and Canada, sample menus for school nutritional standards would be essential because dietitians or nutrition teachers are not staffed in schools. In the United States, the sample menus for breakfast and lunch meeting the reference values of the standards were provided for each school level in consideration of students’ preference and food cost after developing the new school nutritional standards [6]. In Canada, sample menu handbooks for breakfast and lunch were provided for the application of school nutritional standards, and detailed recipes for each menu were provided for each age group (4−8, 9−13, 14−18 yrs) [17]. Korean schools are staffed with dietitians or nutrition teachers unlike such countries. Nevertheless, the development of sample menus and recipes would be a great help in applying new nutritional standards for school lunches.
This study showed that the proportion of schools of which lunches had higher nutritional values than the reference values of the draft standards was high in energy and protein as a percentage of energy. This may be because the school dietitians or nutrition teachers considered the students’ preference for high protein and high energy foods when planning menus [418]. However, school dietitians or nutrition teachers should plan their menus to meet the reference ranges rather than focusing on the students’ preferences. The reference ranges of energy and macronutrients as percentages of energy of the nutritional standards for school lunches were established based on the 2015 DRIs for Koreans. The DRIs presented the estimated energy requirements and the acceptable macronutrient distribution range for adequate intake of energy and macronutrients among Koreans [19]. Obesity caused by excessive energy intake is a major health problem that increases the risk of chronic diseases such as cancer, cardiovascular disease, and diabetes [202122]. In addition, it has been reported that the composition of macronutrients as percentages of energy is related to health [2223].
On the other hand, nutrients with a high proportion of schools of which lunches had lower nutritional values than the reference values were riboflavin, calcium, and iron. In a study analyzing the nutritional values provided by school lunches in Korea [24], the nutritional values of riboflavin, calcium, and iron did not meet one-third of the recommended daily intake of DRIs in some target student groups. Korea Health Statistics 2018 [25] reported that the ratios of actual intake to recommended daily intake were 148.8% and 133.6% for riboflavin, 65.6% and 63.7% for calcium, and 91.4% and 79.8% for iron in the 6−11 and 12−18 years age groups, respectively. These results showed that the nutritional values from school lunches as well as the actual intake of the target students might have been insufficient, especially in calcium and iron. Therefore, school lunches should provide sufficient riboflavin, calcium, and iron.
This study showed that the standards B were more applicable than the standards A. The mean score for the ease of application was higher for the standards B (2.75) than for the standards A (2.24). A previous study [18] reported that school dietitians or nutrition teachers in the Chungbuk region considered energy and protein the most important when planning menus. The nutritional values exceeded the reference values of the nutritional standards in protein (41.9%), energy (36.2%), calcium (9.8%), and vitamins (7.9%) [18]. The standards B might have been easier to apply because the reference ranges of energy and protein as a percentage of energy were higher than those of the standards A.
The school dietitians or nutrition teachers reporting difficulty in meeting the reference values of the draft standards answered reasons for the difficulty as follows: the low reference ranges of energy (84.3%) and protein as a percentage of energy (64.3%) for the standards A, and the high reference values of calcium (84.1%), riboflavin (70.5%), and iron (68.2%) for the standards B. It has been reported that energy and macronutrients such as protein and fats tend to exceed the reference ranges when planning school lunch menus, while micronutrients such as calcium, iron, and vitamins tend to be excessive or insufficient depending on food selection [1826]. The school dietitians or nutrition teachers might have felt difficulty in meeting the reference ranges of energy and protein as a percentage of energy because they have low reference ranges in the standards A. On the other hand, the respondents might have felt difficulty in meeting the reference values of calcium, riboflavin, and iron because the reference values of vitamins and minerals were set relatively higher in the standards B than in the standards A.
In this study, it was difficult to meet the reference values because of the lower reference ranges of energy and protein as a percentage of energy for the standards A and the higher reference values of calcium and riboflavin for the standards B as the school level increased. According to a previous study [4], it becomes more difficult to plan menus meeting the reference values of nutritional standards as the school level increases from elementary to middle to high schools. In particular, it is difficult to meet the reference value of calcium as the school level increases [418]. The proportions of students who consumed milk in Korean schools were 72.5% for elementary schools, 33.9% for middle schools, and 21.3% for high schools in 2019 [27]. This might have been the reason for the difficulty in meeting the reference values of calcium and riboflavin only with school lunches as the school level increased, considering that milk and dairy products are good sources of calcium and riboflavin [21].
Considering the ease of application in terms of food cost, there was no significant difference in the food cost of school lunches applying the existing standards and standards B. The average food cost of school lunches applying the standards A (KRW 2,880) was lower than that of school lunches applying the existing standards (KRW 2,980) or the standards B (KRW 3,030). The food cost of school lunches applying the standards A was considered relatively low because the reference values of the standards A were set lower than those of the existing standards or the standards B. Therefore, there would be no food cost issue when planning menus by applying the standards B.
In addition, 72.5% and 61.8% of school dietitians or nutrition teachers reported no problem in meeting the existing food cost standard when planning menus by applying the standards A and B, respectively. Food cost is known to be an important factor for most school dietitians or nutrition teachers in menu planning. According to a study on nutrition management for school lunch programs in Seoul and Incheon provinces [28], food cost is the third highest priority among the 6 factors considered by school dietitians or nutrition teachers. Furthermore, school dietitians or nutrition teachers in the Chungbuk region considered food cost the most important and difficult factor [18]. In this study, the ease of application in terms of food cost was found to be high in both standards A and B. Therefore, both standards were judged appropriate for field application.
The overall appropriateness of application of the draft standards was found to be higher for the standards B than for the standards A. Almost two-thirds (58.8%) of the school dietitians or nutrition teachers answered that the standards B were more appropriate standards. This is considered to be because the ease of application in terms of nutritional values was higher for the standards B than for the standards A, and both standards showed high ease of application in terms of food cost.
In conclusion, the feasibility of application of the draft nutritional standards for school lunches evaluated from the supplier perspective was higher for the standards B than for the standards A. The standards B showed higher ease of application than the standards A in terms of nutritional values, and both standards A and B showed high ease of application in terms of food cost. The overall appropriateness of application was higher for the standards B than for the standards A.
Our attempt in this study was to prepare the basis for new nutritional standards for school lunches, which were about to be revised at the time. However, the nutritional standards for school lunches in South Korea, revised in 2021, were set using the existing method of uniformly multiplying the recommended nutrient intake of the 2015 DRIs for Koreans by 1/3 for each nutrient. Since the existing method is based only on the DRIs, it has a limitation of reflecting the actual nutrient intake of the target students insufficiently. In the future, it is necessary to revise the nutritional standards for school lunches by applying a scientific method that can reflect the actual nutrient intake of the target students, not based only on DRIs.
In this study, sodium and sugar were not included in the draft nutritional standards because the exact recipes for the amount of sodium or sugar added during cooking school lunches have not been established. In the future, sodium and sugar should be considered to be included in the nutritional standards for school lunches.
This study is significant since it tried to verify the feasibility of application of the draft nutritional standards for school lunches through a systematic pilot operation. In the future, the results of this study can be used as valuable information to evaluate and improve the feasibility of application of the nutritional standards for school lunches in South Korea as well as other countries.
Go to :
 XML Download