

 PDF
PDF Citation
 Print
Print


INTRODUCTION
Helicobacter pylori (H. pylori) infection is a major risk factor for gastric cancer (GC) and has a worldwide prevalence of over 50% [12]. A large-scale study conducted in Korea, reported a seroprevalence rate of 43.9% in 2018 [3]. According to meta-analyses, the odds ratio (OR) for GC was 1.9 [4], or twice [5] as high in H. pylori-infected individuals than uninfected subjects. H. pylori infection is associated with chronic inflammation and oxidative stress, resulting in DNA damage, tissue injury, and eventually neoplastic transformation [1].
However, although H. pylori infection may increase the risk of developing GC [6], and less than 5% of infected patients develop GC. Several environmental factors are involved in the progression of GC due to H. pylori infection, with diet being a significant factor [7]. A systematic review conducted by Zaidi et al. [8] reported that dietary factors that modulate H. pylori-associated gastric carcinogenesis, such as salt, cured, pickled, and smoked foods, increased GC risk, whereas fresh fruits, vegetables, turmeric, garlic, and curcumin reduced GC risk. Montani et al. [9], reported that traditional Japanese foods such as cod rods and miso soup might play a role in the progression of atrophic gastritis after H. pylori infection. Atrophic gastritis is characterized by the loss of parietal cells and chief cells, and is known as the main precursor lesion of GC [10]. This finding can be explained by the high levels of salt present in traditional Japanese foods, which may increase the impact of H. pylori infection on the risk of GC [11]. The relationship between potentially harmful foods such as salty food and H. pylori infection has been evaluated in previous studies [111213]. However, studies on the role of protective dietary factors in H. pylori-infected individuals are scarce.
Some studies have reported that fresh fruits [14], vegetables [15], soy products [16], and dairy products [17] act as protective dietary foods that prevent GC. However, the World Cancer Research Fund International [7] has refuted any such association due to the lack of substantial evidence. Despite the limited supporting evidence, low fruit intake has been suggested as a factor that might increase GC risk. A literature search of potential dietary factors was conducted using recently published meta-analyses [14151718]. Dietary foods such as soy products, fruits, vegetables, and dairy products were selected to determine the association of individual and combined intake of foods with the incidence of GC. As each individual type of food has a different set of protective nutrients or phytochemicals, it is important to evaluate the effect of a combination of these individual food groups. Keenan et al. [19] reported that anti-H. pylori activity was higher in combined foods than in single foods. However, the effect of individual or a combination of protective food groups on the incidence of GC in H. pylori-infected individuals is yet to be investigated. Increasing the intake of healthy or protective foods and reducing the intake of unhealthy foods may help inhibit H. pylori-associated gastric carcinogenesis [8]. Therefore, proper diet management in H. pylori-infected individuals is essential to prevent the development of GC.
This study was conducted to investigate the effect of individual or a combination of protective foods on the incidence of GC in H. pylori-infected subjects through a case-control study in Korea.
MATERIALS AND METHODS
Study population
Participants were selected from 2 hospitals (Hanyang University Guri Hospital and Chungnam University Hospital) between December 2002 and September 2006. Due to minor changes in the questionnaire during the study period, participants were classified into the following stages: first (March 2002 to August 2003) and second (October 2003 to September 2006). The inclusion criteria were participants aged 20–79 years. Cases and controls were selected according to the following criteria:1) patients diagnosed following gastroscopy that was performed by a gastroenterologist; the final diagnosis of GC was confirmed by a pathologist through a biopsy. 2) Controls visited the same hospital during the same period and did not have any pathology detected by gastroscopy. A total of 134 patients and 212 controls were H. pylori-positive infection. Participants with a daily energy intake of < 500 kcal (3 cases) or > 5,000 kcal (3 cases and 4 controls) were excluded. Cases and controls were matched in a 1:1 ratio considering the following variables: sex, hospital visit, age (± 5 years), and study admission period within 1 year. An additional 46 cases and 126 controls were excluded because they could not be matched according to the 1:1 matching criteria. A total of 82 pairs (22 pairs from Chungnam University Hospital; 60 from Hanyang University Guri Hospital) of participants were evaluated. All patients and controls voluntarily provided informed consent, and the study protocol was approved by the Institutional Review Board of Hanyang University Medical Center (IRB No. 2003-4).
Data collection
The questionnaire included questions on socio-demographic characteristics (sex, age, education level, and hospital visit), anthropometric factors (height and weight), behavioral factors (smoking status and alcohol consumption), H. pylori infection status, family history of GC, and dietary habits. The participants were grouped into 3 categories based on body mass index (BMI) according to the Asia-Pacific classification [20]: underweight and normal weight, ≤ 22.99 kg/m2; overweight, 23.0–24.99 kg/m2; and obese, ≥ 25 kg/m2.
H. pylori infection testing
H. pylori infection was detected using the Campylobacter-like organism test kit (Product No. 60480; Kimberly-Clark/Ballard Medical Products, Draper, UT, USA), which is a rapid urea degradation test. This test was performed only on participants for whom tissue collection was possible.
Dietary data
Data on dietary factors were collected using a quantitative food frequency questionnaire (FFQ). A detailed description of the dietary data collection in this study has been previously published [21]. Both the first and second stages utilized the FFQs, and the participants recalled their diet for 12 months prior to 3 years. However, the FFQs used in the first and second stages included slightly different survey items and methods. In the first stage, the FFQ assessed 102 food or dish items, the frequency of food consumption per month, week, or day, and the population standard portion size. The FFQ used in the second stage, comprised 115 food or dish items. Frequency of food consumption was divided into 9 categories (never or less than once a month, 1–3 times a month, 1 time a week, 2–4 times a week, 5–6 times a week, once a day, 2–3 times a day, 4–5 times a day, and ≥ 6 times a day), and the population standard portion size. The intake of a population standard portion size of each food item was investigated in an open-ended manner using a general unit for each food or dish (e.g., a bowl, a plate, or a piece). Therefore, the common food items in the second stage were determined based on the first stage. Subsequently, food and nutrient intake was calculated for each stage and merged. This was converted into daily intake by considering the intake period and frequency, and the standard portion size of each investigated food item. All the questionnaires were evaluated by well-trained interviewers and participants were asked to recall their usual dietary intake 3 years prior to the interview in order to assess past dietary intake. The reason for setting the reference period of their dietary habits 3 years before the date of interview, was that the participant may have changed their dietary habits due to poor health status prior to GC diagnosis. A modified version of the validated FFQ was used in our previous study [22]. Total energy intake was calculated using the Korean Foods and Nutrients Database [23]. This study included soy products, fruits, vegetables, and dairy products as dietary factors based on recently published meta-analyses [14151718]. Protective food groups were classified and analyzed as follows. First, soy products were part of 3 foods: 1. Soybeans, boiled in soy sauce, 2. Tofu, 3. Soymilk. Second, the fruit group comprised 12 fruits: 1. Mandarin, 2. Orange and grapefruit, 3. Watermelon, 4. Oriental melon, 5. Strawberry, 6. Grape, 7. Apple, 8. Pear, 9. Persimmon, 10. Banana, 11. Peach, and 12. Tomato. Third, vegetables included 11 foods: 1. Lettuce, cabbage, and Chinese cabbage, 2. Cucumber, 3. Chili pepper, 4. Carrot, 5. Perilla, 6. Celery and broccoli, 7. Vegetable juice, 8. Cooked soybean sprouts and mung bean sprouts, 9. Spinach, 10. Korean zucchini, and 11. Bracken and platycodon. Fourth, dairy products included 3 foods: 1. Milk, 2. Fermented milk products (yogurt) 3. Cheese. The daily intake of each item was calculated by multiplying the frequency per day and the intake amount, and then summing them to estimate the total daily intake of food groups.
Statistical analysis
All statistical analyses were conducted using the SAS 9.4 version (SAS Institute Inc., Cary, NC, USA). To compare the general characteristics of cases and controls, continuous (age, total energy intake) and categorical variables (sex, BMI, education level, etc.) were analyzed using Student’s t-test and χ2 test, respectively, and were presented as mean values ± SD and frequencies (percentages), respectively. The tertiles of each food group were applied according to the distribution of food intake among controls. The OR and 95% confidence interval (CI) for the GC were calculated across the tertiles for each food group using unconditional logistic regression after adjusting for known risk factors. Additionally, conditional logistic regression was used for the matching analysis to check whether the results were similar to those of the unconditional logistic regression. The lowest tertile for each food group was used as the reference. To test for trends, the median value of each tertile category of the food groups on the intake of controls were used as continuous variables. Model I was adjusted for age (continuous), sex, BMI (≤ 22.99, 23.0–24.99, ≥ 25, or missing), education level (≤ middle school, ≥ high school, or missing), family history (first-degree relatives) of GC (yes or no), smoking status (never, past, or current smoker), alcohol consumption (never, past, < 20 g/day for women or < 40 g/day for men, or ≥ 20 g/day for women or ≥ 40 g/day for men), hospitals (Chungnam University Hospital or Hanyang University Guri Hospital), and total energy intake (continuous variable). Model II was further adjusted for the log intake of the other food groups. In addition, the combination of each food group was analyzed according to the median value of each food group, based on the controls. In each food group, those above the median value were classified as high intake, and those below the median value were classified as low intake. The combined score for each food group was calculated as follows: in each food group, 1 point was given for intake above the median value, 0 points were given for intake below the median value, and the sum of the scores was calculated. Thus, higher protective food scores (ranging from 0 to 4) indicated more protective food intake.
RESULTS
General characteristics of cases and controls
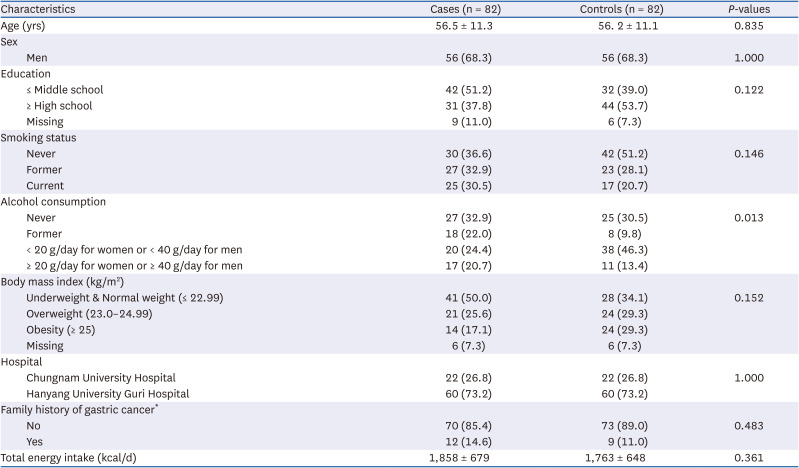
The general characteristics of the 82 H. pylori-infected GC patients and 82 controls have been listed in Table 1. The mean age of the cases and controls was 56.5 ± 11.3 years and 56.2 ± 11.1 years, respectively. The case group had significantly more former drinkers (22.0%) than the control group (9.8%), and the case group had significantly more current drinkers (≥ 20 g/day for women or ≥ 40 g/day for men) (20.7%) than the control group (13.4%) (P = 0.013).
Table 1
Participant characteristics of H. pylori-infected cases and controls
Association between the general risk factors for GC
The OR of the general risk factors for GC incidence after adjusting for confounding factors has been listed in Table 2. Education level, smoking status, alcohol consumption, BMI, and family history of GC were not significantly associated with the incidence of GC based on the fully adjusted models.
Table 2
ORs of gastric cancer in relation to general characteristics
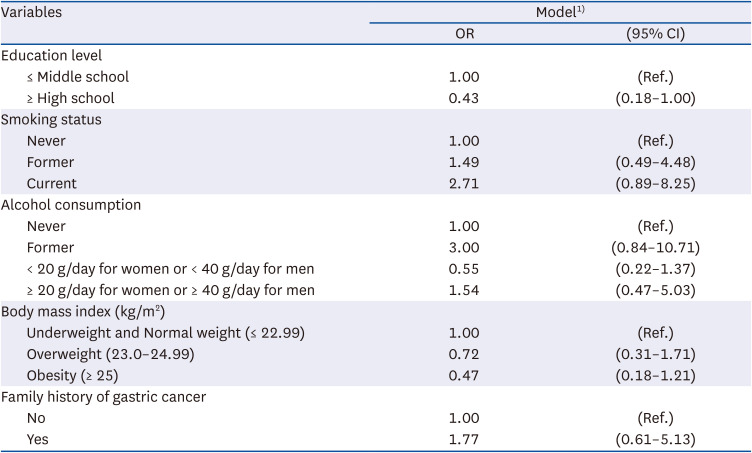
OR, odds ratios; CI, confidence interval.
1)Adjusted for age, sex, body mass index (≤ 22.99, 23.0–24.99, or ≥ 25), education level (≤ middle school, ≥ high school, or missing), family history of gastric cancer (no or yes), smoking status (never, past, or current smokers), alcohol consumption (never, past, < 20 g/day for women or < 40 g/day for men, or ≥ 20 g/day for women or ≥ 40 g/day for men), hospital (Chungnam University Hospital or Hanyang University Guri Hospital), and total energy intake (continuous).
Association between the protective food intake and GC risk
The association between the daily intake of protective foods and the incidence of GC has been highlighted in Table 3. In Model II, the fully adjusted model, the highest tertile of soy product intake showed a lower incidence of GC than the lowest tertile (OR = 0.37, 95% CI = 0.14–0.96, P for trend = 0.131). Also, the highest tertile of fruit intake showed a lower incidence of GC than the lowest tertile (OR = 0.35, 95% CI = 0.13–0.94, P for trend = 0.080). Daily intake of vegetables and dairy products was not significantly associated with the incidence of GC.
Table 3
ORs of gastric cancer by the potentially protective foods intakes
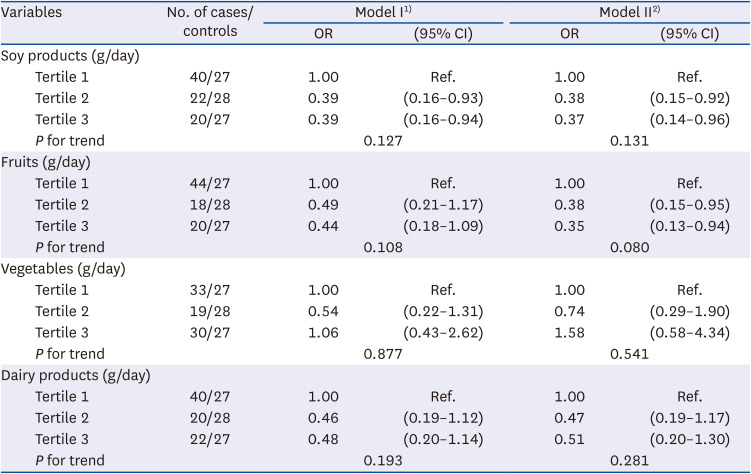
OR, odds ratios; CI, confidence interval.
1)Model I: adjusted for age, sex body mass index (≤ 22.99, 23.0–24.99, ≥ 25, or missing), education level (≤ middle school, ≥ high school, or missing), family history of gastric cancer (no or yes), smoking status (never, past, or current smokers), alcohol consumption (never, past, < 20 g/day for women or < 40 g/day for men, or ≥ 20 g/day for women or ≥ 40 g/day for men), hospital (Chungnam University Hospital or Hanyang University Guri Hospital), and total energy intake (continuous).
2)Model II: model I + further adjusted for log intakes of each other food groups.
Association between the combination of protective foods intake and GC risk
The association between the intake of a combination of protective foods and the incidence of GC has been highlighted in Table 4. In the fully adjusted model, subjects with a high intake of both soy products and fruits showed a significantly lower incidence of GC than participants with a low intake of both soy products and fruits (OR = 0.20, 95% CI = 0.06–0.67). Moreover, subjects with a high intake of both soy products and dairy products had a significantly lower incidence of GC than those with a low intake of both soy products and dairy products (OR = 0.28, 95% CI = 0.10–0.78). In addition, subjects with a high intake of both fruits and dairy products had a significantly lower incidence of GC than those with a low intake of both soy products and dairy products (OR = 0.28, 95% CI = 0.09–0.83). No significant difference on GC risk was found using the combination of soy products and vegetables, fruits and vegetables, or vegetables and dairy products.
Table 4
ORs of gastric cancer by the combination of potentially protective food groups
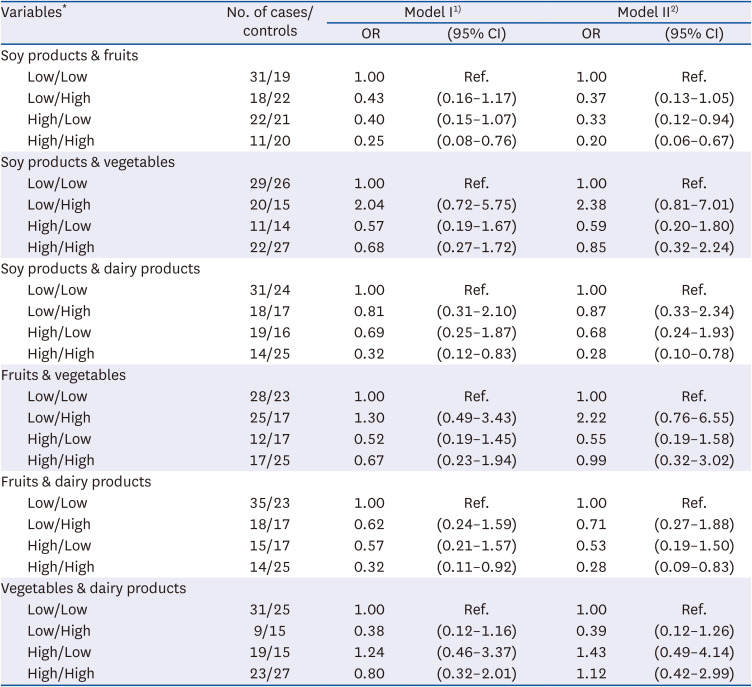
OR, odds ratios; CI, confidence interval.
1)Model I: adjusted for age, sex body mass index (≤ 22.99, 23.0–24.99, ≥ 25, or missing), education level (≤ middle school, ≥ high school, or missing), family history of gastric cancer (no or yes), smoking status (never, past, or current smokers), alcohol consumption (never, past, < 20 g/day for women or < 40 g/day for men, or ≥ 20 g/day for women or ≥ 40 g/day for men), hospital (Chungnam University Hospital or Hanyang University Guri Hospital), and total energy intake (continuous).
2)Model II: model I + further adjusted for log intakes of each other food groups.
*In each food group, those above the median value were classified as high intake, while those below the median value were classified as low intake.
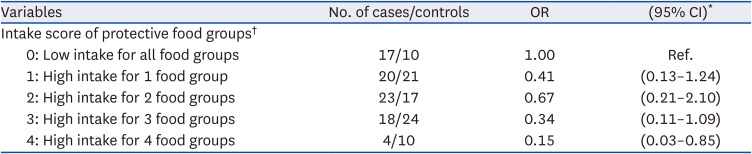
Association between the intake score of protective food groups and GC risk
The association between the intake scores of the protective food groups and the incidence of GC has been highlighted in Table 5. In the fully adjusted model, subjects with the highest score (score = 4, high intake of 4 protective foods) showed a significantly lower incidence of GC than subjects with the lowest score (score = 0, low intake of all food groups) (OR = 0.15, 95% CI = 0.03–0.85). There was no significant difference in participants with a score of 1–3.
Table 5
ORs of gastric cancer by the intake score of potentially protective food groups
OR, odds ratios; CI, confidence interval.
*Adjusted for age, sex body mass index (≤ 22.99, 23.0–24.99, ≥ 25, or missing), education level (≤ middle school, ≥ high school, or missing), family history of gastric cancer (no or yes), smoking status (never, past, or current smokers), alcohol consumption (never, past, < 20 g/day for women or < 40 g/day for men, or ≥ 20 g/day for women or ≥ 40 g/day for men), hospital (Chungnam University Hospital or Hanyang University Guri Hospital), and total energy intake (continuous).
†In each food group of soy products, fruits, vegetables, and dairy products, 1 point was given for intakes of above the median value, and 0 point was given for intakes of below the median value, and the sum of each food group was calculated.
DISCUSSION
This study demonstrated that a high intake of soy products or fruits is associated with a lower risk of GC. On combining food groups, the risk of GC was significantly reduced with a high intake of a combination of either soy products and fruits, soy products and dairy products, or fruits and dairy products.
The biological mechanism of gastric carcinogenesis secondary to H. pylori infection may be explained as follows: 1) H. pylori infection induces precancerous gastric lesions, such as atrophic gastritis and intestinal metaplasia. These changes can lead to intestinal-type of GC. 2) H. pylori infection causes chronic inflammation. Pro-inflammatory cytokines present in gastric mucosal epithelial cells stimulate the activation of inflammatory cells (e.g., neutrophils and macrophages), which secrete inflammatory mediators, such as reactive oxygen and nitrogen species [24]. This results in DNA damage, tissue injury, and eventually, neoplastic transformation.
A recent review reported that specific dietary factors might prevent or trigger gastric inflammation and carcinogenesis in the presence of H. pylori infection [8]. It was suggested that increasing the intake of healthy protective foods (e.g., fruits, probiotics, or turmeric) and reducing the intake of unhealthy foods (e.g., salt, smoked food, preserved food, or pickles) may help inhibit H. pylori-associated gastric pathologies in H. pylori-infected subjects.
Soy products are rich in cancer-preventive phytochemicals, such as isoflavones (e.g., genistein, daidzein, and glycitein) [25]. Wang et al. [26] reported that low intake of soy products in H. pylori-infected subjects significantly increased the incidence of GC. In addition, Lu et al. [18] reviewed 22 prospective epidemiological studies in a meta-analysis and reported an association between soy consumption and gastrointestinal (GI) cancer risk. They found that soy product consumption significantly reduced the incidence of GC (OR = 0.85, 95% CI = 0.72–0.99) [18]. This could be attributed to the isoflavones that are abundant in soy products. In particular, genistein inhibits the growth of H. pylori and the activity of nuclear factor (NF)-κB, which is associated with tumorigenesis in the GI tract [27]. It also reduces the growth and proliferation of GC cells by inhibiting cancer stem cell-like properties and reduces the chemoresistance of GC [28].
However, there is inconsistent results. Another meta-analysis involving 22 case-control studies and 18 cohort studies reported that the effect of soy consumption on the reduction of GI cancer risk was minimal and unrelated to GC [29]. The inconsistency in results may be due to differences in the type of soy products (fermented or not), sex, and genetic background [162930]. In particular, the intake of fermented soy products is often inconsistent with GC due to their high salt content, while non-fermented soy products have the predominant result of lowering GC risk [31]. The soy products included in the present study were soybeans (boiled in soy sauce), tofu, and soymilk. Although soy sauce-based soybeans were included, the intake of soy sauce was very low; thus, the main intake of soy products was non-fermented soy products. Therefore, the findings of this study were similar to those for non-fermented soy products and showed a marginally lower incidence of GC.
Fruits and vegetables are well-known protective foods that can reduce the incidence of GC [32]. As fruits and vegetables are rich in various minerals, vitamins, dietary fiber, and phytochemicals, they have antioxidant and anti-inflammatory functions [33]. A case-control study in Korea reported that H. pylori seropositivity was a significant risk factor for GC in subjects with low vitamin C intake but not in subjects with high vitamin C intake [34]. It was suggested that vitamin C might inhibit the carcinogenic effect of H. pylori infection. A review reported that fruits and vegetables, including antioxidant nutrients, protect the gastric mucosa from inflammation caused by H. pylori infection and reduce the production of carcinogens by acting as nitrite scavengers [24]. In particular, some studies reported that the concentration of antioxidant nutrients (e.g., vitamin C, vitamin E, beta-carotene, etc.) in plasma is low in H. pylori-infected subjects [3536]; thus, nutritional management and education, to ensure adequate antioxidant nutrient intake in H. pylori-infected subjects, could help prevent GC. In the present study, an increase in the daily fruit intake was associated with a decrease in GC incidence; however, when citrus fruits were analyzed separately, the association with the incidence of GC was not significant (data not shown).
Vegetables are a major source of nitrate and antioxidant nutrients [37]. In our previous study, it was found that the consumption of high-nitrate-containing vegetables increased the incidence of GC [22]. However, nitrate is not carcinogenic; it is converted to nitrite in the stomach and reacts with amino substrates in food to form N-nitroso compounds, which are carcinogenic [38]. In addition, a pooled analysis of prospective studies by Wang et al. [14] reported no association between total vegetable intake and GC, which might be due to a threshold effect that does not increase the protective effect in a stepwise manner as vegetable intake increases. However, in a meta-analysis of Korean and Japanese populations, it was stated that fresh vegetable consumption significantly lowered the incidence of GC [15]. Therefore, the effect of vegetables on the incidence of GC may differ depending on the intake of vegetables and the type of vegetables consumed (fresh or cooked, high nitrate-containing vegetables). Further research is required to classify vegetables as fresh or high-nitrate-containing vegetables in a larger number of H. pylori-infected subjects.
Dairy products are an important source of minerals, such as calcium, potassium, and magnesium, and vitamins, such as riboflavin and vitamin B12 [39]. A meta-analysis of epidemiological studies by Guo et al. [17] reported that increased consumption of total dairy food was associated with a reduced risk of GC (relative risk = 0.76, 95% CI = 0.64–0.91) in cohort studies; however, no association was found in in case-control studies. Regarding the reason for the difference in the study design, the case-control study was investigated using a dietary questionnaire approximately 1–2 years prior to cancer diagnosis, whereas the cohort study investigated a dietary questionnaire approximately 10–20 years prior to cancer diagnosis. They suggested that cohort studies would be more relevant because cancer develops over a long latency period. In contrast, another recent meta-analysis reported a positive association between dairy products and GC [40]. They proposed that this positive association exists because it is possible to consume more dairy products to alleviate symptoms such as indigestion.
In the present study, when dairy products were consumed alone, no significant association were found between dairy product consumption and GC incidence. However, when combined with other products (soy products or fruits), the incidence of GC was significantly reduced. Dairy products, as potential sources of probiotics, have been reported to damage H. pylori strains and inhibit H. pylori colonization in in vivo model [41]. In addition, an in vitro model reported that, the dairy matrix improves antioxidant activity by protecting the integrity of polyphenols as a result of the combined effect of probiotics and polyphenols [42]. Since each food group has different nutrients or phytochemicals, when consuming individual food groups, such as vegetables and dairy products, the effect on GC development may not be statistically significant, but consumption of a combination of food groups might exhibit a synergistic effect. Keenan et al. [19] reported that anti-H. pylori activity was higher in the combined food group than in the single food group. A clinical trial showed that a combination of fermented milk, containing probiotics (Lactobacillus paracasei) and plant extracts (Glycyrrhiza glabra) reduced H. pylori density, and improved histological inflammation in subjects with H. pylori infection [43]. Such a combined effect between foods or food ingredients has been reported in a combination of various probiotics [44] or an antibacterial agent and vitamins [45]; however, studies conducted with combinations of food groups similar to those in the present study are scarce. A study similar to the current study, presented a combination score between foods, and reported that the incidence of GC increased as the intake score of unhealthy foods (i.e., high intake of salted-smoked foods/cereals and low intake of citrus fruits/raw green vegetables) increased [46]. In our study, we found that the incidence of GC significantly reduced when the intake of protective food groups increased. The interaction between nutrients or phytochemicals in various food groups might have a synergistic effect in reducing the incidence of GC. However, such a mechanistic identification requires further confirmation through experimental studies.
This study has several strengths. In the present study, only those infected with H. pylori (an important risk factor for GC) were matched in a 1:1 ratio and analyzed. Additionally, the association with GC was confirmed by testing various combinations of foods that have not been reported in other studies. To minimize information bias, interviews with all subjects were conducted without disclosing the disease status after the endoscopic examination. In addition, to avoid misclassification bias, controls were recruited from the same hospitals within 1 year. All controls were confirmed to have no gastric pathologies following gastroscopy. The main results of the various statistical analyses were also compared. The results of the unconditional logistic and conditional logistic regression were similar, except for individual intake of soy products. In addition, when each food group was analyzed in combination, the results of the unconditional logistic and conditional logistic regression were similar, and in the conditional analysis, the magnitude of association between the incidence of GC and combined food groups was strengthened compared to the unconditional analysis. When tertiles and median values considering sex were applied, the results of the combination of protective foods were almost similar to those not applied considering sex, except for individual intake of soy and fruits.
This study has some limitations. First, the sample size for the analysis was small because only those infected with H. pylori were selected, and some cases and controls were excluded because they were not matched for age, sex, study admission period, or hospital visit. In addition, the cases were recruited from only 2 hospitals, and the controls were recruited from the same hospital; thus, they may be less representative of the general population. There may also be unintentional non-differential misclassifications because of a minor difference in the content of the FFQ survey depending on the recruitment period. In addition, various confounding factors were adjusted for in the statistical model; however, there may have been residual confounders.
In conclusion, a higher daily intake of soy products or fruits was associated with a lower incidence of GC in H. pylori-infected subjects in Korea. When food groups were combined, the incidence of GC was significantly lower in the combination of a high intake of soy products with fruits or dairy products. In particular, subjects who consumed a variety of potentially protective food groups were demonstrated a significantly lower incidence of GC. Therefore, intake of various potentially protective foods may help prevent GC in H. pylori-infected subjects.
 XML Download