

 PDF
PDF Citation
 Print
Print


INTRODUCTION
METHODS
Methodology
Search method for identification of studies
Data extraction and study selection
Table 1.
| Characteristic |
Boughton et al. (2021) [11]a |
Hsu et al. (2021) [13]a |
Klonoff et al. (2019) [12] |
Ozer et al. (2021) [5]a |
|
|---|---|---|---|---|---|
| Study/Control group (n=25) | Study/Control group (n=19) | Study group (n=236) | Control group (n=236) | Study/Control group (n=40) | |
| Age, yr | 38.0±9.0 | 40.4±17.7 | 43.3±14.8 | 43.6±14.7 | 45.7±12.93 |
| Male sex, % | 48.0 | 53.0 | 43.6 | 42.4 | 67.76 |
| Participants | 22.0±12.0 yr T1DMD | 26.6±12.3 yr T1DMD | 25±12.7 yr T1DMD | 23.3±11.3 yr T1DMD | Adults >18 yr; T1DMD >1 yr |
| Study duration, wk | 8 | 2 | 16 | 16 | 7 |
| Baseline HbA1c, % | 7.4±0.8 | 7.1±0.54 | 7.5±0.5 | 7.5±0.5 | 7.0±0.54 |
| BMI, kg/m2 | 26.0±4.3 | NA | 26.2±4.1 | 26.5±3.9 | 27.1±3.41 |
![]()
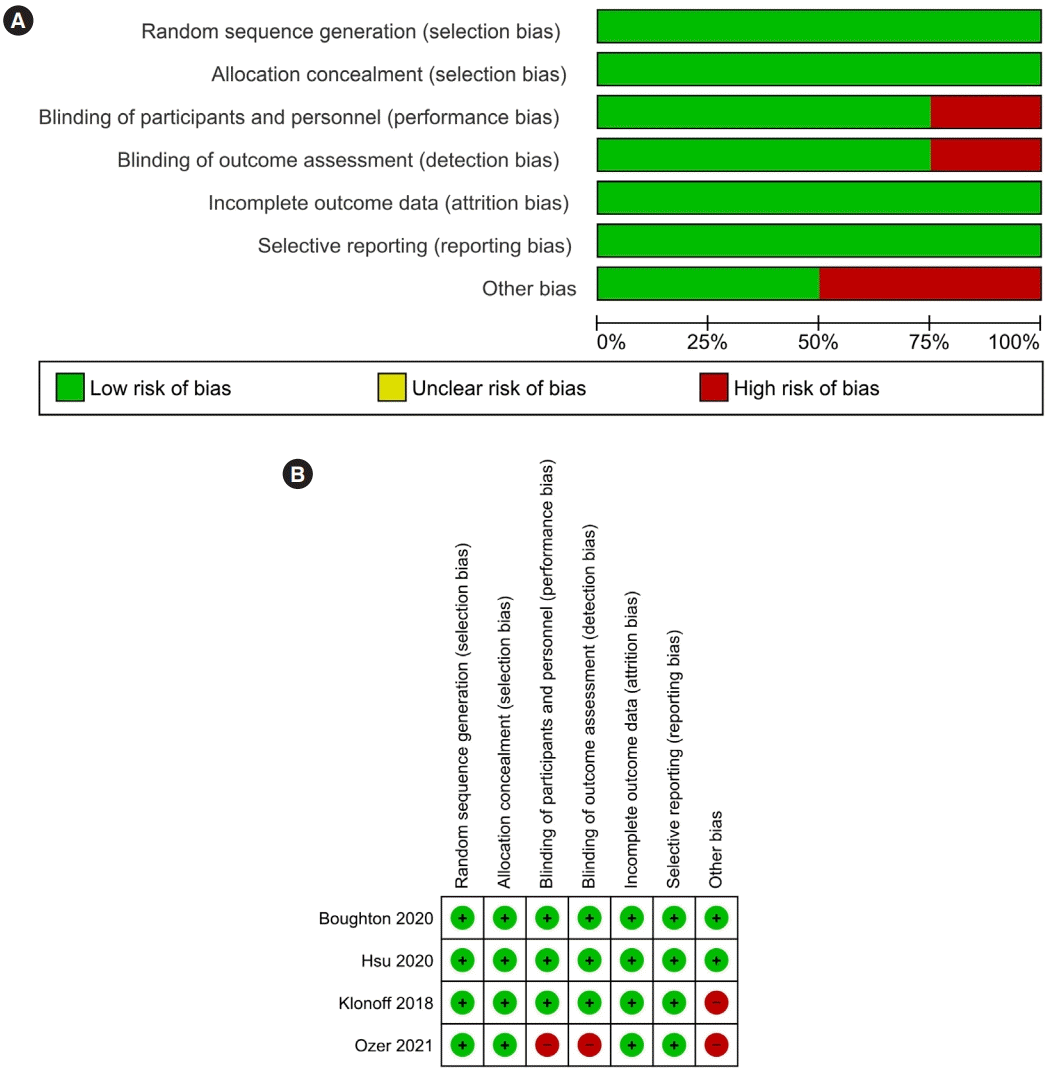
Assessment of risk of bias in included studies
Measures of treatment effect
Assessment of heterogeneity
Grading of the results
Data synthesis
RESULTS
Risk of bias in the included studies
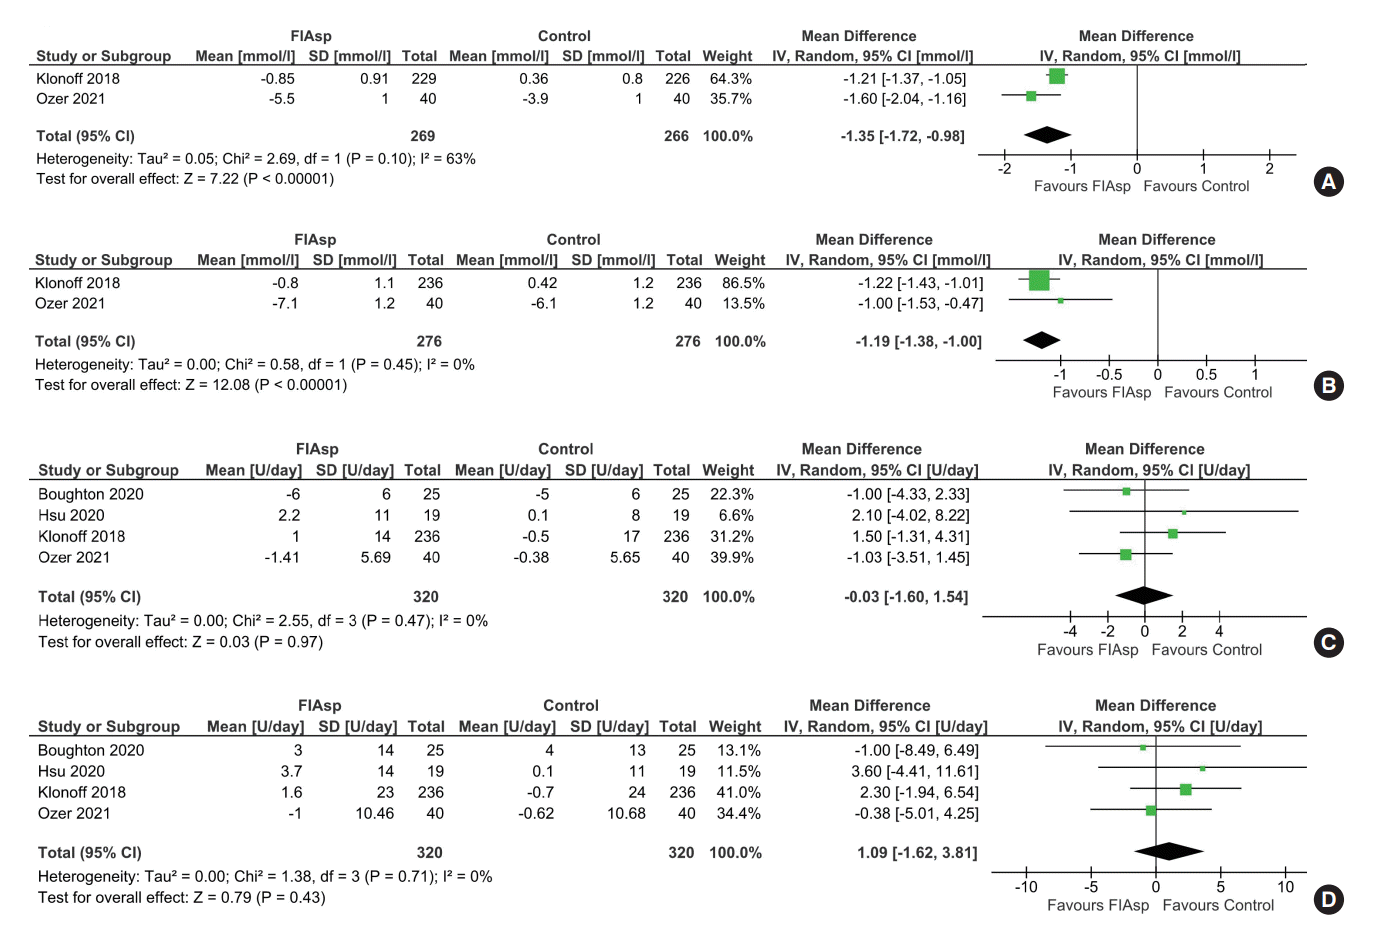
Effect of FIAsp on primary outcomes
One-hour and 2-hour post-prandial glucose
Fig. 2.
![]()
Effect of FIAsp on secondary outcomes
Insulin requirements
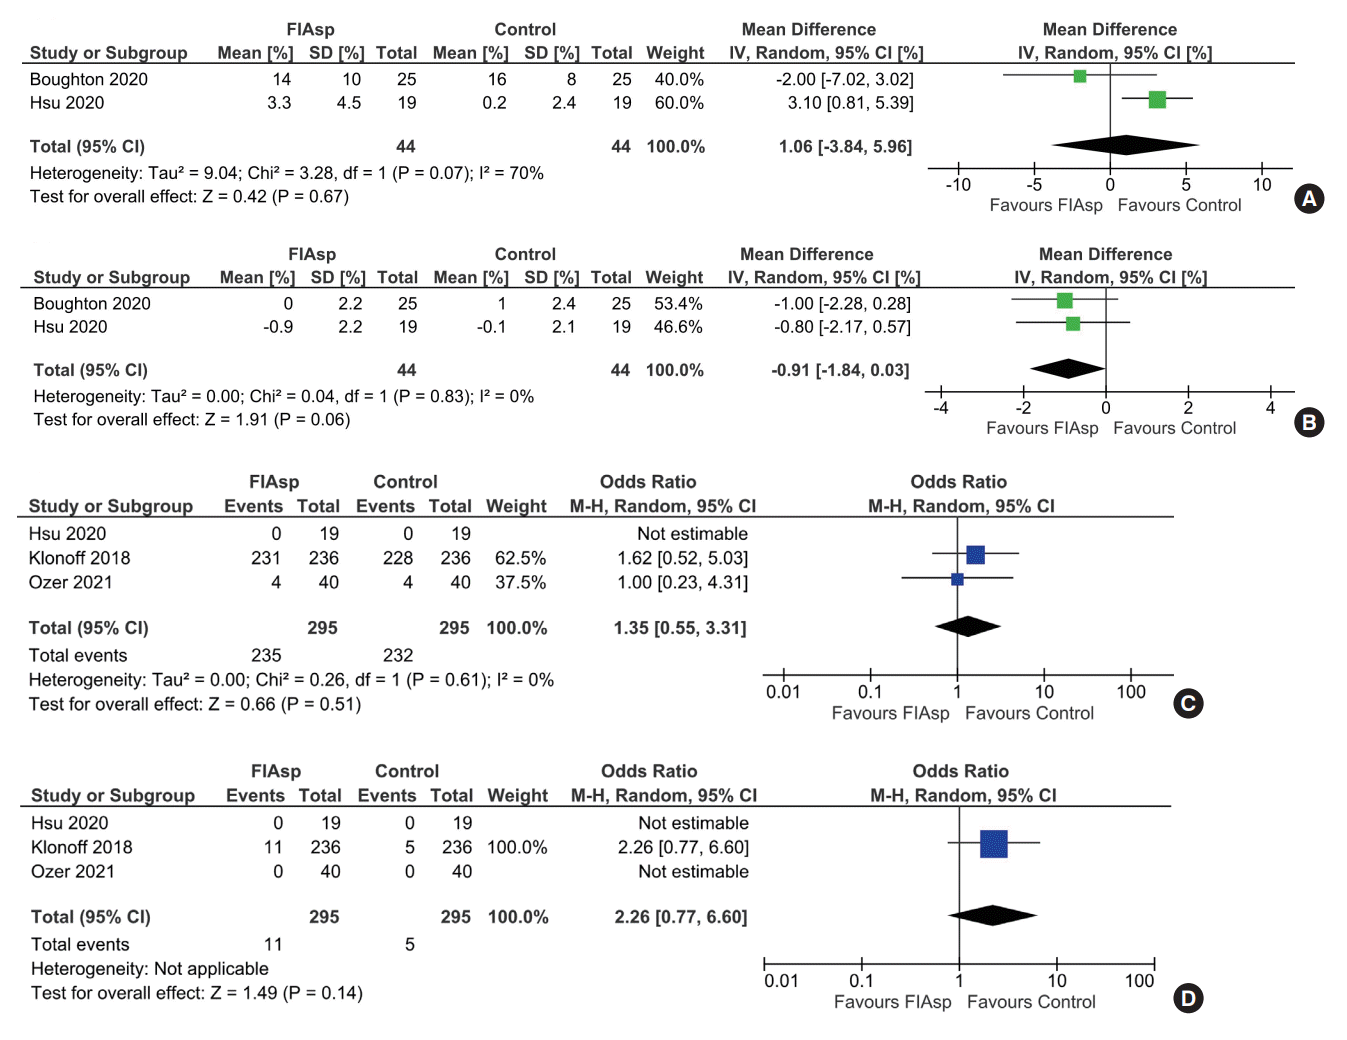
CGM glycaemic parameters
Fig. 3.
![]()
Glycosylated hemoglobin reduction
Safety
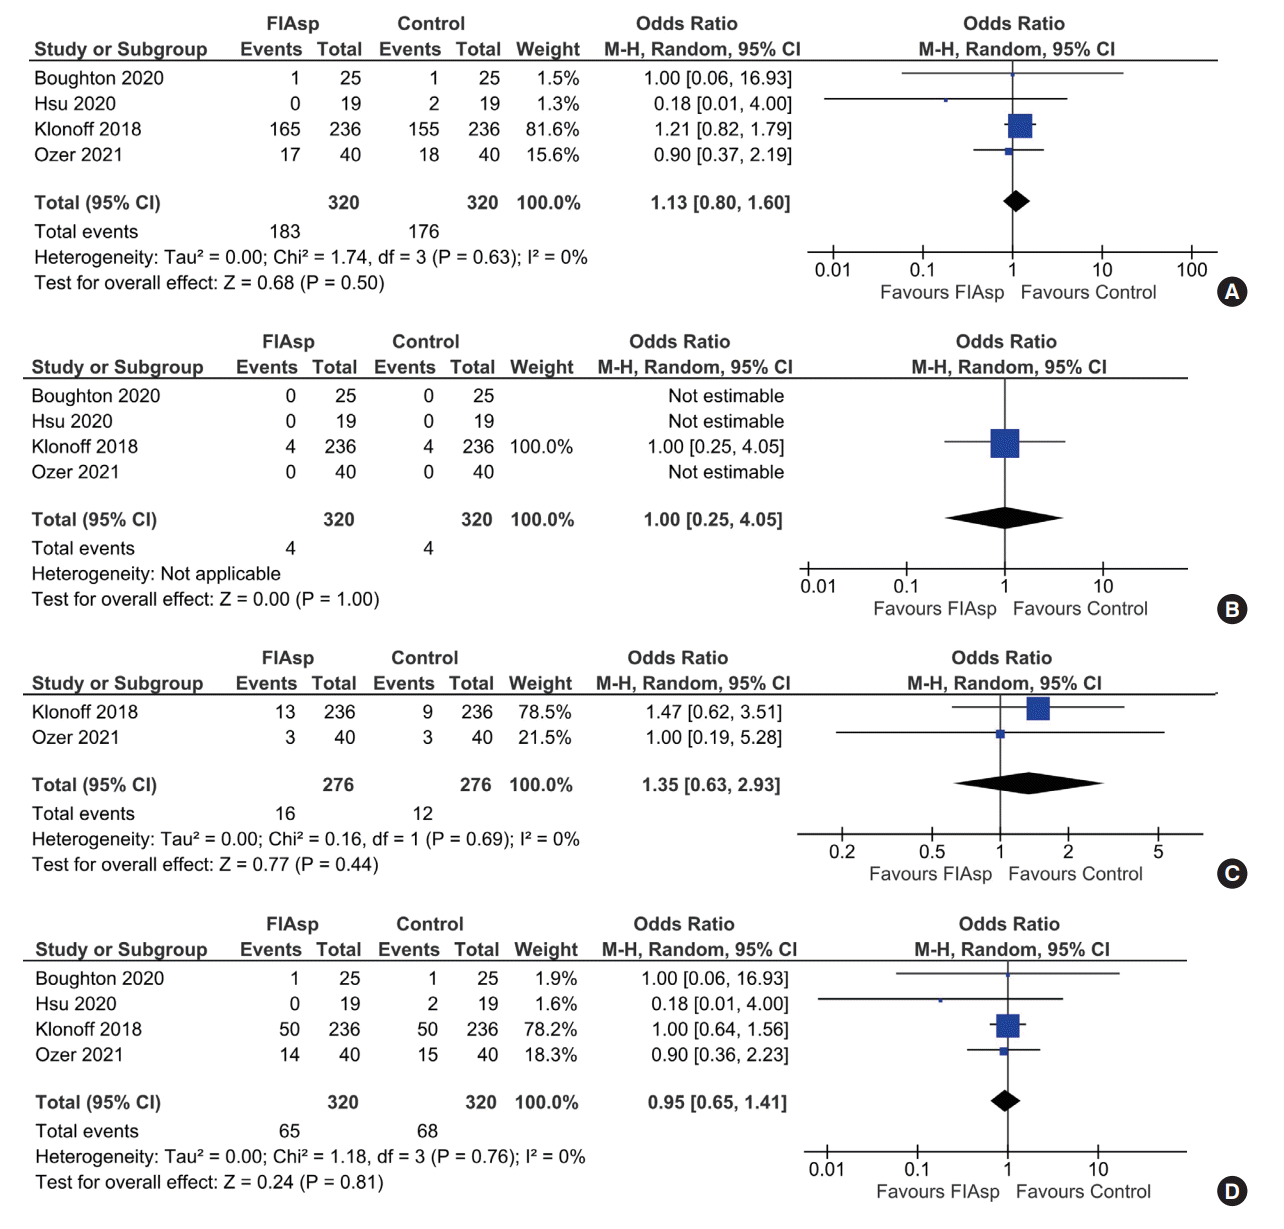
Table 2.
| Outcomes |
Anticipated absolute effectsa (95% CI) |
Relative effect (95% CI) | No. of participants (studies) | Certainty of the evidence (GRADE) | |
|---|---|---|---|---|---|
| Risk with control | Risk with FIAsp | ||||
| 1-hr post-prandial glucose | The mean 1h post-prandial glucose was 10.49 mmol/L | MD 1.35 mmol/L lower (1.72 lower–0.98 lower) | - | 535 (2 RCTs) | ⊕⊕⊕⊕ |
| High | |||||
| 2-hr post-prandial glucose | The mean 2h post-prandial glucose was 12.08 mmol/L | MD 1.19 mmol/L lower (1.38 lower–1 lower) | - | 552 (2 RCTs) | ⊕⊕⊕⊕ |
| High | |||||
| Treatment-emergent adverse events | 550 per 1,000 | 580 per 1,000 (494–662) | OR 1.13 (0.80–1.60) | 640 (4 RCTs) | ⊕⊕⊕⊖ |
| Moderateb | |||||
| Total hypoglycaemic episodes | 786 per 1,000 | 833 per 1,000 (669–924) | OR 1.35 (0.55–3.31) | 590 (3 RCTs) | ⊕⊕⊕⊕ |
| High | |||||
| Occlusion events | 213 per 1,000 | 204 per 1,000 (149–276) | OR 0.95 (0.65–1.41) | 640 (4 RCTs) | ⊕⊕⊕⊖ |
| Moderateb | |||||
GRADE Working Group grades of evidence: High certainty (we are very confident that the true effect lies close to that of the estimate of the effect), Moderate certainty (we are moderately confident in the effect estimate: the true effect is likely to be close to the estimate of the effect, but there is a possibility that it is substantially different), Low certainty (our confidence in the effect estimate is limited: the true effect may be substantially different from the estimate of the effect), Very low certainty (we have very little confidence in the effect estimate: the true effect is likely to be substantially different from the estimate of effect).
CI, confidence interval; GRADE, Grades of Recommendation, Assessment, Development and Evaluation; FIAsp, fast-acting aspart insulin; MD, mean difference; RCT, randomised controlled trial; OR, odds ratio.
a The risk in the intervention group (and its 95% CI) is based on the assumed risk in the comparison group and the relative effect of the intervention (and its 95% CI),
b Funnel plot is suggestive of presence of most of the studies outside the plot; hence, it is likely that significant publication bias is present (Supplementary Fig. 2).
![]()
 XML Download