INTRODUCTION
METHODS
Data sources
Study subjects
Definitions of measurements
Study outcomes
Statistical analysis
RESULTS
Baseline characteristics
Table 1.
Values are presented as number (%) or mean±standard deviation. P values for the trend were <0.0001 for all variables because of the large size of the study population.
CVD, cardiovascular disease; DM, diabetes mellitus; BMI, body mass index; SBP, systolic blood pressure; DBP, diastolic blood pressure; LDL-C, low-density lipoprotein cholesterol; HDL-C, high-density lipoprotein cholesterol; eGFR, estimated glomerular filtration rate.
Risk of MI and stroke according to the CVD risk group
Risk of MI and stroke according to LDL-C categories
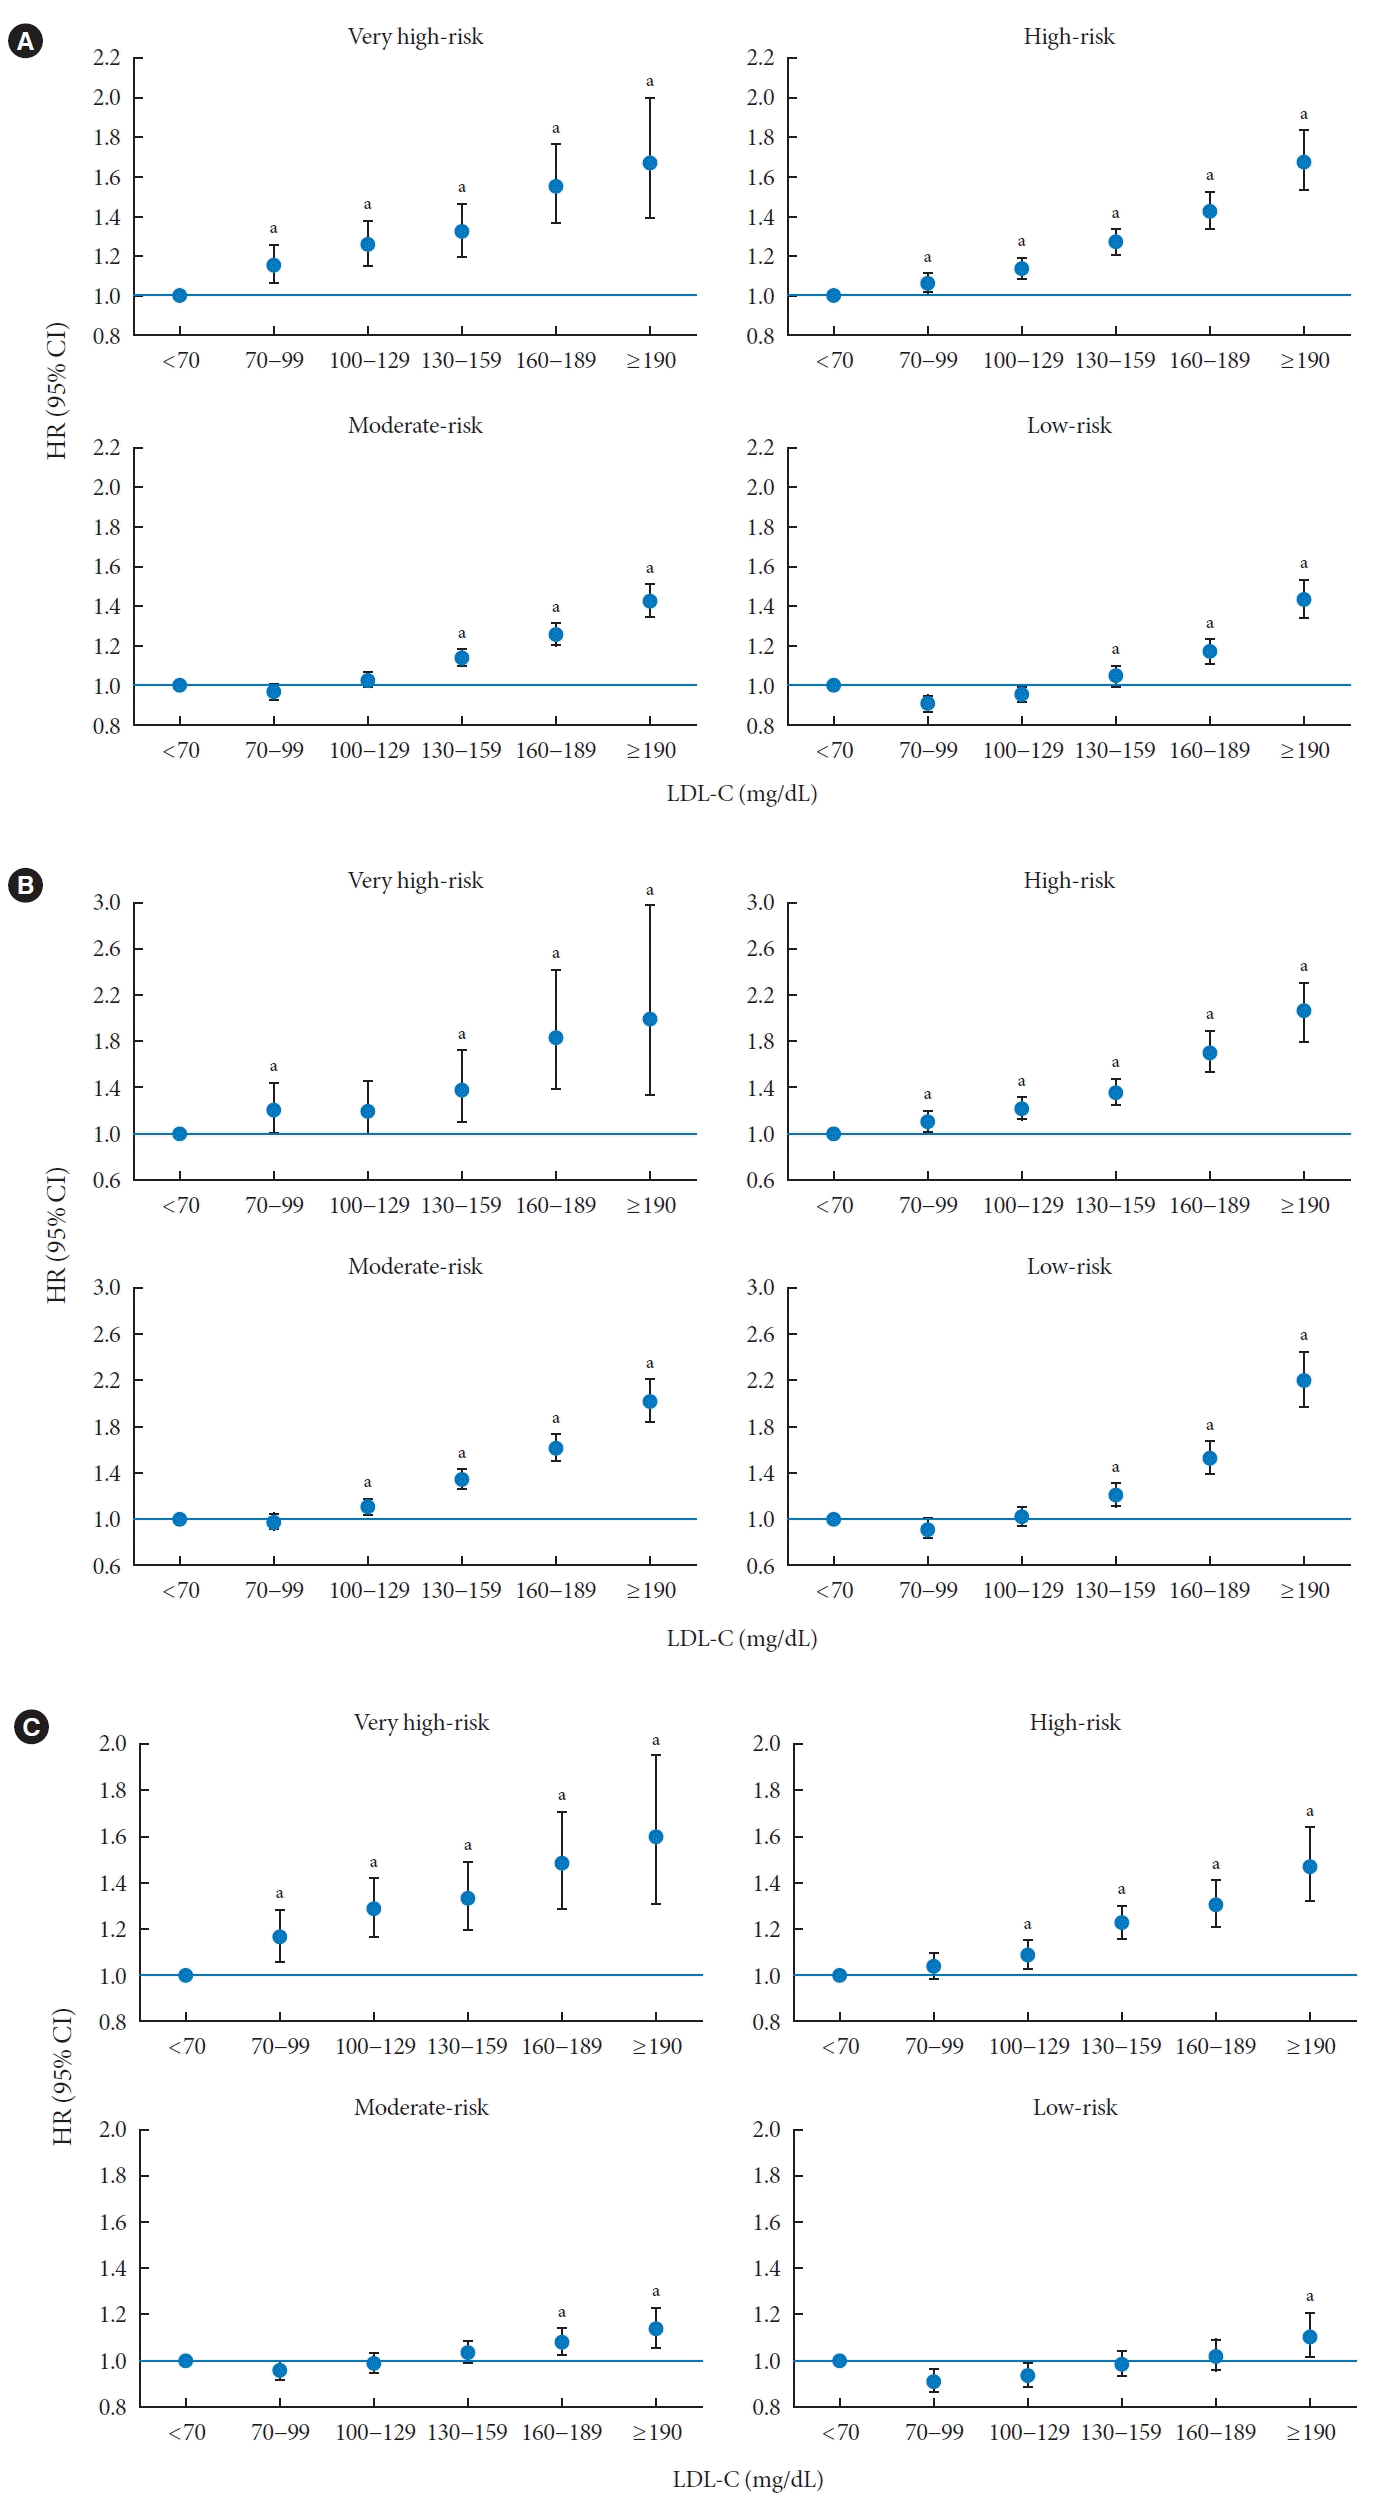
LDL-C level and CVD in the very high-risk category
Fig. 1.

Table 2.
| LDL-C, mg/dL |
MI |
Stroke |
Composite of MI and stroke |
|||||||
|---|---|---|---|---|---|---|---|---|---|---|
| No. of events | Incidence rate, /1,000 person-yr | HR (95% CI)a | No. of events | Incidence rate, /1,000 person-yr | HR (95% CI)a | No. of events | Incidence rate, /1,000 person-yr | HR (95% CI)a | ||
| Very high-risk group | ||||||||||
| <70 | 179 | 3.91 | 1 (Reference) | 395 | 8.79 | 1 (Reference) | 558 | 12.61 | 1 (Reference) | |
| 70–99 | 339 | 3.88 | 1.22 (1.01–1.46) | 876 | 10.27 | 1.20 (1.06–1.35) | 1,183 | 14.06 | 1.20 (1.08–1.33) | |
| 100–129 | 247 | 2.98 | 1.18 (0.97–1.44) | 857 | 10.63 | 1.30 (1.15–1.48) | 1,078 | 13.52 | 1.27 (1.15–1.42) | |
| 130–159 | 154 | 3.16 | 1.38 (1.10–1.74) | 535 | 11.33 | 1.41 (1.23–1.61) | 666 | 14.26 | 1.39 (1.23–1.56) | |
| 160–189 | 72 | 4.41 | 1.84 (1.39–2.44) | 203 | 12.86 | 1.60 (1.34–1.90) | 272 | 17.55 | 1.69 (1.45–1.96) | |
| ≥190 | 27 | 4.52 | 1.99 (1.32–2.99) | 82 | 14.29 | 1.79 (1.40–2.27) | 106 | 18.82 | 1.84 (1.49–2.27) | |
| P for trend | <0.0001 | <0.0001 | <0.0001 | |||||||
| High-risk group | ||||||||||
| <70 | 780 | 3.06 | 1 (Reference) | 1,675 | 6.65 | 1 (Reference) | 2,332 | 9.34 | 1 (Reference) | |
| 70–99 | 1,869 | 3.28 | 1.12 (1.03–1.22) | 3,841 | 6.84 | 1.04 (0.98–1.10) | 5,441 | 9.77 | 1.07 (1.02–1.13) | |
| 100–129 | 2,164 | 3.47 | 1.25 (1.15–1.36) | 4,361 | 7.09 | 1.10 (1.04–1.17) | 6,222 | 10.23 | 1.16 (1.10–1.21) | |
| 130–159 | 1,368 | 3.82 | 1.40 (1.28–1.53) | 2,759 | 7.82 | 1.23 (1.16–1.31) | 3,907 | 11.21 | 1.29 (1.22–1.36) | |
| 160–189 | 564 | 4.68 | 1.74 (1.56–1.94) | 975 | 8.21 | 1.31 (1.21–1.42) | 1,445 | 12.36 | 1.45 (1.36–1.55) | |
| ≥190 | 237 | 5.82 | 2.16 (1.87–2.51) | 371 | 9.26 | 1.51 (1.34–1.69) | 574 | 14.60 | 1.73 (1.58–1.90) | |
| P for trend | <0.0001 | <0.0001 | <0.0001 | |||||||
| Moderate-risk group | ||||||||||
| <70 | 947 | 1.69 | 1 (Reference) | 2,177 | 3.91 | 1 (Reference) | 3,007 | 5.42 | 1 (Reference) | |
| 70–99 | 3,099 | 1.58 | 0.99 (0.92–1.07) | 6,915 | 3.54 | 0.96 (0.92–1.01) | 9,664 | 4.98 | 0.97 (0.93–1.01) | |
| 100–129 | 5,183 | 1.76 | 1.13 (1.06–1.22) | 10,534 | 3.59 | 0.99 (0.95–1.04) | 15,209 | 5.22 | 1.04 (0.99–1.08) | |
| 130–159 | 4,340 | 2.18 | 1.39 (1.29–1.49) | 7,560 | 3.82 | 1.04 (0.99–1.09) | 11,505 | 5.86 | 1.16 (1.11–1.20) | |
| 160–189 | 1,950 | 2.73 | 1.67 (1.55–1.81) | 2,914 | 4.10 | 1.09 (1.03–1.15) | 4,689 | 6.66 | 1.28 (1.22–1.34) | |
| ≥190 | 759 | 3.54 | 2.09 (1.90–2.31) | 952 | 4.46 | 1.15 (1.06–1.24) | 1,640 | 7.78 | 1.45 (1.36–1.54) | |
| P for trend | <0.0001 | <0.0001 | <0.0001 | |||||||
| Low-risk group | ||||||||||
| <70 | 665 | 0.36 | 1 (Reference) | 1,547 | 0.83 | 1 (Reference) | 2,156 | 1.16 | 1 (Reference) | |
| 70–99 | 2,229 | 0.30 | 0.93 (0.85–1.01) | 5,161 | 0.70 | 0.92 (0.87–0.98) | 7,229 | 0.99 | 0.93 (0.88–0.97) | |
| 100–129 | 3,668 | 0.40 | 1.04 (0.96–1.13) | 8,004 | 0.87 | 0.95 (0.90–1.00) | 11,406 | 1.24 | 0.98 (0.93–1.02) | |
| 130–159 | 2,873 | 0.56 | 1.23 (1.13–1.34) | 5,740 | 1.13 | 1.01 (0.95–1.06) | 8,398 | 1.65 | 1.07 (1.02–1.13) | |
| 160–189 | 1,368 | 0.83 | 1.57 (1.43–1.72) | 2,235 | 1.36 | 1.04 (0.97–1.11) | 3,512 | 2.15 | 1.20 (1.13–1.26) | |
| ≥190 | 631 | 1.33 | 2.25 (2.02–2.52) | 791 | 1.67 | 1.13 (1.03–1.23) | 1,392 | 2.95 | 1.47 (1.37–1.57) | |
| P for trend | <0.0001 | <0.0001 | <0.0001 | |||||||
LDL-C level and CVD in high-risk category
LDL-C level and CVD in moderate-risk category
LDL-C level and CVD in low-risk group
Risk of MI and stroke according to non-HDL categories
Table 3.
| Non-HDL-C, mg/dL |
MI |
Stroke |
MI or stroke |
|||||||
|---|---|---|---|---|---|---|---|---|---|---|
| No. of events | Incidence rate, /1,000 person-yr | HR (95% CI)a | No. of events | Incidence rate, /1,000 person-yr | HR (95% CI)a | No. of events | Incidence rate, /1,000 person-yr | HR (95% CI)a | ||
| Very high-risk group | ||||||||||
| <100 | 217 | 3.80 | 1 (Reference) | 492 | 8.78 | 1 (Reference) | 691 | 12.51 | 1 (Reference) | |
| 100–129 | 292 | 3.51 | 1.12 (0.94–1.34) | 844 | 10.41 | 1.22 (1.09–1.37) | 1,106 | 13.82 | 1.20 (1.09–1.32) | |
| 130–159 | 248 | 3.22 | 1.25 (1.03–1.51) | 771 | 10.32 | 1.27 (1.13–1.43) | 994 | 13.46 | 1.26 (1.14–1.40) | |
| 160–189 | 136 | 3.03 | 1.25 (1.00–1.56) | 515 | 11.86 | 1.45 (1.28–1.66) | 631 | 14.70 | 1.40 (1.25–1.57) | |
| 190–219 | 86 | 5.00 | 1.99 (1.54–2.57) | 201 | 11.99 | 1.47 (1.24–1.74) | 281 | 17.10 | 1.61 (1.40–1.86) | |
| ≥220 | 38 | 5.54 | 2.16 (1.52–3.06) | 107 | 16.41 | 1.98 (1.60–2.45) | 141 | 22.12 | 2.05 (1.71–2.47) | |
| P for trend | <0.0001 | <0.0001 | <0.0001 | |||||||
| High-risk group | ||||||||||
| <100 | 848 | 2.94 | 1 (Reference) | 1,869 | 6.56 | 1 (Reference) | 2,590 | 9.17 | 1 (Reference) | |
| 100–129 | 1,639 | 3.02 | 1.10 (1.01–1.19) | 3,550 | 6.62 | 1.05 (0.99–1.11) | 4,951 | 9.36 | 1.07 (1.02–1.12) | |
| 130–159 | 2,100 | 3.60 | 1.37 (1.26–1.49) | 4,135 | 7.20 | 1.16 (1.10–1.23) | 5,931 | 10.44 | 1.23 (1.17–1.29) | |
| 160–189 | 1,368 | 3.84 | 1.50 (1.37–1.64) | 2,690 | 7.67 | 1.27 (1.20–1.35) | 3,849 | 11.11 | 1.35 (1.28–1.42) | |
| 190–219 | 671 | 4.95 | 1.92 (1.73–2.13) | 1,166 | 8.73 | 1.45 (1.35–1.56) | 1,732 | 13.18 | 1.60 (1.51–1.70) | |
| ≥220 | 325 | 5.92 | 2.34 (2.06–2.66) | 512 | 9.48 | 1.63 (1.47–1.79) | 785 | 14.82 | 1.85 (1.71–2.01) | |
| P for trend | <0.0001 | <0.0001 | <0.0001 | |||||||
| Moderate-risk group | ||||||||||
| <100 | 1,023 | 1.73 | 1 (Reference) | 2,394 | 4.07 | 1 (Reference) | 3,296 | 5.63 | 1 (Reference) | |
| 100–129 | 2,950 | 1.56 | 1.00 (0.93–1.08) | 6,902 | 3.67 | 1.02 (0.97–1.07) | 9,501 | 5.07 | 1.01 (0.97–1.05) | |
| 130–159 | 4,791 | 1.72 | 1.17 (1.09–1.25) | 9,928 | 3.58 | 1.05 (1.01–1.10) | 14,255 | 5.17 | 1.09 (1.05–1.14) | |
| 160–189 | 4,295 | 2.13 | 1.47 (1.37–1.58) | 7,360 | 3.66 | 1.11 (1.06–1.16) | 11,266 | 5.65 | 1.22 (1.18–1.27) | |
| 190–219 | 2,193 | 2.71 | 1.82 (1.69–1.96) | 3,214 | 3.99 | 1.19 (1.13–1.26) | 5,205 | 6.52 | 1.39 (1.33–1.45) | |
| ≥220 | 1,012 | 3.55 | 2.32 (2.12–2.53) | 1,219 | 4.29 | 1.26 (1.18–1.35) | 2,144 | 7.64 | 1.60 (1.51–1.69) | |
| P for trend | <0.0001 | <0.0001 | <0.0001 | |||||||
| Low-risk group | ||||||||||
| <100 | 1,017 | 0.27 | 1 (Reference) | 2,429 | 0.63 | 1 (Reference) | 3,357 | 0.88 | 1 (Reference) | |
| 100–129 | 2,449 | 0.31 | 0.99 (0.92–1.07) | 5,787 | 0.73 | 0.97 (0.92–1.01) | 8,070 | 1.022 | 0.98 (0.94–1.02) | |
| 130–159 | 3,330 | 0.43 | 1.16 (1.08–1.24) | 7,362 | 0.96 | 1.04 (0.99–1.09) | 10,451 | 1.36 | 1.08 (1.04–1.12) | |
| 160–189 | 2,579 | 0.62 | 1.45 (1.35–1.57) | 4,852 | 1.17 | 1.10 (1.05–1.16) | 7,245 | 1.75 | 1.21 (1.16–1.26) | |
| 190–219 | 1,289 | 0.89 | 1.86 (1.71–2.03) | 2,023 | 1.39 | 1.18 (1.11–1.25) | 3,224 | 2.23 | 1.38 (1.32,1.45) | |
| ≥220 | 674 | 1.39 | 2.67 (2.42–2.95) | 821 | 1.69 | 1.30 (1.20–1.41) | 1,458 | 3.02 | 1.71 (1.61–1.82) | |
| P for trend | <0.0001 | <0.0001 | <0.0001 | |||||||


 PDF
PDF Citation
 Print
Print


 XML Download