INTRODUCTION
METHODS
Study design
Data extraction and group comparisons
Multivariate regression analysis
Statistical analysis
RESULTS
Patient characteristics
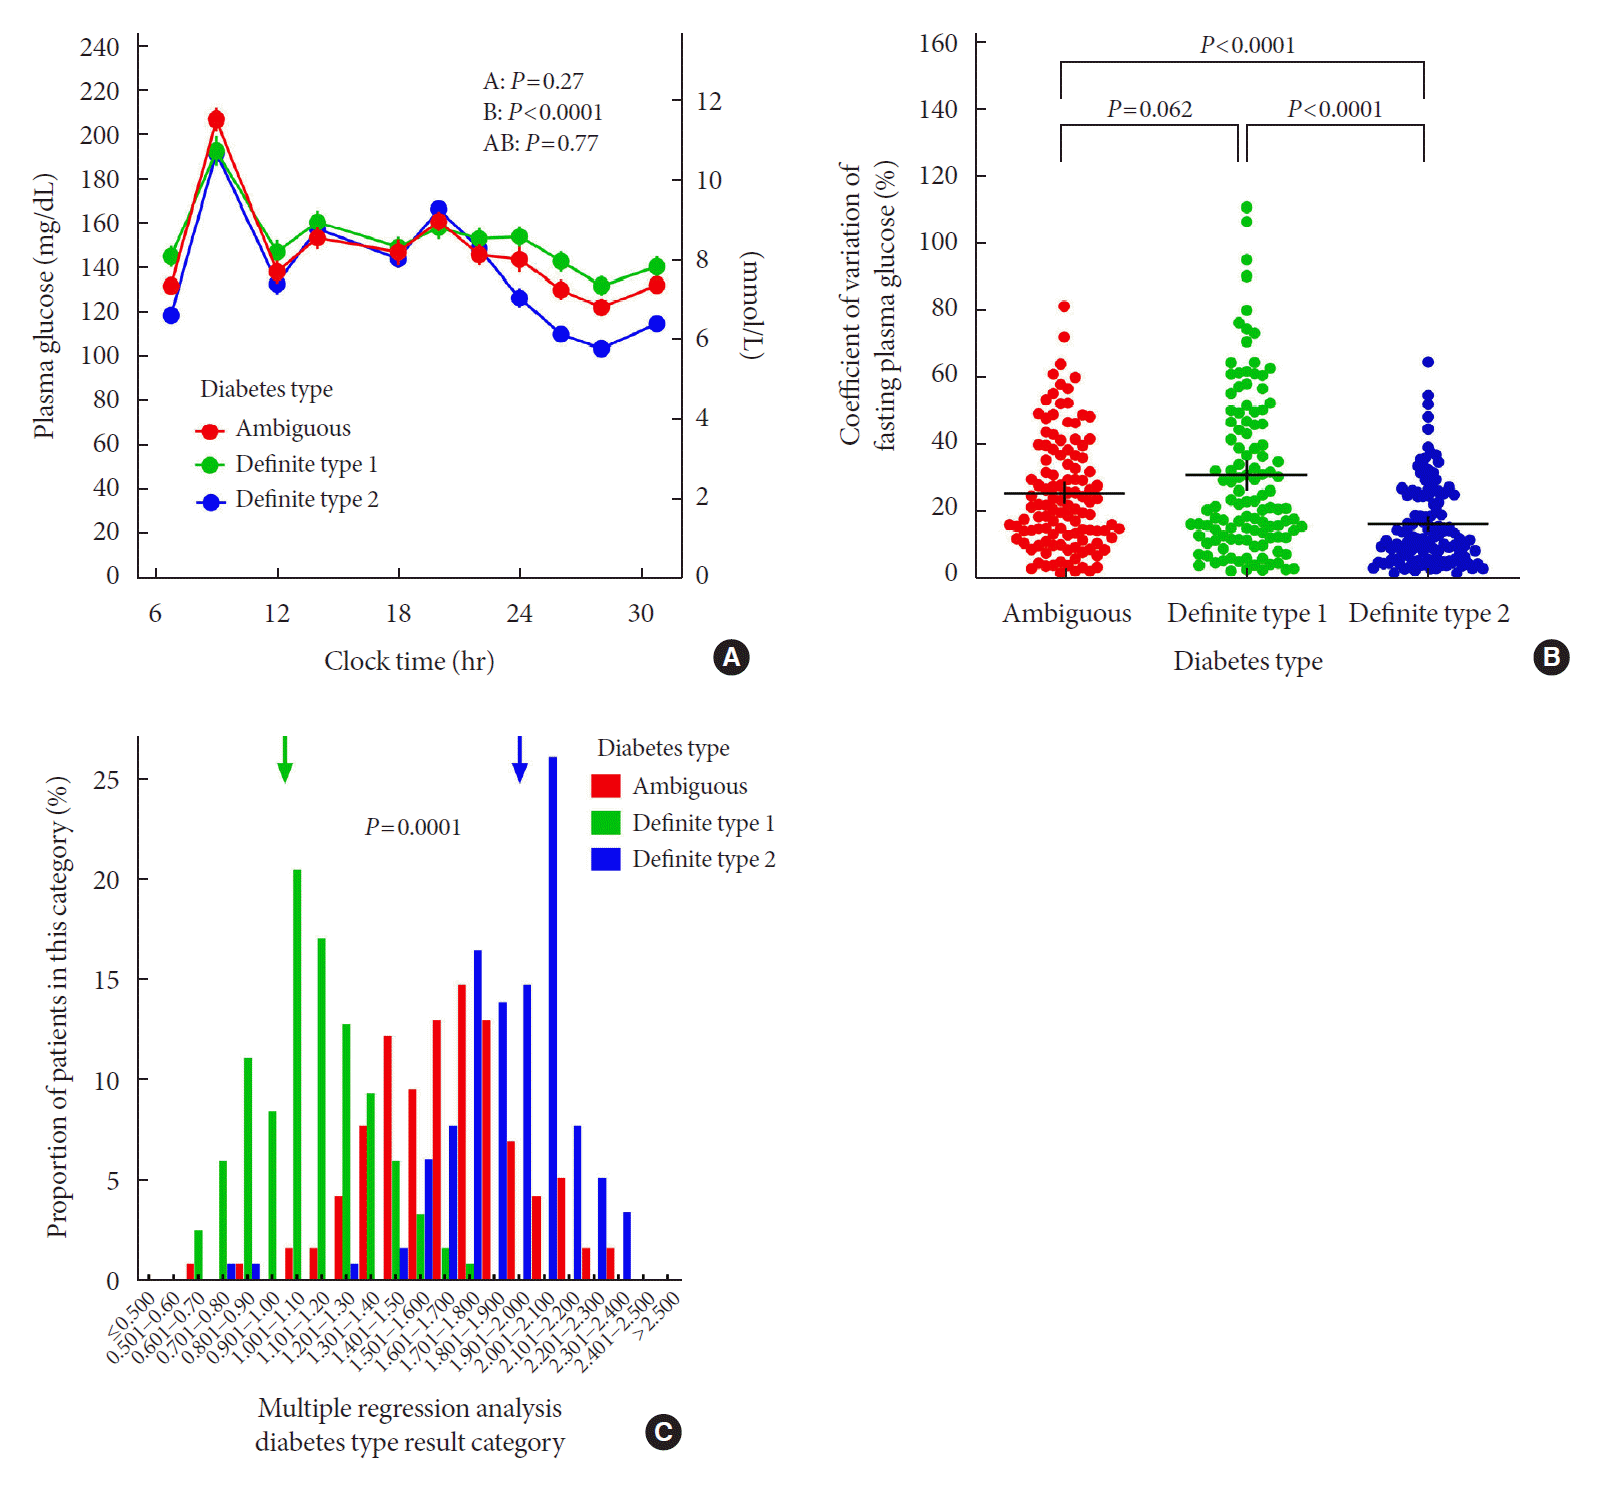
Fig. 1.

Table 1.
| Parameter | Diabetes type ambiguous (n=115) | Definite T1DM (n=117) | Definite T2DM (n=120) | Significance (P value) | |
|---|---|---|---|---|---|
| Age, yr | 66±12 | 50±16a | 64±12b | <0.0001 | |
| Sex, female/male (% female) | 55/60 (47.8) | 52/65 (44.4) | 45/75 (37.5) | 0.26 | |
| BMI, kg/m2 | 30.3±5.9 | 26.2±4.7a | 34.1±6.5a,b | <0.0001 | |
| Age at diagnosis, yr | 49.3±11.3 (n=114) | 29.6±14.9a | 52.8±11.8a,b (n=119) | <0.0001 | |
| Start of insulin treatment after diagnosis, yr | 5.8±6.3 (n=107) | 0.5±2.2a (n=102) | 4.9±5.2b (n=112) | <0.0001 | |
| Family history (first degree relatives) of T2DM, yes/no (% yes) | 49/66 (42.6) | 20/97 (11.8)a | 51/69 (42.5)b | 0.0001 | |
| History of ketoacidosis, yes/no (% yes) | 4/111 (3.5) | 20/97 (17.1)a | 4/116 (3.3)b | <0.0001 | |
| Treatment with any oral glucose-lowering agents, yes/no (% yes) | 14/101 (12.2) | 1/116 (0.9)a | 71/49 (59.2)a,b | <0.0001 | |
| Metformin, yes/no (% yes) | 12/103 (10.4) | 1/116 (0.9)a | 60/60 (50.0)a,b | <0.0001 | |
| GLP-1 receptor agonists, yes/no (% yes) | 0/115 (0.0) | 0/117 (0.0) | 15/105 (12.5)a,b | <0.0001 | |
| Type of insulin regimen | |||||
| Basal insulin only, yes/no (% yes) | 0/115 (0.0) | 0/117 (0.0) | 44/76 (36.7) | ||
| Conventional (premixed), yes/no (% yes) | 5/110 (4.3) | 0/117 (0.0) | 25/95 (20.8) | ||
| Intensified (basal/bolus), yes/no (% yes) | 110/5 (95.7) | 117/0 (100.0) | 51/69 (42.5) | ||
| Insulin dose, IU/kg/day | 0.99±0.69 | 0.72±0.37a | 0.99±0.75b | 0.0007 | |
| Symptomatic hypoglycaemia, number/week | 1.8±2.8 (n=64) | 2.8±2.8 (n=93) | 1.5±1.7 (n=27) | 0.22 | |
| Severe hypoglycaemia, yes/no (% yes) | 18/97 (15.7) | 36/81 (30.8)a | 6/114 (5.0)a,b | <0.0001 | |
| Severe hypoglycaemia, events/last 12 months | 0.17±0.65 | 0.81±3.64 | 0.09±0.48 (n=114) | 0.20 | |
| HbA1c, % | 9.5±1.8 | 8.9±2.1a | 9.1±2.0b | 0.0095 | |
| C-peptide, nmol/L | 0.17±0.14 | 0.11±0.21 (n=52) | 0.64±0.43a,b (n=95) | <0.0001 | |
| GAD antibodies positive, yes/no (% yes) | 13/22 (37.1) | 7/8 (46.7) | 0/9 (0.0) | 0.053 | |
| Anti-IA2 antibodies positive, yes/no (% yes) | 1/4 (20.0) | 1/0 (50.0) | 0/0 (0.0) | 0.30 | |
| (Pro-)insulin autoantibodies positive, yes/no (% yes) | 1/3 (25.0) | 0/6 (0.0) | 0/0 (0.0) | 0.43 | |
| ≥2 Antibodies positive, yes/no (% yes) | 1/5 (16.7) | 0/2 (0.0) | 0/0 (0.0) | 0.83 | |
| Triglyceride, mg/dL | 150.6±107.4 | 122.9±88.3 | 221.8±135.1a,b | <0.0001 | |
| HDL-C, mg/dL | 50.2±17.5 (n=114) | 56.1±15.2a | 38.5±10.8a,b | <0.0001 | |
| Triglyceride high or HDL-C low, yes/no (% yes) | 49/66 (42.6) | 32/85 (27.4)a | 95/25 (79.2)a,b | <0.0001 | |
| eGFR (CKD-EPI equation), mL/min | 83.4±14.5 | 95.7±19.1a | 82.0±13.6b | <0.0001 | |
| Urinary albumin excretion, mg/g creatinine | 46.8±106.9 (n=112) | 84.2±264.5 (n=115) | 77.7±239.8 (n=118) | 0.38 | |
| Abnormal urinary albumin excretion, yes/no (% yes) | 33/79 (29.5) (n=112) | 22/93 (19.1) (n=115) | 27/91 (22.9) (n=118) | 0.18 | |
| Systolic blood presssure, mm Hg | 135±15 | 128±13a | 133±14b | 0.0015 | |
| Arterial hypertension, yes/no (% yes)c | 109/6 (94.8) | 74/43 (63.2)a | 112/8 (93.3)b | <0.0001 | |
| Vitiligo, yes/no (% yes) | 3/112 (2.6) | 1/116 (0.9) | 0/120 (0) | 0.16 | |
| Autoimmune thyroiditis, yes/no (% yes) | 12/103 (10.4) | 10/107 (8.5) | 2/118 (1.6)a,b | 0.019 | |
| Levothyroxine treatment, yes/no (% yes) | 22/93 (19.1) | 30/87 (25.6) | 19/191 (15.8) | 0.16 | |
| Hypoparathyroidism, yes/no (% yes) | 2/113 (1.7) | 1/116 (0.9) | 0/120 (0) | 0.35 | |
| Hypocalcaemia, yes/no (% yes) | 18/97 (15.7) | 15/102 (12.8) | 14/106 (11.7) | 0.65 | |
| Serum calcium, mg/dL | 8.9±0.5 | 8.9±0.4 | 9.0±0.4 | 0.13 | |
| Autoimmune gastritis, yes/no (% yes) | 6/109 (5.2) | 0/117 (0.0)a | 2/118 (1.7) | 0.025 | |
| Macrocytosis/anaemia, yes/no (% yes) | 22/93 (19.1) | 28/89 (23.9) | 36/84 (30.0) | 0.15 | |
Values are presented as mean±standard deviation or number (%). Statistical analysis: ANOVA with Duncan’s post hoc test for continuous variables or chi-square test for categorical variables.
T1DM, type 1 diabetes mellitus; T2DM, type 2 diabetes mellitus; BMI, body mass index; GLP-1, glucagon-like peptide-1; HbA1c, glycosylated hemoglobin; GAD, glutamic acid decarboxylase; HDL-C, high-density lipoprotein cholesterol; eGFR, estimated glomerular filtration rate; CKD-EPI, Chronic Kidney Disease Epidemiology Collaboration.


 PDF
PDF Citation
 Print
Print


 XML Download