Abstract
Background and Purpose
Methods
Results
Supplementary materials
Supplementary Table 1.
Supplementary Table 2.
Supplementary Table 3.
Supplementary Table 4.
Supplementary Figure 1.
Supplementary Figure 2.
ACKNOWLEDGMENTS
References
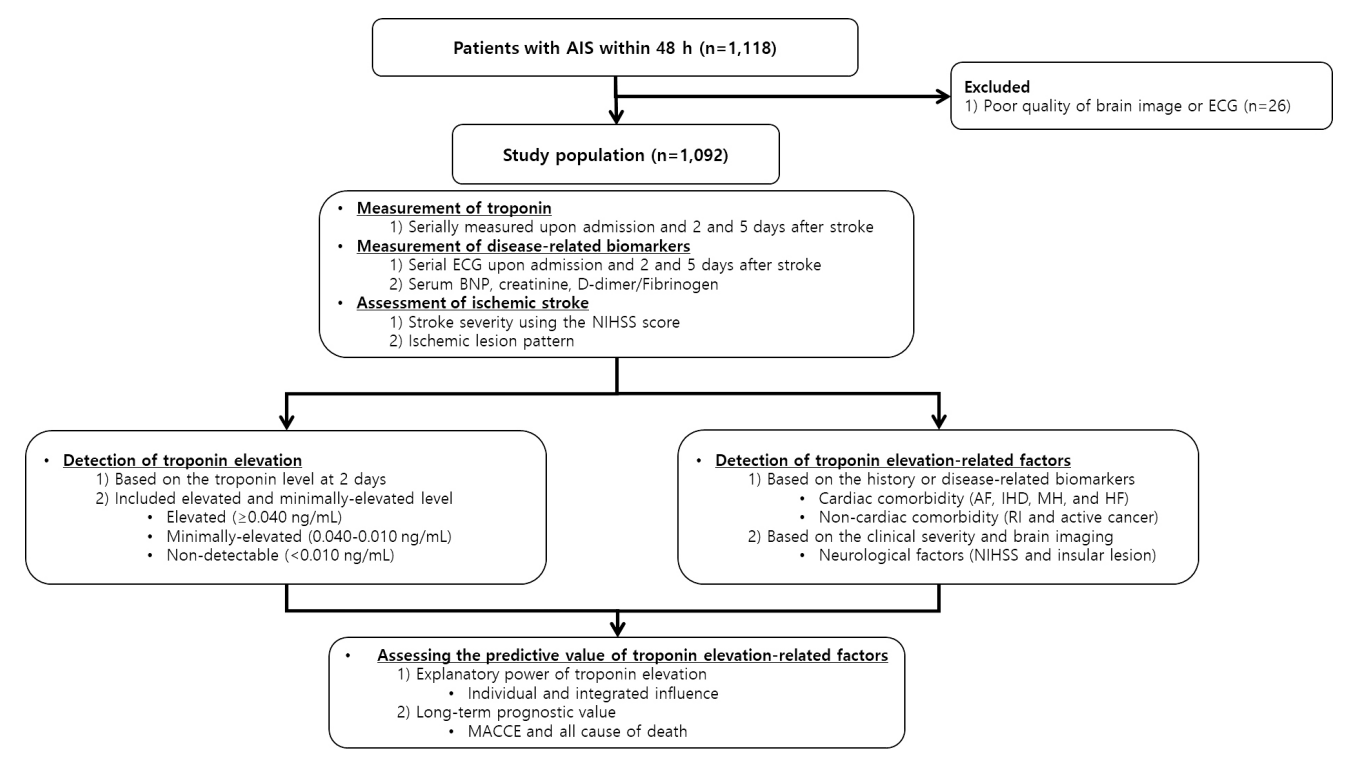
Figure 1.

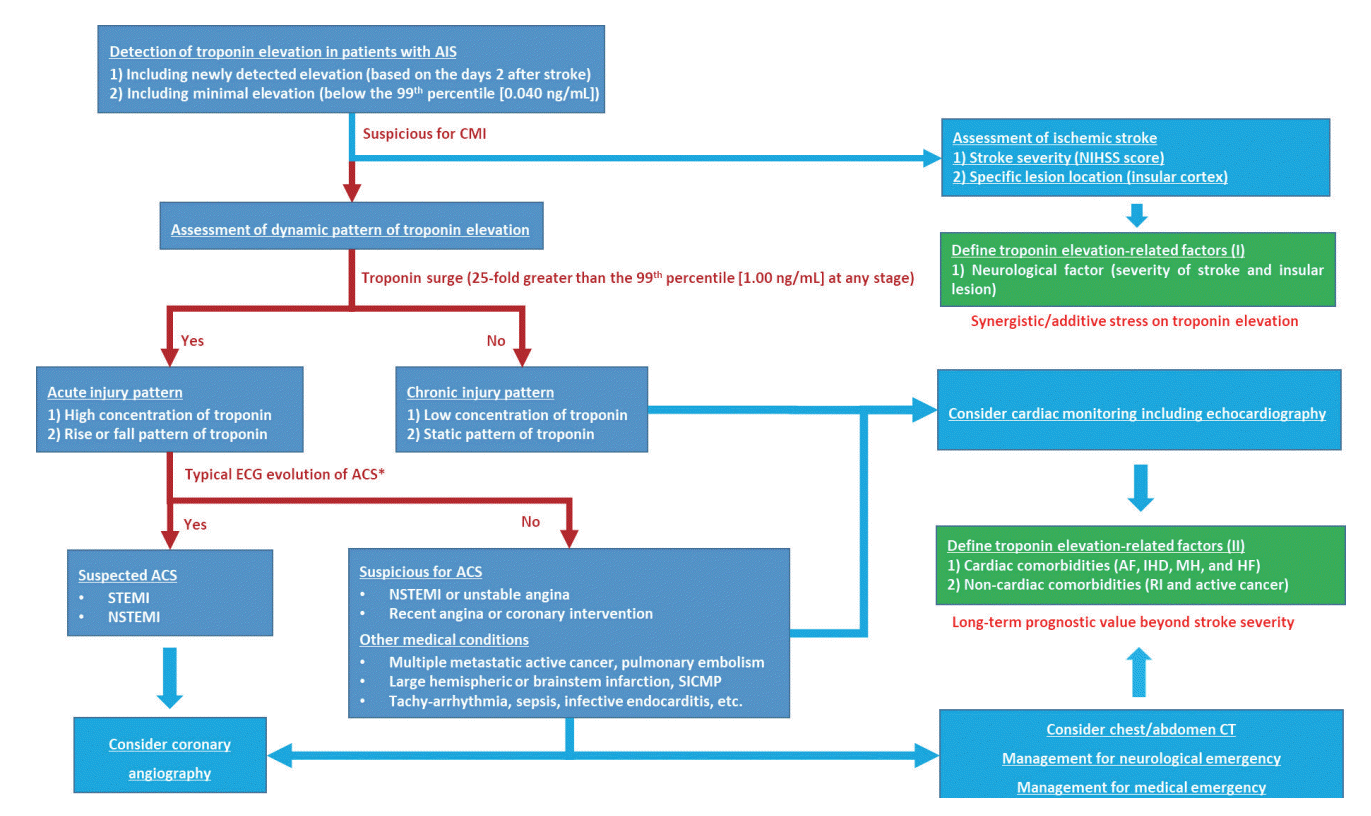
Figure 2.

Table 1.
| Variable |
Troponin level |
P-value* | |||
|---|---|---|---|---|---|
| Elevated (n=145) | Minimally-elevated (n=335) | Non-detectable (n=612) | |||
| Age (yr) | 71.8±12.1 | 70.3±11.7 | 63.2±11.8 | <0.01 | |
| Male | 84 (57.9) | 212 (63.3) | 395 (64.5) | 0.33 | |
| Conventional risk factors | |||||
| Hypertension | 109 (75.2) | 245 (73.1) | 388 (63.4) | <0.01 | |
| Diabetes mellitus | 58 (40.0) | 100 (29.9) | 180 (29.4) | 0.04 | |
| Hyperlipidemia | 86 (59.3) | 221 (66.0) | 407 (66.5) | 0.25 | |
| Current smoking | 34 (23.4) | 88 (26.3) | 209 (34.2) | <0.01 | |
| Preassigned comorbidities | |||||
| AF | 69 (47.6) | 120 (35.8) | 121 (19.8) | <0.01 | |
| IHD | 57 (39.3) | 100 (29.9) | 119 (19.4) | <0.01 | |
| MH | 47 (32.4) | 97 (29.0) | 117 (19.1) | <0.01 | |
| HF | 36 (24.8) | 37 (11.0) | 15 (2.5) | <0.01 | |
| RI | 59 (40.7) | 88 (26.3) | 69 (11.3) | <0.01 | |
| Active cancer | 23 (15.9) | 22 (6.6) | 28 (4.6) | <0.01 | |
| Neurological status | |||||
| NIHSS score | 8 [3, 14] | 4 [2, 8] | 3 [1, 6] | <0.01 | |
| Insular cortical lesions | 58 (40.0) | 71 (21.1) | 84 (13.7) | <0.01 | |
| Main laboratory findings | |||||
| White blood cell (×103/μL) | 9.1±3.7 | 8.2±3.0 | 7.9±2.6 | <0.01 | |
| Hemoglobin (g/dL) | 13.4±2.2 | 14.1±2.1 | 14.2±1.8 | <0.01 | |
| Platelet (×103/μL) | 202.9±92.4 | 218.9±76.9 | 232.6±60.8 | <0.01 | |
| Prothrombin time (international normalized ratio) | 1.1±0.3 | 1.1±1.0 | 1.0±0.8 | 0.43 | |
| Activated partial thromboplastin time (sec) | 27.4±5.4 | 26.8±3.2 | 26.8±3.5 | 0.22 | |
| Glucose (mg/dL) | 155.3±69.9 | 141.7±54.5 | 140.6±57.5 | 0.02 | |
| High-density lipoprotein (mg/dL) | 50.5±17.5 | 48.7±14.2 | 51.3±18.9 | 0.10 | |
| Low-density lipoprotein (mg/dL) | 98.1±50.1 | 104.3±39.3 | 114.8±39.4 | <0.01 | |
| Homocysteine (mmol/mL) | 19.3±8.5 | 18.2±7.5 | 17.5±7.1 | 0.03 | |
| C-reactive protein (mg/dL) | 1.5±4.1 | 0.6±1.6 | 0.4±1.4 | <0.01 | |
| Total bilirubin (mg/dL) | 0.7±0.4 | 0.6±0.4 | 0.6±0.3 | <0.01 | |
| Albumin (g/dL) | 3.5±0.5 | 3.7±0.4 | 3.9±0.4 | <0.01 | |
| Total protein (g/dL) | 6.8±0.9 | 6.9±0.7 | 7.0±0.5 | <0.01 | |
| Reperfusion therapy | 45 (31.0) | 74 (22.1) | 125 (20.4) | 0.02 | |
Table 2.
| Variables |
For troponin elevation |
||||
|---|---|---|---|---|---|
|
Univariate |
Multivariate* |
||||
| OR | 95% CI | OR | 95% CI | ||
| Main variables | |||||
| AF | 2.64 | 2.05–3.40 | 1.41 | 1.05–1.89 | |
| IHD | 2.05 | 1.58–2.66 | 1.32 | 0.99–1.76 | |
| MH | 1.77 | 1.36–2.30 | 1.97 | 1.48–2.63 | |
| HF | 6.17 | 4.08–9.35 | 2.65 | 1.64–4.27 | |
| RI | 3.47 | 2.61–4.61 | 1.89 | 1.37–2.59 | |
| Active cancer | 2.60 | 1.65–4.11 | 1.92 | 1.17–3.14 | |
| NIHSS score | 1.10 | 1.08–1.12 | 1.05 | 1.02–1.07 | |
| Insular lesion | 2.62 | 1.97–3.50 | 1.34 | 0.94–1.91 | |
| Epidemiological information | |||||
| Age (yr) | 1.06 | 1.04–1.07 | 1.04 | 1.02–1.05 | |
| Male | 0.86 | 0.68–1.09 | N/A | ||
| Hypertension | 1.60 | 1.24–2.07 | N/A | ||
| Diabetes mellitus | 1.25 | 0.98–1.61 | N/A | ||
| Hyperlipidemia | 0.86 | 0.68–1.10 | N/A | ||
| Current smoking | 0.66 | 0.51–0.85 | N/A | ||
| Laboratory results | |||||
| White blood cell (×103/μL) | 1.08 | 1.04–1.13 | 1.10 | 1.05–1.16 | |
| Hemoglobin (g/dL) | 0.86 | 0.81–0.91 | N/A | ||
| Platelet (×103/μL) | 0.95 | 0.94–0.97 | 0.96 | 0.95–0.98 | |
| Prothrombin time (international normalized ratio) | 1.08 | 0.94–1.24 | N/A | ||
| Activated partial thromboplastin time (sec) | 1.02 | 0.99–1.05 | N/A | ||
| Glucose (10 mg/dL) | 1.02 | 1.00–1.04 | N/A | ||
| High-density lipoprotein (10 mg/dL) | 0.95 | 0.87–1.02 | N/A | ||
| Low-density lipoprotein (10 mg/dL) | 0.93 | 0.89–0.95 | N/A | ||
| Homocysteine (mmol/mL) | 1.02 | 1.00–1.04 | N/A | ||
| C-reactive protein (mg/dL) | 1.19 | 1.10–1.29 | N/A | ||
| Total bilirubin (mg/dL) | 1.59 | 1.16–2.19 | N/A | ||
| Albumin (g/dL) | 0.26 | 0.19–0.35 | 0.50 | 0.36–0.70 | |
| Total protein (g/dL) | 0.67 | 0.55–0.81 | N/A | ||
Table 3.
|
Models for prediction of elevated and minimally-elevated troponin levels |
Diff. | P-value* | Diff. | P-value* | Diff. | P-value* | |||
|---|---|---|---|---|---|---|---|---|---|
| Description | AUC | 95% CI | |||||||
| Model 1 | Six comorbidities | 0.715 | 0.684–0.745 | Ref. | |||||
| Model 2 | Eight factors | 0.729 | 0.698–0.759 | 0.014 | 0.06 | Ref. | |||
| Model 3 | Eight factors and four other determinants | 0.772 | 0.744–0.800 | 0.057 | <0.01 | 0.043 | <0.01 | Ref | |
| Model 4 | All variables (total of 27 variables) | 0.778 | 0.749–0.806 | 0.063 | <0.01 | 0.049 | <0.01 | 0.006 | 0.50 |
Model 1 included six comorbidities, such as AF, IHD, MH, HF, RI, and active cancer. Model 2 included the NIHSS score and insular cortical lesions in addition to the factors included in model 1. Model 3 included age, leukocyte count, and low-density lipoprotein and albumin levels in addition to the factors included in model 2. Model 4 included age, sex, conventional risk factors, and all laboratory results mentioned in Table 1.
AUC, area under the receiver operating characteristic curve; CI, confidence interval; Diff., difference; Ref., reference; AF, atrial fibrillation; IHD, ischemic heart disease; MH, myocardial hypertrophy; HF, heart failure; RI, renal impairment; NIHSS, National Institutes of Health Stroke Scale.
* Comparing the AUC of paired data using the method by DeLong et al. [27].
Table 4.
| Variable |
Unadjusted |
Adjusted* |
||
|---|---|---|---|---|
| HR | 95% CI | HR | 95% CI | |
| AF | ||||
| For MACCE | 2.10 | 1.57–2.83 | 1.49 | 1.05–2.10 |
| For all-cause of death | 1.99 | 1.41–2.81 | 1.29 | 0.85–1.95 |
| IHD | ||||
| For MACCE | 1.93 | 1.42–2.60 | 1.54 | 1.09–2.17 |
| For all-cause of death | 1.55 | 1.08–2.22 | 1.42 | 0.93–2.18 |
| MH | ||||
| For MACCE | 1.09 | 0.78–1.52 | 1.01 | 0.70–1.45 |
| For all-cause of death | 1.42 | 0.98–2.50 | 1.41 | 0.92–2.17 |
| HF | ||||
| For MACCE | 3.67 | 2.55–5.27 | 1.91 | 1.24–2.93 |
| For all-cause of death | 3.85 | 2.56–5.78 | 1.73 | 1.07–2.80 |
| RI | ||||
| For MACCE | 1.88 | 1.36–2.60 | 1.09 | 0.74–1.62 |
| For all-cause of death | 2.15 | 1.50–3.10 | 0.83 | 0.51–1.34 |
| Active cancer | ||||
| For MACCE | 1.62 | 0.97–2.71 | 1.43 | 0.80–2.57 |
| For all-cause death | 5.31 | 3.56–7.90 | 2.86 | 1.69–4.83 |
HR, hazard ratio; CI, confidence interval; AF, atrial fibrillation; MACCE, major adverse cardiac and cerebrovascular events; IHD, ischemic heart disease; MH, myocardial hypertrophy; HF, heart failure; RI, renal insufficiency.
* Adjustments were made for all clinically relevant variables in Table 1, along with the reference troponin value measured on day 2 after stroke onset.
Table 5.
| Variable |
Cardiac troponin I among eligible patients* |
P-value† | |||
|---|---|---|---|---|---|
| Elevated (n=25 of 60) | Minimally-elevated (n=58 of 159) | Non-detectable (n=59 of 395) | |||
| Age (yr) | 68.3±12.6 | 68.3±10.7 | 64.8±9.5 | 0.17 | |
| Male | 20 (80.0) | 42 (72.4) | 46 (78.0) | 0.69 | |
| IHD (history or positive ischemic-ECG) | 10 (40.0) | 24 (41.4) | 22 (37.3) | 0.90 | |
| Obstructive disease | 0.82 | ||||
| No CAD | 4 (16.0) | 11 (19.0) | 9 (15.3) | ||
| Non-obstructive CAD | 10 (40.0) | 20 (34.5) | 27 (45.8) | ||
| Obstructive CAD (>50% diameter stenosis) | 11 (44.0) | 27 (46.6) | 23 (39.0) | ||
| Number of CAD with >50% diameter stenosis | 0.67 | ||||
| No | 14 (56.0) | 31 (53.4) | 36 (61.0) | ||
| 1 or 2 | 6 (24.0) | 20 (34.5) | 17 (28.8) | ||
| 3 or left main disease | 5 (20.0) | 7 (12.1) | 6 (10.2) | ||
Variables are presented as means±standard deviations or as numbers (%).
CTA, computed tomography angiography; IHD, ischemic heart disease; ECG, electrocardiography; CAD, coronary arterial disease.


 PDF
PDF Citation
 Print
Print


 XML Download