Journal List > Cancer Res Treat > v.55(1) > 1516081060

Choi, Suh, Jung, Jung, Park, Jun, and Choi: Estimating Age-Specific Mean Sojourn Time of Breast Cancer and Sensitivity of Mammographic Screening by Breast Density among Korean Women

Abstract

Purpose

High breast cancer incidence and dense breast prevalence among women in forties are specific to Asian. This study examined the natural history of breast cancer among Korean women.

Materials and Methods

We applied a three-state Markov model (i.e., healthy, preclinical, and clinical state) to fit the natural history of breast cancer to data in the Korean National Cancer Screening Program. Breast cancer was ascertained by linkage to the Korean Central Cancer Registry. Disease-progression rates (i.e., transition rates between three states), mean sojourn time (MST) and mammographic sensitivity were estimated across 10-year age groups and levels of breast density determined by the Breast Imaging, Reporting and Data System.

Results

Overall prevalence of dense breast was 53.9%. Transition rate from healthy to preclinical state, indicating the preclinical incidence of breast cancer, was higher among women in forties (0.0019; 95% confidence interval [CI], 0.0017 to 0.0021) and fifties (0.0020; 95% CI, 0.0017 to 0.0022), than women in sixties (0.0014; 95% CI, 0.0012 to 0.0017). The MSTs, in which the tumor is asymptomatic but detectable by screening, were also fastest among younger age groups, estimated as 1.98 years (95% CI, 1.67 to 2.33), 2.49 years (95% CI, 1.92 to 3.22), and 3.07 years (95% CI, 2.11 to 4.46) for women in forties, fifties, and sixties, respectively. Having dense breasts increased the likelihood of the preclinical cancer risk (1.96 to 2.35 times) and decreased the duration of MST (1.53 to 2.02 times).

Conclusion

This study estimated Korean-specific natural history parameters of breast cancer that would be utilized for establishing optimal screening strategies in countries with higher dense breast prevalence.

Introduction

Breast cancer poses a major public health problem for women worldwide. Different patterns of incidence and mortality of breast cancer across countries have been explained by availability or accessibility of treatment or early detection program [1]. Previous studies demonstrated that the racial/ethnic differences are attributable in part to prevalence and effect of dense breast. Dense breast, referring over 50% composition of fibroglandular tissue in breast, is well-established risk factor of breast cancer [2]. In addition, dense breast plays a role of masking factor in screening and increases interval cancer rates [3]. The mechanisms of dense breast effect are closely interacting with age and menopausal status. Dense breast causes higher incidence of breast cancer and lower mammographic sensitivity among younger women, but the density gradually decreases as women age after menopause [4,5].
Mammographic screening is effective method to reduce breast cancer mortality, thus implemented regionally or nationally in many countries. However, the recommendation guidelines in terms of screening intervals or starting- and stopping-ages of screening eligibility are slightly different between Western and Asian countries. While the guidelines from Western countries were not targeted at women aged younger than 50 years [6], Asian guidelines specify earlier starting ages in 40 or 45 years due to a higher proportion of younger women with breast cancer [7,8]. These observations of higher breast cancer incidence among younger women constantly implicate the effect of dense breast.
The Korean National Cancer Screening Program (KNCSP) for breast cancer was launched in 2002 to provide biennial mammographic screening for women aged 40 years and older [1]. A recent paper demonstrated 22% breast cancer mortality reduction among screened women in the KNCSP for breast cancer in the current implementation strategy [9]. However, the screening frequencies and timing was not based on Korean-specific evidence. The optimal timing and frequencies need to be quantified by examining natural history of breast cancer. Moreover, examination of dense breast effect on breast cancer progression will provide helpful information on disease incidence and mammographic screening sensitivity under the implementation of KNCSP.
This study aimed to estimate natural history of breast cancer specific for Korean women by utilizing nationwide screening databases from the KNCSP. Also, we examined the effect of having dense breast on breast cancer risk as well as the sojourn time of preclinical breast cancer. In addition, we provided the recent information of prevalence dense breasts among Korea women based on the Breast Imaging, Reporting and Data System (BI-RADS). This study will enhance our understanding of natural history of breast cancer among women in countries with higher prevalence of dense breast and suggest the evidence for optimizing screening strategies.

Materials and Methods

1. A three-state Markov model

Given that the progression of breast cancer from disease-free to preclinical or clinical state is not directly observable, various modeling approaches have been developed [1012]. Markov-based models present its strength in simulating breast cancer progression by utilizing data directly from trials or organized screening programs [13,14]. In a screening setting, “disease-free/healthy state” is interpreted as state with non-detectable cancer, “preclinical state” with screen-detected cancer, and “clinical state” with interval cancer. The actual record of the screening results for a woman, whether showing negative, screen-detected cancer or interval cancer, determines the transition from one state to another. Although the transition from preclinical state (screen-detected cancer) to clinical state (interval cancer) is not observable in the screening database, but estimable by a likelihood function constructed by transition rates from healthy to preclinical state, and from healthy to clinical state [15].
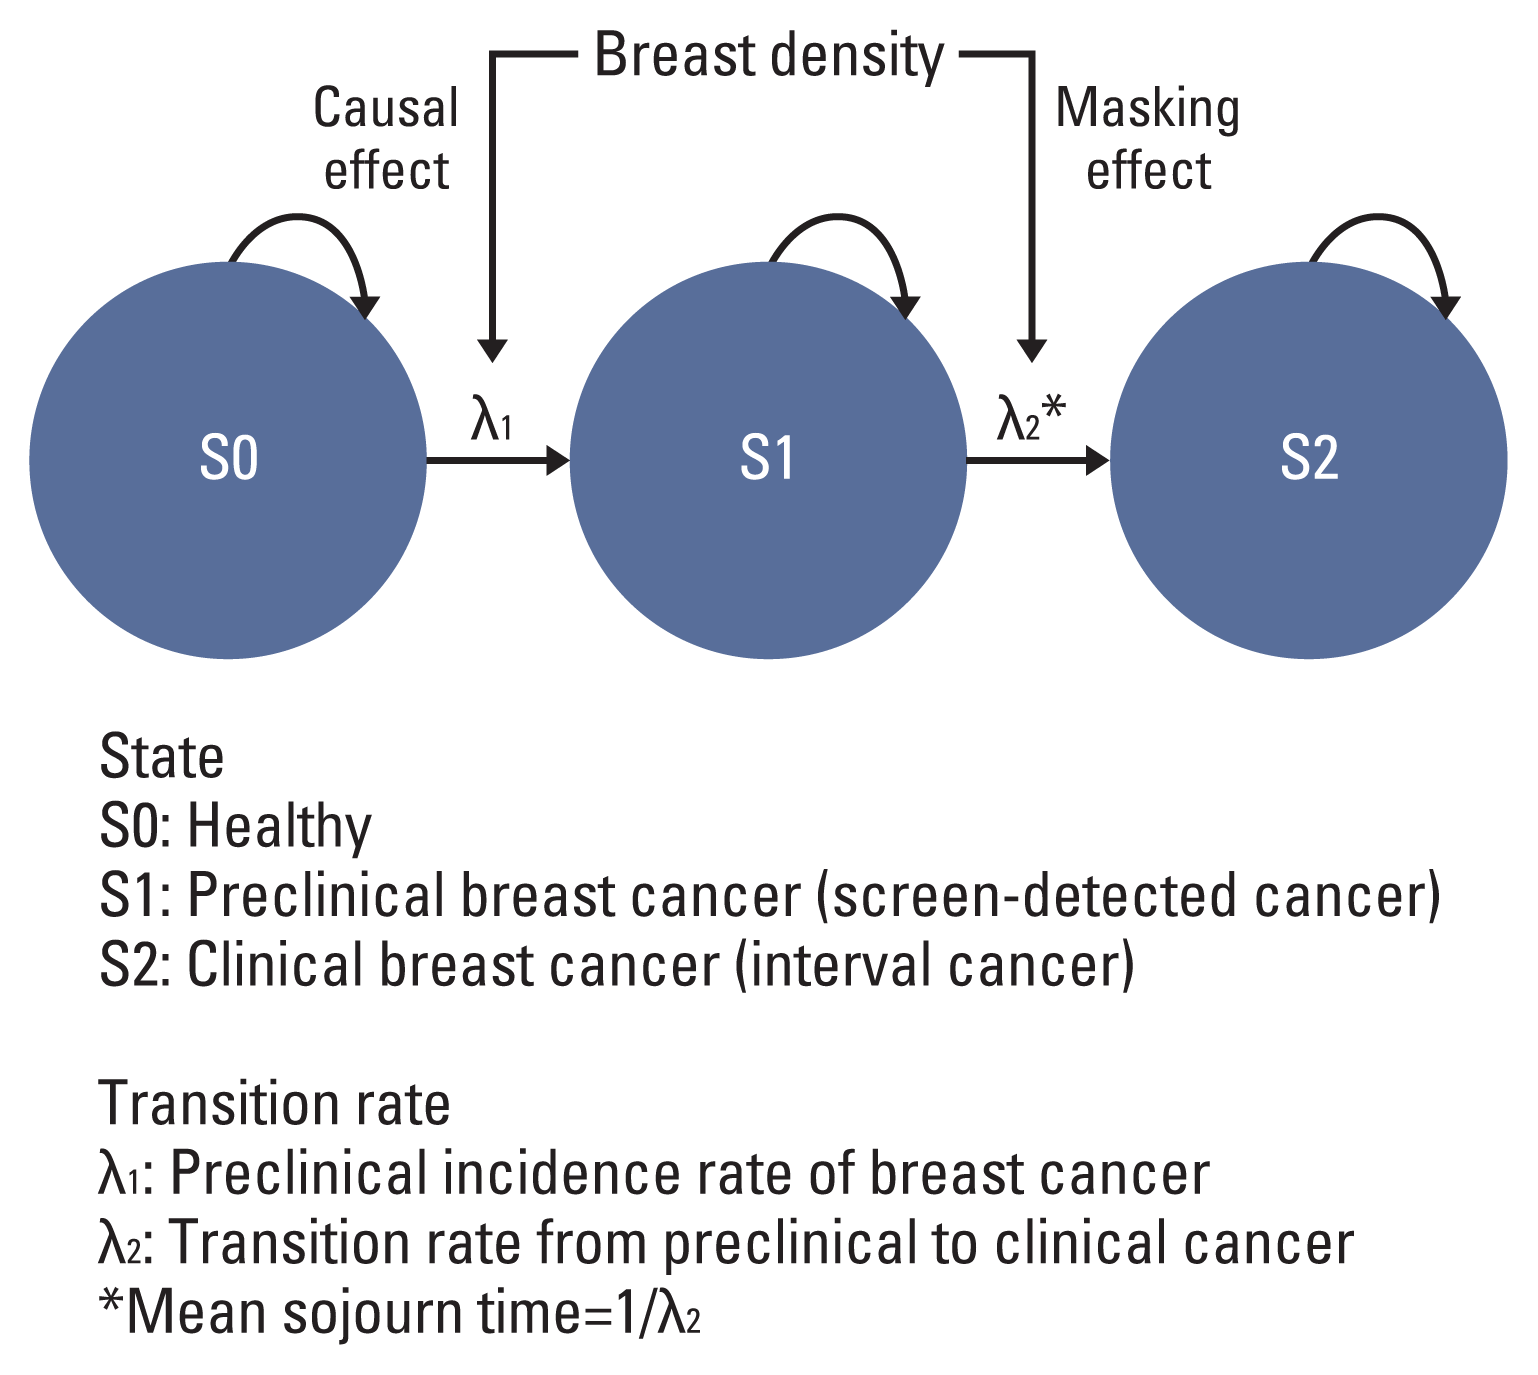
Therefore, we applied a three-state unidirectional progressive Markov model to fit healthy, preclinical and clinical state of breast cancer for individual women, by which three natural history parameters were simultaneously estimated: (1) transition rates, (2) mean sojourn time (MST) and (3) mammographic screening sensitivity. In Fig. 1, the λ1 and λ2 represent the transition rates from healthy to preclinical state, and from preclinical to clinical state, respectively. The λ1 describes the instantaneous rate at which a tumor progresses from healthy to preclinical state, reflecting the incidence level of breast cancer among a population. The λ2 refers the rate of preclinical tumor transitioning to clinical tumor, and the inversion of λ2 is MST, during which screening tests can make an earlier diagnosis of asymptomatic disease before symptom presentation. Another important parameter is sensitivity of the screening tests because false-positives or false-negatives are inevitable in a real-world screening program, and misclassification of false-negative results of preclinical cancer ultimately underestimates transition rate parameter in the model. Furthermore, sensitivity has a direct relationship with the MST, because improved test sensitivity creates a longer MST due to the higher probability of detecting disease in the preclinical state. Sensitivity also can be deteriorated due to various factors, such as high breast density, that defer the starting point when screening can detect the disease [16]. Therefore, we simultaneously estimated the sensitivity of mammographic screening tests by specifying a probability of false-negative results (one minus sensitivity) in the modeling procedure [15].

2. Study population

Since 2002, the KNCSP for breast cancer has provided biennial mammographic screening for all Korean women aged 40 years and older, and the BI-RADS information has been collected since 2009. To establish our baseline analytic population, we included cancer-free women who underwent KNCSP for breast cancer, for the first time in 2009. Women with incomplete screening results and BI-RADS were excluded, given the importance of the factors in modeling and small missing rates (< 2%). In addition, we obtained data only from tertiary hospitals (27.7% of total hospitals) where the quality-controlled screening data are available. The final study cohort comprised 290,448 women. Among them, 149,665 women attended second round of breast cancer screening in 2011, and 91,269 of the women attended all of the three rounds of biennial screening from 2009 to 2013.
By using unique 13-digit resident IDs, the Korean Central Cancer Registry (KCCR) was linked for the baseline study population in the KNCSP to ascertain cancer diagnosis. From the KCCR, we obtained information on initial primary breast cancer, 10th revision [ICD-10] codes (C50.0-C50.9, D05.0-D05.9), and date of diagnosis. Once a woman was diagnosed with breast cancer, she was considered as a case from then to the date of death or end of follow-up; multiple primary breast cancer including synchronous or metachronous bilateral breast cancer cases were not separately counted to estimate the natural history parameters in the current analysis. Women who obtained positive screening results and were diagnosed with breast cancer within 1 year from the screening attendance were considered as “screen-detected” cases (cancers detected in the preclinical state). To fully allow any diagnostic follow-up after obtaining the positive screening result, we considered the 1-year threshold to define screen-detected cases [17,18].
When cancer screening is first implemented in a country, detection rates are higher, than the rates in the following screening rounds, due to the detection of cases that were prevalent before the practice of screening started. So, breast cancers diagnosed within 3 weeks after women’s first screening in 2009 were excluded to eliminate the prevalent cases, satisfying the Markov assumption of a cancer-free cohort at the start of analysis. A 3-week exclusion period resulted in similar detection rates in the first screening round to the following (second and subsequent) screening rounds [13].

3. Statistical analysis

An analytical dataset was constructed using the full history of screening results and cancer diagnosis for each of the women. For each event of screening attendance or cancer diagnosis, women’s records were cumulated from the cohort enrollment on January 1, 2009, to the time of the event observation. Lastly, all records were sorted chronologically for each woman to fit the Markov model through the msm package in R [15]. Women aged 70 years and older were excluded in the modeling procedure due to small number of cases.
We investigated the effect of the BI-RADS on transition rates (λ1 and λ2) using a proportional hazards model. The BI-RADS system classifies breast tissues by percentage of fibroglandular densities at four levels: (1) predominantly fatty breast (0%–25% dense), (2) scattered fibroglandular densities (25%–50% dense), (3) heterogeneously dense (50%–75% dense), and (4) extremely dense (75%–100% dense). Those who have over 50% of fibroglandular densities are diagnosed as having dense breast tissues [2]. If having denser tissue increased the rate of transition from healthy to preclinical state, it was considered as higher density causally increasing breast cancer risk; if having denser breast made faster the rate of transition from preclinical state to clinical state, ultimately shortening the MST, then it was considered to have a masking effect in mammographic screening by lowering mammographic sensitivity [19].
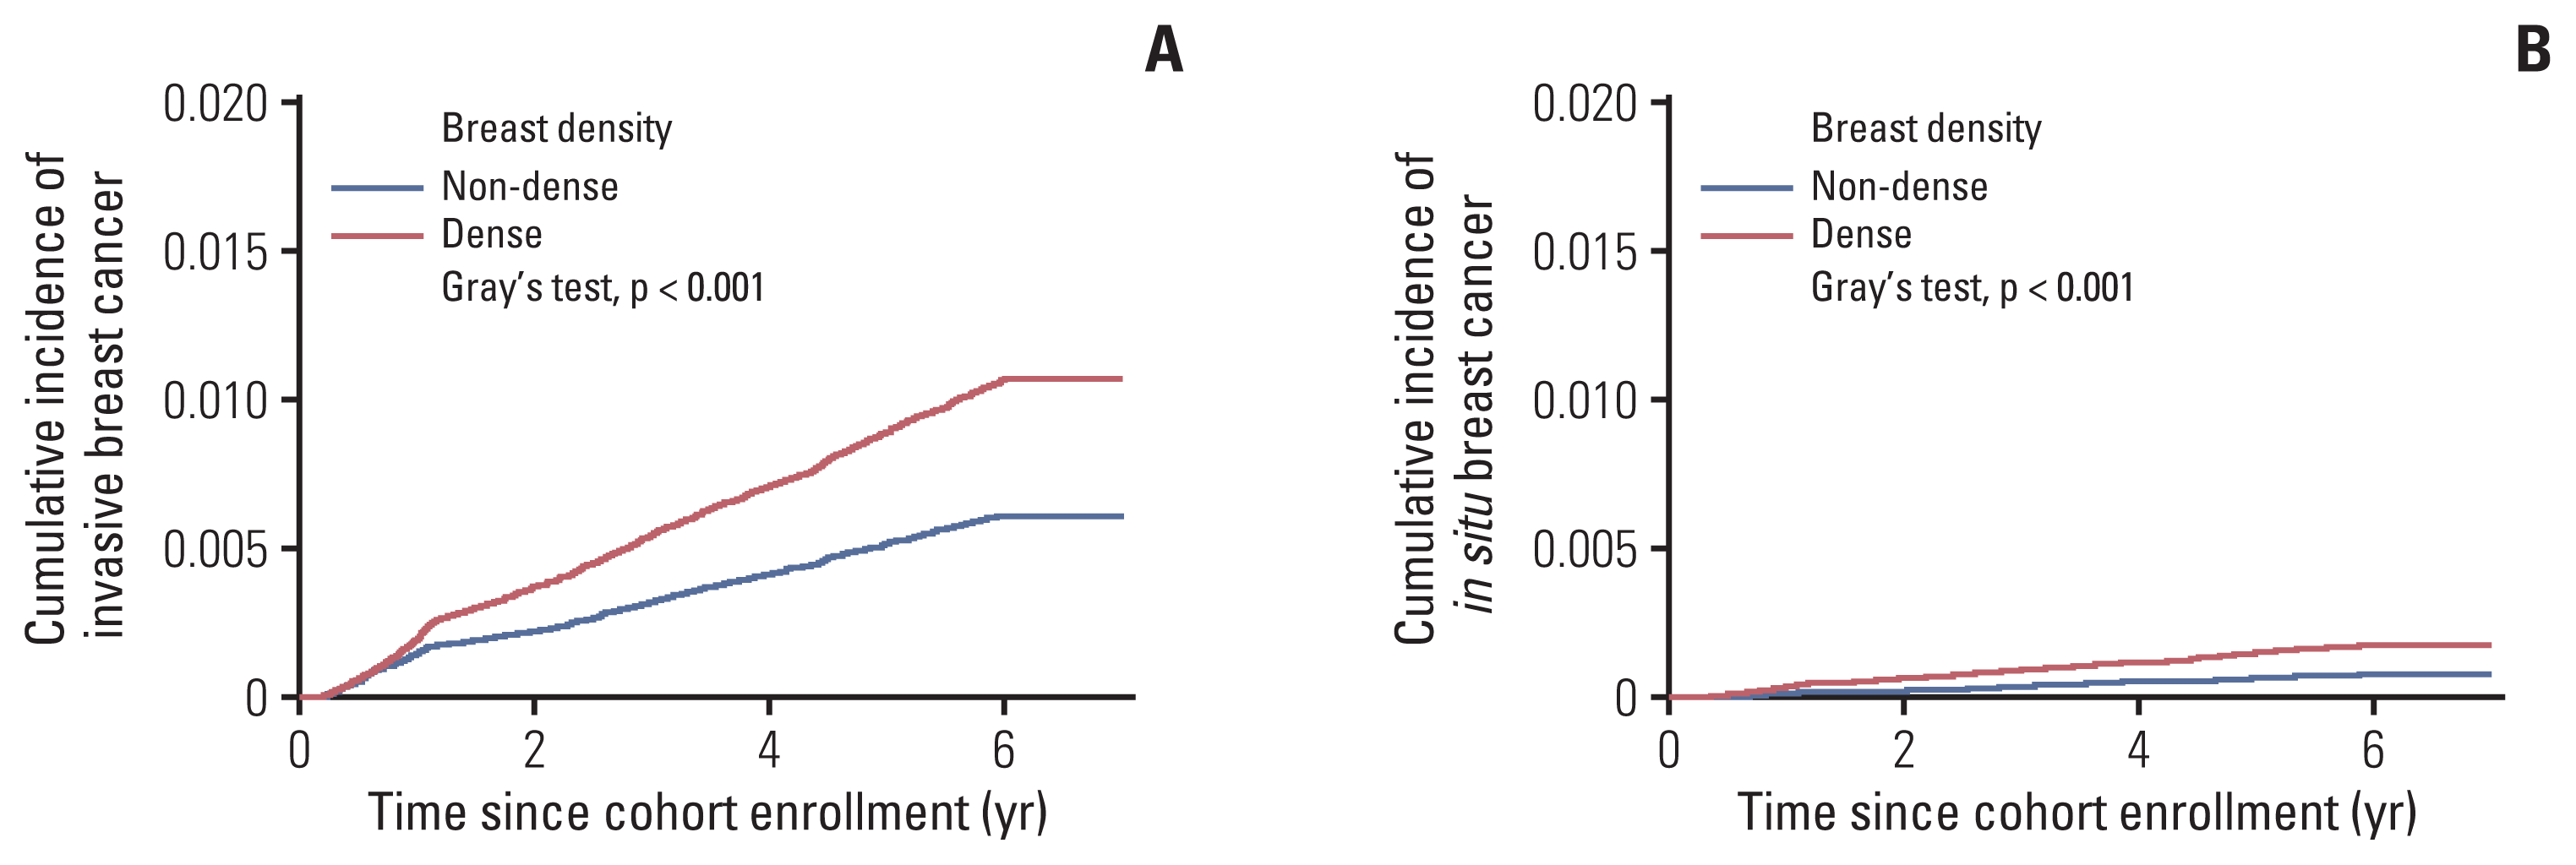
Cumulative incidence of breast cancer from the cohort enrollment on January 1, 2009, was estimated by density levels (non-dense vs. dense breast), and tested by Gray’s method [20].

Results

1. Breast density composition

Prevalence of dense breast among Korean women who participated in the KNCSP in 2009 were shown in Table 1. About half of Korean women (53.9%) had dense breast. Prevalence of dense breast were 72.4%, 45.9%, 21.7% and 9.2% for women in forties, fifties, sixties and seventies, respectively. Table 1 showed the number of interval cancers and screen-detected cancer according to women’s age groups and status of breast density, with the ratio from interval cancer to screen-detected cancer (I/S). In total, the I/S ratio was higher among women with dense breasts (0.64) compared to women with non-dense breasts (0.46). However, the higher I/S ratio was not detected among women aged 40–49 years, which might be caused by high recall rates reported among the corresponding age group (Table 1).
Cumulative incidence of invasive and in situ breast cancer was plotted respectively in Fig. 2. Women with dense breast tissues (i.e., > 50% of fibroglandular densities) had significantly higher levels of invasive and in situ breast cancer incidence.

2. Estimated parameters

Cases detected in the three rounds of screenings were summarized in Table 2, though which cases the natural history parameters were estimated. When examined by age groups, women aged 40–49 years indicated the highest number of breast cancers detectable at screening or within screening-intervals in all screening rounds. Women aged 70 years and older demonstrated the lowest incidence of breast cancer.
The rate of transition from healthy to preclinical state, λ1, was 0.0018 (95% confidence interval [CI], 0.0017 to 0.0019) for total women aged 40–69 years (Table 3). Compared with women in sixties, younger women in forties and fifties demonstrated higher rate transitioning from healthy to preclinical state, estimated to be 0.0019 (95% CI, 0.0017 to 0.0021) and 0.0020 (95% CI, 0.0017 to 0.0022), respectively. As the λ1 reflects the incidence level of breast cancer among a population, our results also align with the fact that younger women aged 45–54 years have the highest breast cancer incidence in Korea [21].
In Table 3, the MST, the inverse of λ2, was 2.39 years (95% CI, 2.09 to 2.74) among total women. Higher transition rate from preclinical to clinical state (λ2) among younger women generated shorter MST, 1.98 (95% CI, 1.67 to 2.34), 2.49 (95% CI, 1.93 to 3.23), and 3.07 (95% CI, 2.11 to 4.47) years for women aged 40–49, 50–59, and 60–69 years.
The sensitivity of the mammographic screening was estimated to be 0.67 (95% CI, 0.62 to 0.72) for total women, and to be higher among older women, shown as 0.70 (95% CI, 0.62 to 0.77), 0.65 (95% CI, 0.59 to 0.77), and 0.61 (95% CI, 0.54 to 0.61) for women in sixties, fifties and forties, respectively (Table 3).

3. Hazard of breast density on transition rates

Overall, having 2 to 4 levels of BI-RADS was significantly associated with 1.96 (95% CI, 1.57 to 2.43) to 2.33 (95% CI, 1.87 to 2.91) times accelerated transition from healthy to preclinical state, compared with women with level 1 BI-RADS (Table 3). According to women’s age groups, consistent results were shown that having higher levels of BI-RADS was associated with significantly greater risk of transition from healthy to preclinical state, confirming the role of risk factor of having dense breast (Table 3, Fig. 1).
Among the entire study cohort, women with heterogeneously dense tissue (level 3) and extremely dense tissue (level 4) showed 2.02 (95% CI, 1.33 to 3.07) and 1.94 (95% CI, 1.22 to 3.06) times higher hazard on transition to clinical cancer, compared to women with level 1 of BI-RADS. These observations are translated into the significantly shorter MSTs among women with heterogeneously dense breast (1.92 years; 95% CI, 1.64 to 2.27) and extremely dense breast (2.01 years; 95% CI, 1.62 to 2.50). Compared to the current biennial screening protocol from the KNCSP, women with predominantly fatty (level 1) and scattered fibroglandular tissues (level 2) have longer-than-2-year MSTs with 3.89 years (95% CI, 2.60 to 5.80) and 2.54 (95% CI, 2.05 to 3.15), respectively. However, transition from preclinical to clinical cancer was not significantly different by breast density levels among women aged 40–49 and 50–59 years in 10-year age-stratified analysis, thus showing overlapped confidence intervals in MSTs across four BI-RADS levels, indicating that breast density as a masking factor did not significantly shorten the MSTs (Table 3, Fig. 1). Moreover, the MSTs across all BI-RADS levels among women aged 40 to 59 years included 2-year threshold that the current KNCSP provides mammographic screening.
Women aged 60–69 years with extremely dense breast (level 4) had significantly higher hazard (2.133 [95% CI, 1.10 to 4.13]) of transitioning to clinical state, compared to those with predominantly fatty breast (level 1). The MSTs among women in sixties with non-dense breasts were 4.23 years (95% CI, 2.39 to 7.46) and 2.88 years (95% CI, 2.02 to 4.11), respectively for level 1 and level 2, which are longer than the current 2-year KNCSP protocol.
The values of MSTs for women with extremely dense breast tissue were estimated as 2.17 (95% CI, 1.67 to 2.82), 1.71 (95% CI, 1.10 to 2.67) and 1.34 years (95% CI, 0.64 to 2.80) for women in their 40s, 50s, and 60s, but the MSTs for older women were modeled by the small number of cancer cases and showed the widest range of confidence intervals (Table 3).

Discussion

Prevalence of dense breasts was higher among Korean women (53.9%), compared to Western women (24%–43%) [19,22]. We estimated the natural history parameters of the progression trajectory of breast cancer by using the nationwide cancer screening databases in the KNCSP. Overall, women aged 40–69 years had 2.39 years on average during which preclinical breast cancer develops into symptomatic cancer. Compared to women aged 60–69 years, women aged 40–59 years showed significantly higher breast cancer risk. Women with denser breast also presented with higher breast cancer risk in overall and 10-year age-stratified analysis, identifying dense breasts as a significant risk factor for breast cancer through our natural history modeling design. Though younger women tended to have shorter MSTs that reflected faster clinical presentation of breast cancer, the MSTs were not significantly different from the MST among women in sixties. Moreover, the hazard of having dense breasts on transition to clinical cancer was not significant in the age-stratified analysis, showing that dense breast as masking factor did not substantially reduce mammographic screening sensitivity.
Natural history modeling for breast cancer has been conducted in various Western countries and presenting specific MSTs by each country [13,2325]. A few studies presented the MST values for women aged under 50 years, ranging from 1.71 to 2.46 years [2325]. The MSTs from previous studies were slightly longer than our estimation, but the results from HIP trials are similar to our estimation at around 1.71 years [24]. However, the analyses of HIP trials were problematic in that they manipulated continuous variables into categorical variables. Chen et al. [26] estimated the MST for Taiwanese women by using Markov models without interval cancer information, providing 1.99-year MST for women aged 35 to 80 years. Their MST seemed to be shorter than our estimates, because they only included high risk women for breast cancer. Compared with the MSTs from other observational studies for women aged 50 to 69 years from the Netherlands, Finland, and Canada, ranging from 2.02 to 7.00 years [16,27,28], our results were far shorter, possibly due to different prevalence of dense breasts.
Declines in breast density with increasing age are well reported. Burton et al. [5], demonstrated that even after adjusting the menopausal status, the age-breast density association was still significant. Therefore, we estimated the effect of dense breast in 10-year age-stratified analysis. Through our modeling study, dense breast was confirmed as a significant risk factor for breast cancer in the age-stratified analysis, inducing 1.36 to 3.59 times higher likelihood of preclinical cancer risk. This result is in line with a previous meta-analysis that reported 2.21 times higher risk of breast cancer among women with dense breast [29]. Thus, intensive surveillance or follow-up for women with dense breast might guarantee the benefit from early-detection and reduce burden of the disease. In contrast, we did not detect significant effect of breast density in the MSTs and screening sensitivity when we stratified the analysis by 10-year age groups. Previous studies for the masking effect reported the 78% of breast cancers that were masked by dense breast [30], as well as an increase of interval cancer incidence among women with dense breast [3]. Only when we targeted total women aged 40–69 years, we observed the lowered sensitivity and shorter MSTs by levels of breast density, but after age-stratification, the masking effect by breast density might be smaller than expected. Still, the lowered sensitivity and shorter MSTs were obvious among younger women, who tend to have higher density, thus proper follow-up or supplemental screening need to be considered. In Korea, the compulsory indication of breast density was supplemented in the report of the KNCSP screening result from 2009 onward. However, no supplemental screening with ultrasonography is systematically referred for women with dense breast tissues. Moreover, the follow-up ultrasonography is not covered by the KNCSP. Further strategies to make informed decision should be addressed at a national level.
Several modeling methods have been utilized to quantify sojourn time. The parametric method is one of the simpler models for estimating MSTs, utilizing only breast cancer prevalence and incidence data [10,11]. The parametric methods derive incidence and prevalence data of the disease with assumption of a specific distribution of sojourn time to estimate the MST. However, the method has been criticized due to its too constrained and underestimated screening intervals, occurred by the use of incidence data only [16]. In Korea, Lee et al. [31] adopted a derivative method from the parametric model to obtain the optimal screening intervals directly, suggesting 1.2–1.6, 1.0–1.6, and 1.8–1.9 years for women aged 40 to 49, 50 to 59, and 60 years and older, respectively. Because the parametric method used only incidence data in the estimation procedure, the estimated MSTs were shorter than those in our results from the Markov models. Furthermore, they utilized breast cancer incidence data from the 2002 KCCR, whereas our study applied KCCR data from 2009 through 2014, creating the discrepancies between the estimated MSTs.
To our knowledge, the present study is the first attempt as of Korea and Asian countries to use individualized data in the nationwide screening databases to fit natural history of breast cancer together with the risk of breast density, based on the Markov model. Information of breast density was collected through screening results by radiologists which increased the accuracy of the information. Our analyses were based on the “real-world” data from organized screening programs for the entire population of Korean women. Our study presents the evidence for policy suggestions regarding screening intervals in the KNCSP for breast cancer. Although the MSTs from majority of Korean women falls under the current biennial window of mammographic screening protocol, the biennial mammography might be frequent than desired, especially for women in sixties with non-dense breasts.
Our study is not without limitations. Changes in breast density levels were not allowed in our model, although breast density is generally lowered as women age. We condensed our data with only tertiary hospitals to obtain stable estimates. In the analyses of entire data in the KNCSP databases (data not shown), having dense breast extended the duration of MSTs among women in forties, which is counterintuitive because the effect of dense breast reduces mammographic sensitivity and thus shortens the sojourn time of preclinical state. We might find the reasons from extremely higher recall rates for younger women with dense breast tissue from several screening centers. Although results from tertiary hospitals are generally accepted as high-quality data, not all tertiary hospitals in Korea are well-controlled for the screening quality [17]. If the quality of screening could be maintained at ideal levels, the values of MSTs would be more consistent and longer, thereby leading to improved efficiency of implementation achieved through fewer but more accurate screenings. Although Markov model showed good performance estimating the time sojourning in preclinical cancer state [13,14], the model is too simplified to capture the continual growth of breast tumor. Future studies based on microsimulation that incorporates genetic, environmental and behavioral risk factors are required to estimate the tumor characteristics (i.e., natural history of the disease) as well as to evaluate the cost-effectiveness of various screening scenarios. Lastly, we were not able to adjust the key factors, including epidemiologic or genetic influences, or confounders known to be associated with breast cancer risk due to the lack of data in the KNCSP. Given that the further adjustment for known risk factors or confounders (such as, personal history of breast disease or family history) did not significantly impact the estimation of natural history parameters [13,19], the age- and breast density-specific estimation in the current study based on individual-level information at nationwide screening database is still robust and generalizable for women in Korea. Although women in most Asian countries share similar characteristics of dense breasts, our results still need to be cautiously extrapolated for women in other countries given the different genetic or environmental characteristics.
This study presents Korean-women-specific estimates of the natural history parameters for breast cancer, by using “real-world” nationwide data in the KNCSP. The current biennial screening practice might need to continue for women aged 40 to 59 years as well as women in sixties with dense breast tissue. For older women with non-dense breasts, a prolonged interval could be recommended, creating more convenience for participants and less waste of resources, while still providing effective early detection of new cancer cases. This study first suggests the natural history parameters of breast cancer for women in countries with high prevalence of dense breasts.

Notes

Ethical Statement

Written informed consent was obtained from participants in the Korean National Cancer Screening Program (KNCSP) for the collection of screening results; the requirement for informed consent for the current study was waived owing to the use of de-identified data. With permission from the Ministry of Health and Welfare, the investigators used data maintained and de-identified by the NHIS. This study was approved by the Institutional Review Board of the National Cancer Center, Korea (IRB No. NCCNCS08129).

Author Contributions

Conceived and designed the analysis: Choi E, Suh M, Jung SY, Park S, Jun JK, Choi KS.

Contributed data or analysis tools: Choi E, Suh M, Jung KW, Jun JK, Choi KS.

Performed the analysis: Choi E.

Wrote the paper: Choi E, Choi KS.

Writing - original draft: Choi E.

Review and editing: Choi E, Suh M, Jung SY, Jung KW, Park S, Jun JK, Choi KS.

Supervision: Choi KS.

Conflicts of Interest

Conflict of interest relevant to this article was not reported.

Acknowledgments

This study was supported by a Grant-in-Aid for Cancer Research and Control from the National Cancer Center of Korea (1910231-1). The funders had no role in the study design, analysis, interpretation, and preparation of the manuscript. All researchers retained complete independence in the conduct of this study.

References

1. Choi E, Lee YY, Yoon HJ, Lee S, Suh M, Park B, et al. Relationship between cancer worry and stages of adoption for breast cancer screening among Korean women. PLoS One. 2015; 10:e0132351.
crossref
2. McCormack VA, dos Santos Silva I. Breast density and parenchymal patterns as markers of breast cancer risk: a meta-analysis. Cancer Epidemiol Biomarkers Prev. 2006; 15:1159–69.
crossref
3. Boyd NF, Guo H, Martin LJ, Sun L, Stone J, Fishell E, et al. Mammographic density and the risk and detection of breast cancer. N Engl J Med. 2007; 356:227–36.
crossref
4. Park B, Cho HM, Lee EH, Song S, Suh M, Choi KS, et al. Does breast density measured through population-based screening independently increase breast cancer risk in Asian females? Clin Epidemiol. 2018; 10:61–70.
crossref
5. Burton A, Maskarinec G, Perez-Gomez B, Vachon C, Miao H, Lajous M, et al. Mammographic density and ageing: a collaborative pooled analysis of cross-sectional data from 22 countries worldwide. PLoS Med. 2017; 14:e1002335.
crossref
6. Siu AL. U. S. Preventive Services Task Force. Screening for breast cancer: U.S. Preventive Services Task Force recommendation statement. Ann Intern Med. 2016; 164:279–96.
crossref
7. Japanese Research Group for the Development of Breast Cancer Screening Guidelines. Hamashima C, Hamashima CC, Hattori M, Honjo S, Kasahara Y, et al. The Japanese guidelines for breast cancer screening. Jpn J Clin Oncol. 2016; 46:482–92.
crossref
8. Yen AM, Tsau HS, Fann JC, Chen SL, Chiu SY, Lee YC, et al. Population-based breast cancer screening with risk-based and universal mammography screening compared with clinical breast examination: a propensity score analysis of 1429890 Taiwanese women. JAMA Oncol. 2016; 2:915–21.
crossref
9. Choi E, Jun JK, Suh M, Jung KW, Park B, Lee K, et al. Effectiveness of the Korean National Cancer Screening Program in reducing breast cancer mortality. NPJ Breast Cancer. 2021; 7:83.
crossref
10. Day NE, Walter SD. Simplified models of screening for chronic disease: estimation procedures from mass screening programmes. Biometrics. 1984; 40:1–14.
crossref
11. Paci E, Duffy SW. Modelling the analysis of breast cancer screening programmes: sensitivity, lead time and predictive value in the Florence District Programme (1975–1986). Int J Epidemiol. 1991; 20:852–8.
crossref
12. Duffy SW, Chen HH, Tabar L, Day NE. Estimation of mean sojourn time in breast cancer screening using a Markov chain model of both entry to and exit from the preclinical detectable phase. Stat Med. 1995; 14:1531–43.
crossref
13. Taghipour S, Banjevic D, Miller AB, Montgomery N, Jardine AK, Harvey BJ. Parameter estimates for invasive breast cancer progression in the Canadian National Breast Screening Study. Br J Cancer. 2013; 108:542–8.
crossref
14. Tan KH, Simonella L, Wee HL, Roellin A, Lim YW, Lim WY, et al. Quantifying the natural history of breast cancer. Br J Cancer. 2013; 109:2035–43.
crossref
15. Jackson CH. Multi-state models for panel data: the msm package for R. J Stat Sofw. 2011; 38:1–29.
16. Aarts A, Duffy SW, Geurts S, Vulkan DP, Otten J, Hsu CY, et al. Test sensitivity of mammography and mean sojourn time over 40 years of breast cancer screening in Nijmegen (The Netherlands). J Med Screen. 2019; 26:147–53.
crossref
17. Lee EH, Kim KW, Kim YJ, Shin DR, Park YM, Lim HS, et al. Performance of screening mammography: a report of the alliance for breast cancer screening in Korea. Korean J Radiol. 2016; 17:489–96.
crossref
18. Ryu JE, Choi E, Lee K, Jun JK, Suh M, Jung KW, et al. Trends in the performance of the Korean National Cancer Screening Program for gastric cancer from 2007 to 2016. Cancer Res Treat. 2022; 54:842–9.
19. Chiu SY, Duffy S, Yen AM, Tabar L, Smith RA, Chen HH. Effect of baseline breast density on breast cancer incidence, stage, mortality, and screening parameters: 25-year follow-up of a Swedish mammographic screening. Cancer Epidemiol Biomarkers Prev. 2010; 19:1219–28.
20. Gray RJ. A class of K-sample tests for comparing the cumulative incidence of a competing risk. Ann Stat. 1988; 16:1141–54.
21. Hong S, Won YJ, Park YR, Jung KW, Kong HJ, Lee ES, et al. Cancer statistics in Korea: incidence, mortality, survival, and prevalence in 2017. Cancer Res Treat. 2020; 52:335–50.
22. Melnikow J, Fenton JJ, Whitlock EP, Miglioretti DL, Weyrich MS, Thompson JH, et al. Supplemental screening for breast cancer in women with dense breasts: a systematic review for the U.S. Preventive Services Task Force. Ann Intern Med. 2016; 164:268–78.
23. Duffy SW, Chen HH, Tabar L, Fagerberg G, Paci E. Sojourn time, sensitivity and positive predictive value of mammography screening for breast cancer in women aged 40–49. Int J Epidemiol. 1996; 25:1139–45.
24. Duffy SW, Day NE, Tabar L, Chen HH, Smith TC. Markov models of breast tumor progression: some age-specific results. J Natl Cancer Inst Monogr. 1997; (22):93–7.
crossref
25. Walter SD, Day NE. Estimation of the duration of a pre-clinical disease state using screening data. Am J Epidemiol. 1983; 118:865–86.
crossref
26. Chen TH, Kuo HS, Yen MF, Lai MS, Tabar L, Duffy SW. Estimation of sojourn time in chronic disease screening without data on interval cases. Biometrics. 2000; 56:167–72.
crossref
27. Jiang H, Walter SD, Brown PE, Chiarelli AM. Estimation of screening sensitivity and sojourn time from an organized screening program. Cancer Epidemiol. 2016; 44:178–85.
28. Wu JC, Hakama M, Anttila A, Yen AM, Malila N, Sarkeala T, et al. Estimation of natural history parameters of breast cancer based on non-randomized organized screening data: subsidiary analysis of effects of inter-screening interval, sensitivity, and attendance rate on reduction of advanced cancer. Breast Cancer Res Treat. 2010; 122:553–66.
29. Bae JM, Kim EH. Breast density and risk of breast cancer in Asian women: a meta-analysis of observational studies. J Prev Med Public Health. 2016; 49:367–75.
30. Wanders JO, Holland K, Veldhuis WB, Mann RM, Pijnappel RM, Peeters PH, et al. Volumetric breast density affects performance of digital screening mammography. Breast Cancer Res Treat. 2017; 162:95–103.
31. Lee SY, Jeong SH, Kim J, Jung SH, Song KB, Nam CM. Scheduling mammography screening for the early detection of breast cancer in Korean women. J Med Screen. 2007; 14:205–9.

Fig. 1
A three-state Markov model of natural history of breast cancer and effects of breast density.
crt-2021-962f1.gif
Fig. 2
Cumulative incidence of breast cancer by breast density levels. Cumulative incidence of invasive breast cancer (A) and in situ breast cancer (B) from the time of cohort enrollment.
crt-2021-962f2.gif
Table 1
Prevalence of dense breast and the ratio of interval cancer to screen-detected cancer
Age group (yr) Total % of density Dense breast Non-dense breast


No. screened Interval cancer Screen-detected cancer I/S ratioa) No. screened Interval cancer Screen-detected cancer I/S ratioa) No. screened Interval cancer Screen-detected cancer I/S ratioa)
Total 290,448 451 782 0.58 53.86 156,445 315 492 0.64 134,003 136 290 0.46

40–49 153,124 272 401 0.68 72.44 110,916 215 321 0.67 42,208 57 80 0.71

50–59 75,424 127 233 0.55 45.94 34,651 83 128 0.65 40,773 44 105 0.42

60–69 41,551 44 111 0.40 21.70 9,017 17 36 0.47 32,534 27 75 0.36

≥ 70 20,349 8 37 0.22 9.15 1,861 0 7 0.00 18,488 8 30 0.27

a) I/S ratio, interval cancer/screen-detected cancer.

Table 2
Breast cancer cases from screen-detected cancer and interval cancer by screening rounds
Screening rounds Screen-detected Interval cancer


Invasive In situ Invasive In situ
Prevalence screen (2009)

 Total 337 71 219 26

 40–49 150 44 125 13

 50–59 109 23 67 8

 60–69 55 1 22 5

 ≥ 70 23 3 5 0

First incident screen (2011)

 Total 193 37 114 16

 40–49 104 22 72 11

 50–59 56 9 31 3

 60–69 26 5 9 2

 ≥ 70 7 1 2 0

Second incident screen (2013)

 Total 120 24 63 13

 40–49 70 11 42 9

 50–59 27 9 15 3

 60–69 20 4 5 1

 ≥ 70 3 0 1 0
Table 3
Parameters of the three-state Markov model for all breast cancers
Three-state Markov model for all breast cancers Total 40–49 50–59 60–69
Preclinical incidence rate (λ1) 0.0018 (0.0017–0.0019) 0.0019 (0.0017–0.0021) 0.0020 (0.0017–0.0022) 0.0014 (0.0012–0.0017)
Mean sojourn time (1/λ 2 ) 2.3940 (2.0918–2.7398) 1.9772 (1.6707–2.3399) 2.4936 (1.9252–3.2299) 3.0717 (2.1126–4.4662)
Sensitivity of test 0.67 (0.62–0.72) 0.61 (0.54–0.61) 0.65 (0.59–0.77) 0.70 (0.62–0.77)
Hazard ratio by BI-RADS levels a) to transition rate
 Transition from healthy to preclinical (λ1)
  Level 2 vs. Level 1 1.9625 (1.5799–2.4370) 1.3655 (0.9185–2.0300) 1.9400 (1.3390–2.8110) 1.9601 (1.5891–2.4170)
  Level 3 vs. Level 1 2.3510 (1.9200–2.8780) 1.7721 (1.2311–2.5500) 2.6324 (1.8417–3.7620) 2.2083 (1.7236–2.8290)
  Level 4 vs. Level 1 2.3380 (1.8760–2.9140) 1.9122 (1.3223–2.7640) 2.3875 (1.5545–3.6650) 3.5950 (2.4920–5.1850)
 Transition from preclinical to clinical (λ2)
  Level 2 vs. Level 1 1.5285 (0.9915–2.3550) 2.0632 (0.8106–5.2510) 1.3981 (0.5712–3.4220) 1.4073 (0.9266–2.1380)
  Level 3 vs. Level 1 2.0230 (1.3340–3.0680) 1.9771 (0.8162–4.7900) 1.9442 (0.8094–4.6690) 1.5950 (0.9891–2.5720)
  Level 4 vs. Level 1 1.9360 (1.2240–3.0630) 1.6214 (0.6538–4.0170) 2.2383 (0.8626–5.8080) 2.1330 (1.1020–4.1270)
Mean sojourn time by BI-RADS levels a)
 Predominantly fatty 3.8923 (2.6077–5.8097) 3.5241 (1.5046–8.2538) 3.8394 (1.6505–8.9313) 4.2303 (2.3965–7.4623)
 Scattered fibroglandular 2.5473 (2.0584–3.1524) 1.7082 (1.2330–2.3666) 2.7463 (1.9118–3.9451) 2.8843 (2.0214–4.1155)
 Heterogeneously dense 1.9237 (1.6312–2.2686) 1.7823 (1.4272–2.2257) 1.9750 (1.4883–2.6208) 1.9665 (1.2572–3.0760)
 Extremely dense 2.0100 (1.6187–2.4960) 2.1745 (1.6745–2.8239) 1.7153 (1.1002–2.6742) 1.3408 (0.6412–2.8038)

a) Breast Imaging, Reporting and Data System (BI-RADS) density system; level 1 (0%–24%): predominantly fatty breasts; level 2 (25%–50%): scattered fibroglandular tissues; level 3 (51%–75%): heterogeneously dense; level 4 (76%–100%): extremely dense.

TOOLS
Similar articles