Abstract
Purpose
Materials and Methods
Results
Conclusion
Electronic Supplementary Material
Notes
Ethical Statement
This work was approved by the Institutional Review Board of Seoul National University Hospital (No. 1906-154-1044) and Seoul Metropolitan Government Seoul National University Boramae Medical Center (No. 10-2021-86) and carried out according to the principles of the Declaration of Helsinki. Informed consent was waived by the committee due to the retrospective and anonymized nature of the study.
Author Contributions
Conceived and designed the analysis: Kim BH, Kim HJ.
Collected the data: Kim BH, Chung JH, Son J.
Contributed data or analysis tools: Kim BH, Chung JH, Son J, Kim S, Wu HG, Kim HJ.
Performed the analysis: Kim BH, Chung JH, Son J, Kim S, Wu HG, Kim HJ.
Wrote the paper: Kim BH, Kim HJ.
References
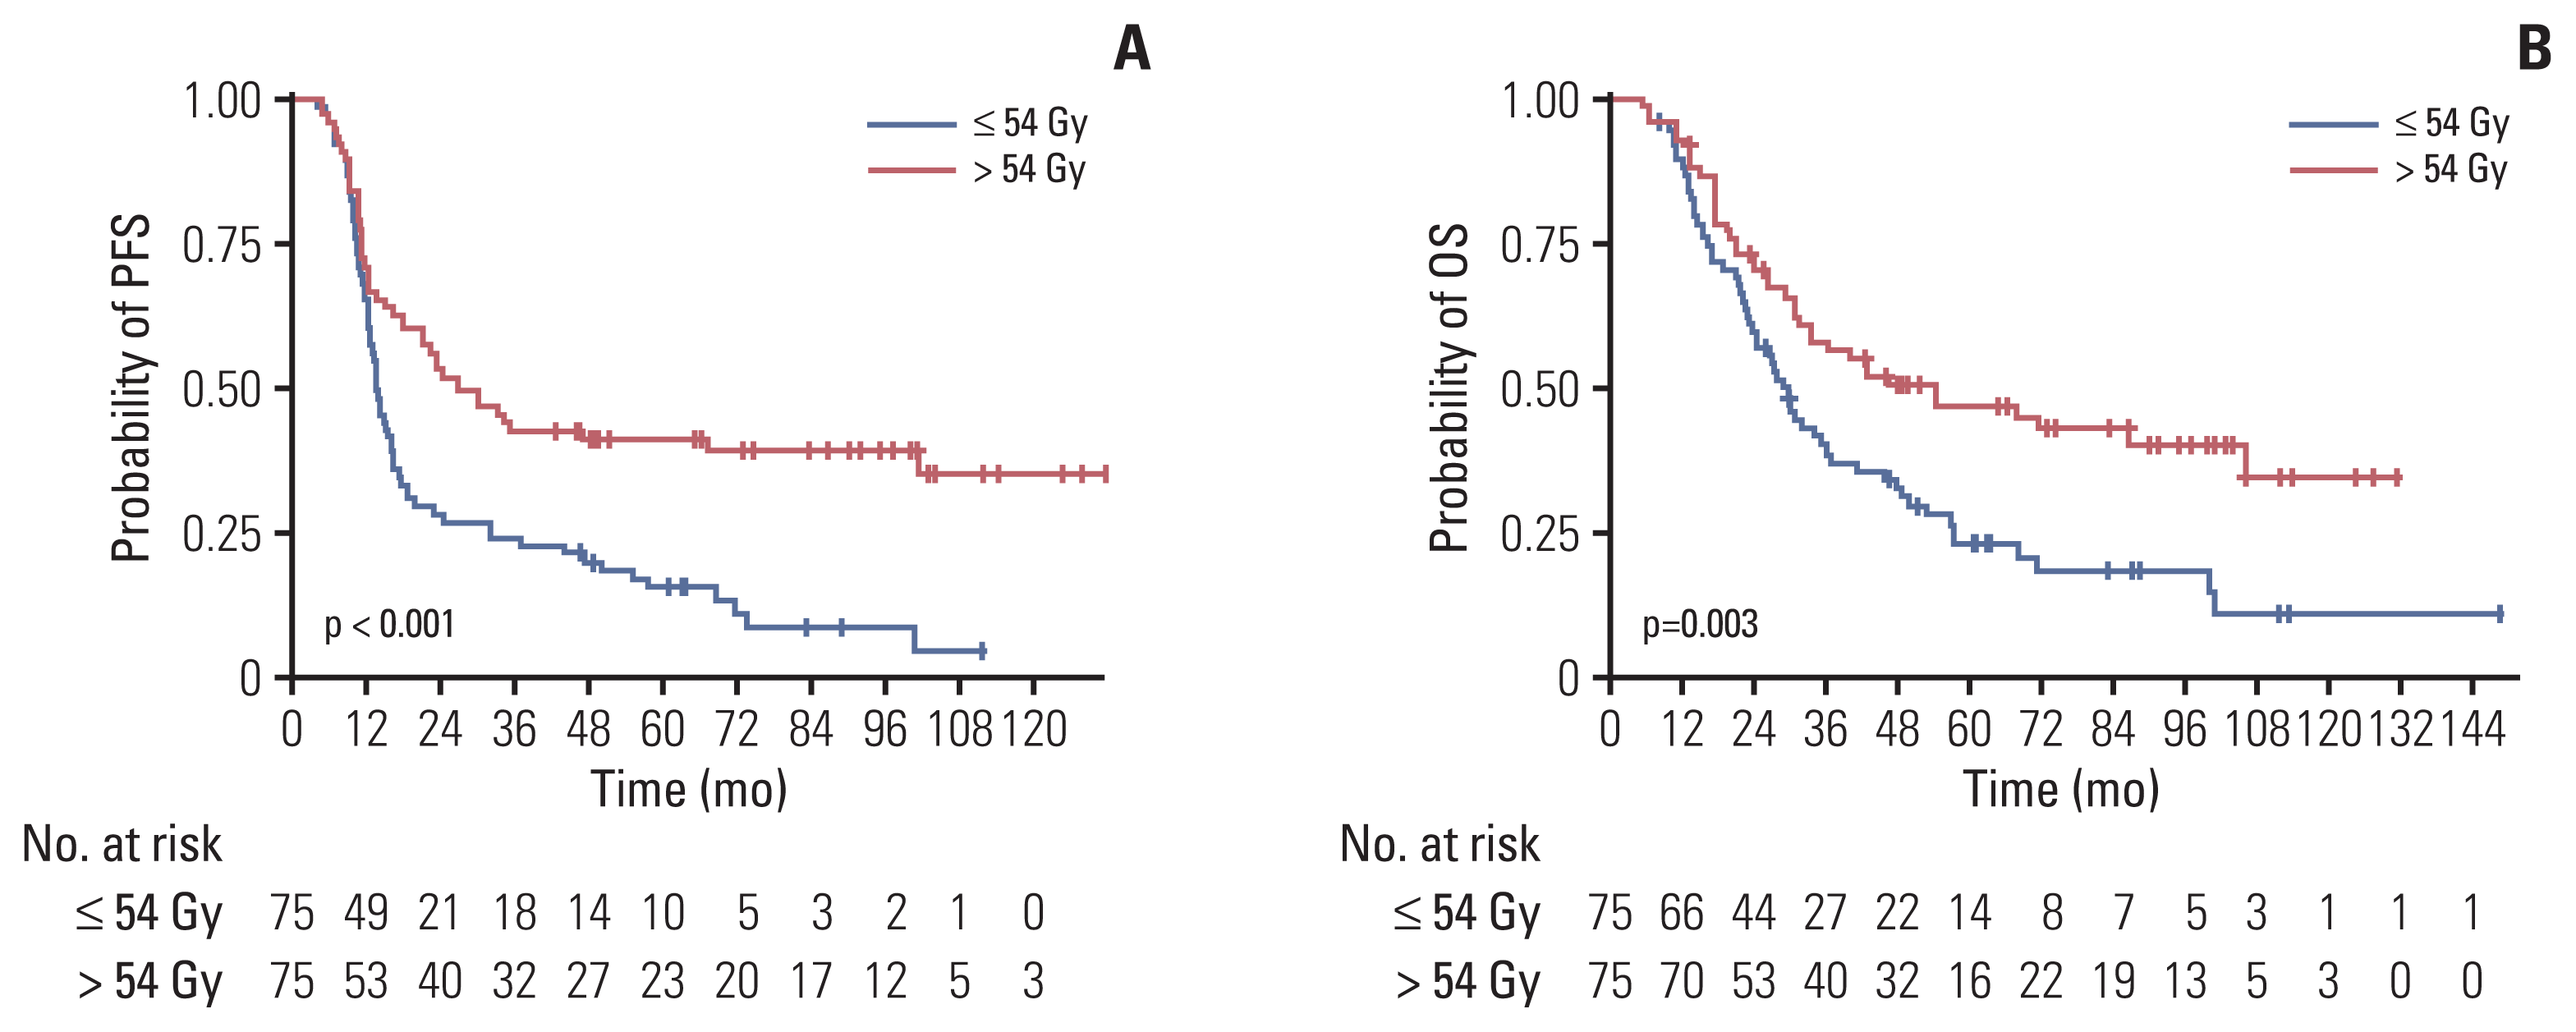
Fig. 1

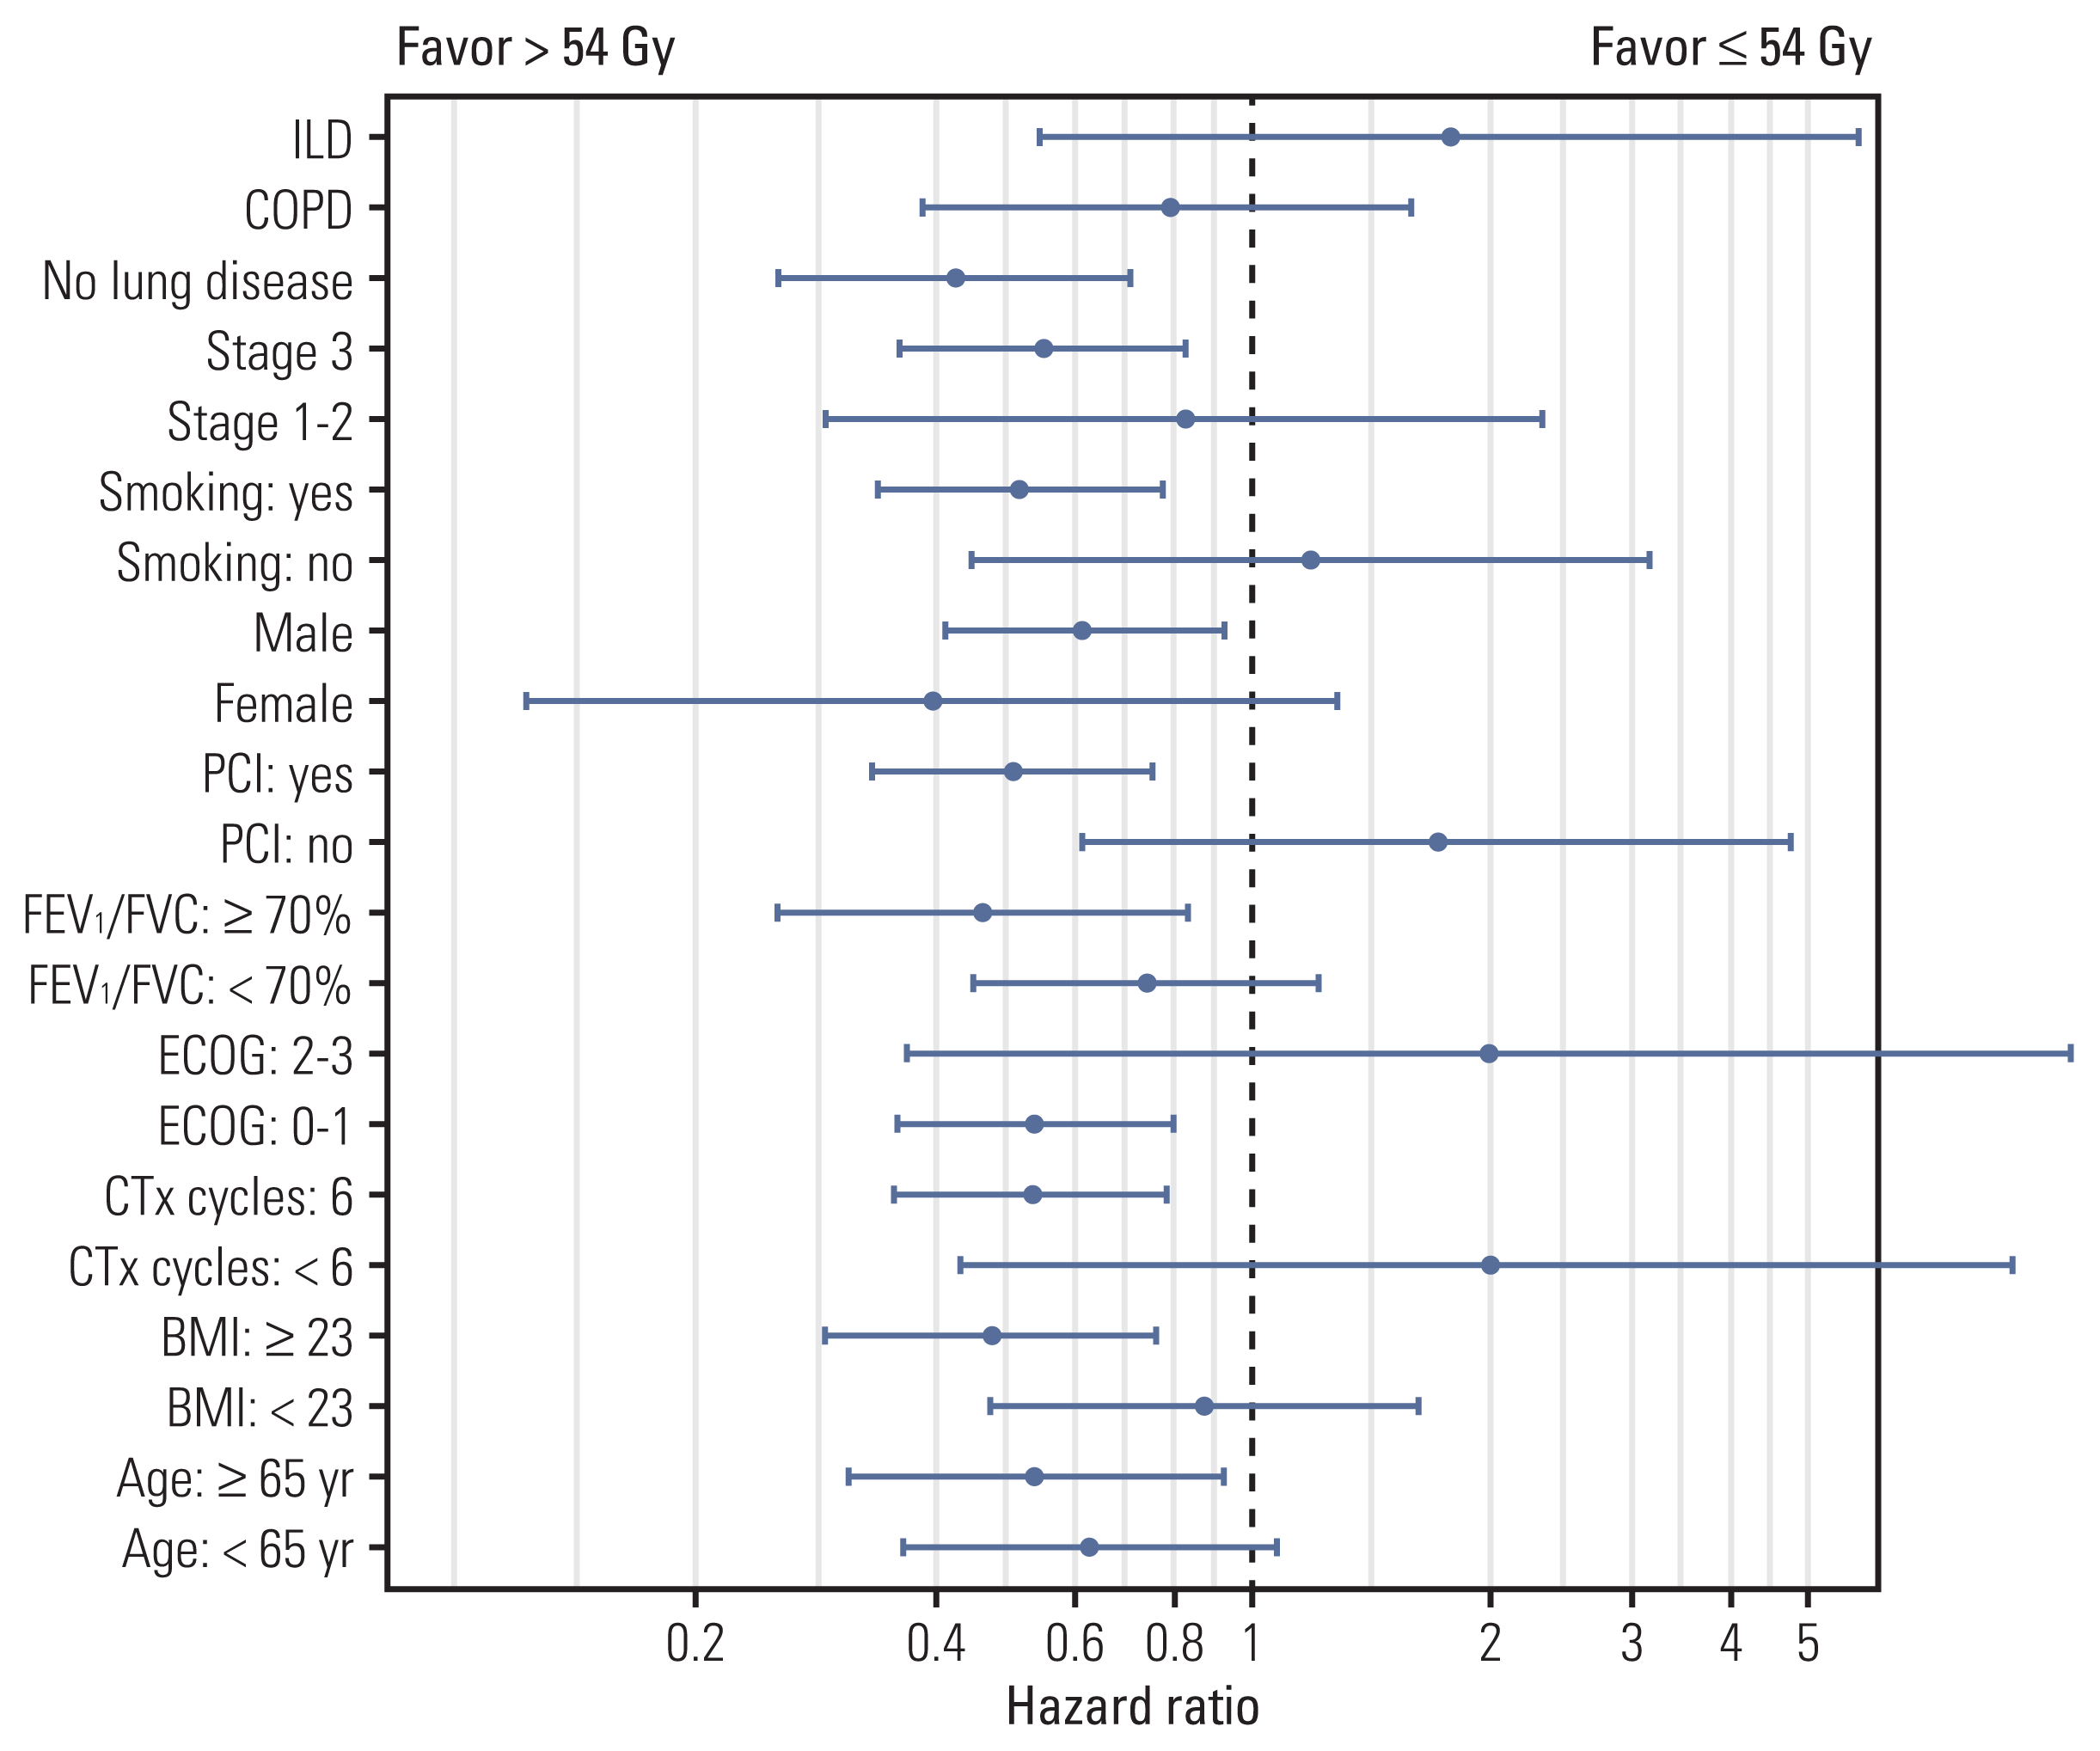
Fig. 2

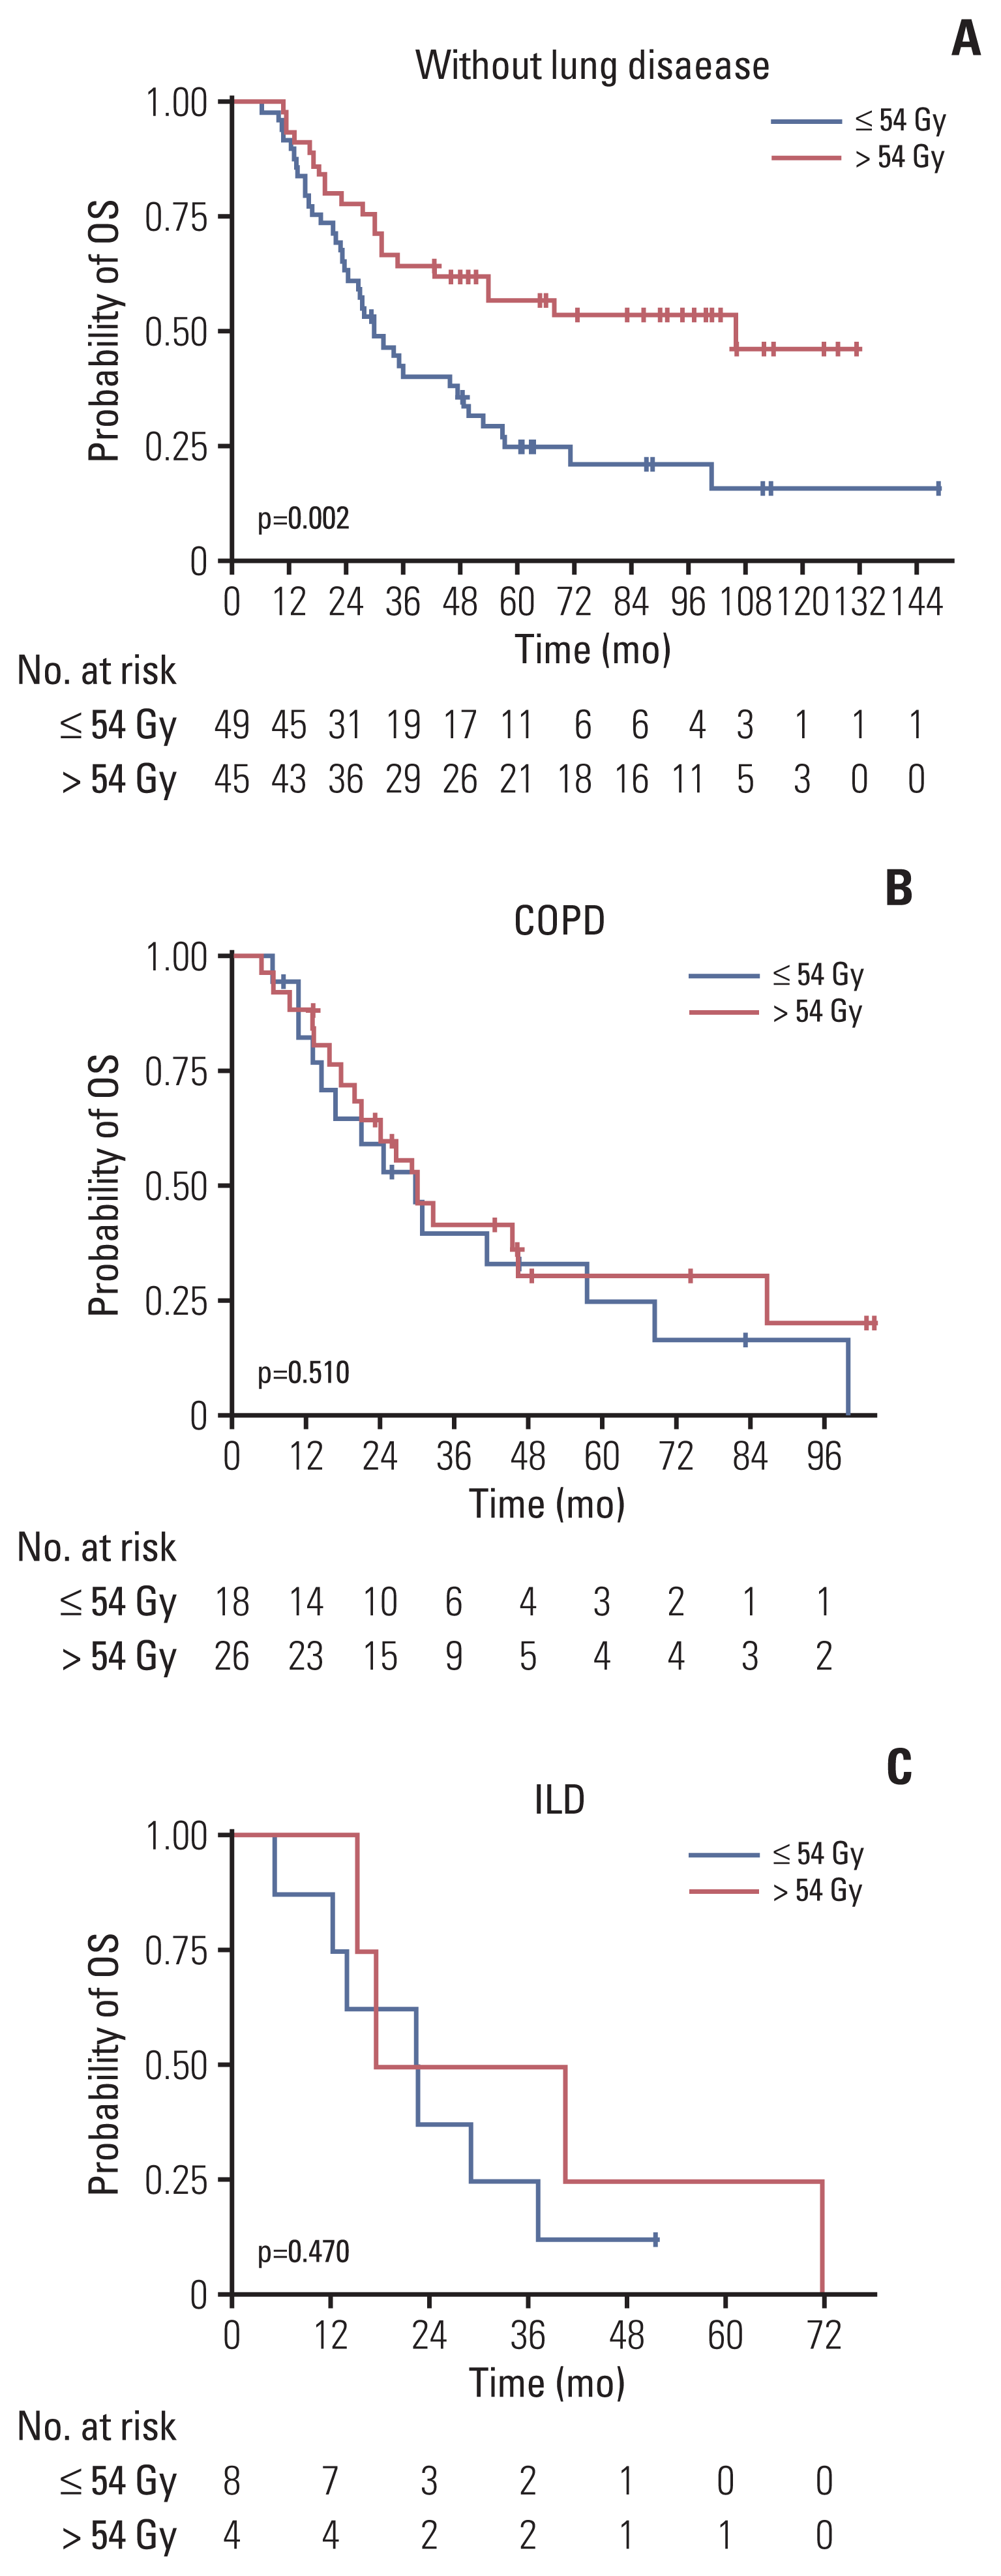
Fig. 3

Table 1
| Characteristic | No. of patients (%) | p-valuea) | |
|---|---|---|---|
| RT ≤ 54 Gy (n=141) | RT > 54 Gy (n=84) | ||
| Follow-up duration (mo) | 30.3 (18.4–55.0) | 36.6 (19.1–73.1) | 0.480 |
| Year of treatment | |||
| 2004–2012 | 84 (59.6) | 35 (41.7) | 0.014 |
| 2013–2017 | 57 (40.4) | 49 (58.3) | |
| Age (yr) | |||
| < 65 | 75 (53.2) | 43 (51.2) | 0.879 |
| ≥ 65 | 66 (46.8) | 41 (48.8) | |
| Sex | |||
| Female | 29 (20.6) | 9 (10.7) | 0.085 |
| Male | 112 (79.4) | 75 (89.3) | |
| Performance status (ECOG) | |||
| 0 | 36 (25.5) | 16 (19.0) | 0.296 |
| 1 | 99 (70.2) | 61 (72.6) | |
| 2 | 6 (4.3) | 6 (7.1) | |
| 3 | 0 | 1 (1.2) | |
| Height (cm) | 164.1±8.0 | 165.1±7.5 | 0.341 |
| Body weight at diagnosis (kg) | 64.2±10.3 | 65.8±10.0 | 0.256 |
| Smoking history | |||
| No | 32 (22.7) | 13 (15.5) | 0.255 |
| Yes | 109 (77.3) | 71 (84.5) | |
| T category | |||
| 1 | 46 (32.6) | 28 (33.3) | 0.998 |
| 2 | 41 (29.1) | 25 (29.8) | |
| 3 | 21 (14.9) | 12 (14.3) | |
| 4 | 33 (23.4) | 19 (22.6) | |
| N category | |||
| 0 | 16 (11.3) | 15 (17.9) | 0.129 |
| 1 | 14 (9.9) | 14 (16.7) | |
| 2 | 79 (56.0) | 43 (51.2) | |
| 3 | 32 (22.7) | 12 (14.3) | |
| Overall stage | |||
| I | 9 (6.4) | 9 (10.7) | 0.300 |
| II | 16 (11.3) | 13 (15.5) | |
| III | 116 (82.3) | 62 (73.8) | |
| Underlying lung disease | |||
| None | 104 (73.8) | 48 (57.1) | 0.020 |
| COPD | 29 (20.6) | 31 (36.9) | |
| ILD | 8 (5.7) | 5 (6.0) | |
| FEV 1 (L) | 2.3±0.6 | 2.3±0.6 | 0.631 |
| FEV 1 /FVC (%) | 67.6±9.9 | 74.5±60.7 | 0.314 |
| DLCO (%) | 88.3±18.6 | 89.1±18.6 | 0.775 |
| FEV 1 (L) | |||
| < 2 | 47 (35.1) | 22 (26.5) | 0.243 |
| ≥ 2 | 87 (64.9) | 61 (73.5) | |
| DLCO (%) | |||
| < 80 | 39 (35.5) | 22 (29.7) | 0.516 |
| ≥ 80 | 71 (64.5) | 52 (70.3) | |
| NSE before treatment (mg/dL) | 36.0±37.3 | 33.2±27.5 | 0.551 |
| Chemotherapy cycles | |||
| < 6 | 11 (7.8) | 12 (14.3) | 0.185 |
| 6 | 130 (92.2) | 72 (85.7) | |
| RT techniques | |||
| 3D-CRT | 131 (92.9) | 73 (86.9) | 0.134 |
| IMRT | 10 (7.1) | 11 (13.1) | |
| PCI | |||
| Not done | 17 (12.1) | 16 (19.0) | 0.215 |
| Done | 124 (87.9) | 68 (81.0) | |
Values are presented as median (IQR), number (%), or mean±SD. 3D-CRT, three-dimensional conformal radiotherapy; COPD, chronic obstructive pulmonary disease; DLCO, carbon monoxide diffusion capacity; ECOG, Eastern Cooperative Oncology Group; FEV1, forced expiratory volume in 1 second; FVC, forced vital capacity; ILD, interstitial lung disease; IMRT, intensity-modulated radiotherapy; IQR, interquartile range; NSE, neuron specific enolase; PCI, prophylactic cranial irradiation; RT, radiotherapy; SD, standard deviation.
Table 2
BMI, body mass index; CI, confidence interval; CTx, chemotherapy; DLCO, carbon monoxide diffusion capacity; ECOG, Eastern Cooperative Oncology Group; FEV1, forced expiratory volume in 1 second; FVC, forced vital capacity; HR, hazard ratio; OS, overall survival; PCI, prophylactic cranial irradiation; PFS, progression-free survival; RT, radiotherapy.
Table 3
| Without lung disease | COPD | ILD | |||||||
|---|---|---|---|---|---|---|---|---|---|
|
|
|
|
|||||||
| ≤ 54 Gy (n=49) | > 54 Gy (n=45) | p-valuea) | ≤ 54 Gy (n=18) | > 54 Gy (n=26) | p-valuea) | ≤ 54 Gy (n=8) | > 54 Gy (n=4) | p-valuea) | |
| RTOG pulmonary toxicities | |||||||||
|
|
|||||||||
| No | 16 (32.7) | 16 (35.6) | 0.854 | 9 (50.0) | 9 (34.6) | 0.476 | 2 (25.0) | 1 (25.0) | 0.999 |
|
|
|||||||||
| Mild (grade 1–2) | 28 (57.1) | 26 (57.8) | 7 (38.9) | 15 (57.7) | 4 (50.0) | 2 (50.0) | |||
|
|
|||||||||
| Severe (grade 3 or more) | 5 (10.2) | 3 (6.7) | 2 (11.1) | 2 (7.7) | 2 (25.0) | 1 (25.0) | |||
|
|
|||||||||
| Planning target volume (cm 3 ) | 310.1±126.2 | 318.8±132.1 | 0.847 | 344.6±249.4 | 284.4±166.2 | 0.483 | 373.1±195.8 | 391.7±118.5 | 0.887 |
|
|
|||||||||
| Both lung V5 (%) | 50.8±13.6 | 56.6±13.6 | 0.176 | 42.1±14.0 | 48.1±19.1 | 0.462 | 58.3±12.1 | 70.3±2.4 | 0.092 |
|
|
|||||||||
| Both lung V20 (%) | 22.3±6.8 | 23.4±6.9 | 0.621 | 17.7±6.5 | 21.0±9.3 | 0.398 | 21.3±9.2 | 23.0±6.3 | 0.847 |
|
|
|||||||||
| Mean lung dose (Gy) | 12.5±3.3 | 13.0±3.4 | 0.584 | 10.8±3.7 | 11.3±4.4 | 0.807 | 13.4±2.9 | 13.5±2.9 | 0.995 |
|
|
|||||||||
| FEV 1 (L) | 2.3±0.6 | 2.3±0.7 | 0.936 | 2.4±0.5 | 2.3±0.6 | 0.590 | 2.0±0.7 | 2.3±0.4 | 0.100 |
|
|
|||||||||
| FEV 1 /FVC (%) | 67.4±10.7 | 70.4±7.9 | 0.134 | 63.1±10.2 | 63.2±10.1 | 0.988 | 67.0±7.0 | 72.0±3.6 | 0.132 |
|
|
|||||||||
| DLCO (%) | 89.7±16.8 | 89.7±17.3 | 0.996 | 83.6±18.8 | 89.8±16.7 | 0.306 | 82.7±21.7 | 90.0±30.5 | 0.366 |
Values are presented as number (%) or mean±SD. COPD, chronic obstructive pulmonary disease; DLCO, carbon monoxide diffusion capacity; FEV1, forced expiratory volume in 1 second; FVC, forced vital capacity; ILD, interstitial lung disease; RT, radiotherapy; RTOG, Radiation Therapy Oncology Group; SD, standard deviation.


 PDF
PDF Citation
 Print
Print


 XML Download