Abstract
Purpose
Nutritional markers, such as total protein, albumin, and vitamin D have been reportedly associated with neonatal outcomes. This study aimed to assess the correlation between nutritional markers at birth and the need for respiratory support on the first day of life.
Methods
This retrospective study included 94 newborns admitted to the neonatal intensive care unit of Kyungpook National University Children's Hospital between March and December 2017. We measured levels of nutritional markers, including serum total protein, albumin, ferritin, 25-hydroxyvitamin D (25-OHD), and prealbumin, from cord blood or blood sample within 24 hours after birth. Respiratory support was defined as the use of nasal continuous positive airway pressure, humidified high-flow nasal cannula, or mechanical ventilation on the first day of life.
Results
The mean gestational age and birth weight were 36.6±2.3 weeks and 2,714± 575 g, respectively. Serum total protein, albumin, prealbumin, and ferritin levels at birth were significantly correlated with gestational age and birth weight. Total protein, albumin, ferritin, and 25-OHD levels were not correlated with the time to recover birth weight after adjusting for gestational age. Moreover, prealbumin levels at birth were significantly lower in small-for-gestational-age infants than in appropriate-for-gestational-age infants. The need for respiratory support on the first day of life decreased 0.058- and 0.001-fold for every 1 g/dL increase in serum total protein (95% confidence interval [CI], 0.004 to 0.833; P=0.036) and albumin (95% CI, 0.000 to 0.136; P=0.009) levels, respectively.
Several markers, such as total protein, albumin, retinol-binding protein, insulin-like growth factor 1, prealbumin, and vitamin D, have been used as nutritional indicators [1-4]. Nutritional markers, including total protein, albumin, and vitamin D, are associated with neonatal mortality and other severe adverse outcomes [5-11].
In preterm infants, low plasma protein levels at birth have been associated with impaired cardiovascular function, including hypotension and abnormal renal blood flow, and abnormal cerebral ultrasound findings [5,6]. Furthermore, early hypoproteinemia may be a poor prognostic factor in preterm infants [7]. In previous studies, low serum albumin within 1 day of birth was associated with longer hospital stay, need for mechanical ventilation, and higher mortality [8,9].
A low vitamin D level within 24 hours of birth has been linked to an increased duration of positive-pressure ventilation during resuscitation at delivery, need for respiratory support, surfactant use, pneumothorax, pulmonary hemorrhage, chronic lung disease, and mortality [10]. Low maternal and neonatal vitamin D levels were reported as risk factors for bronchopulmonary dysplasia (BPD) and respiratory distress syndrome (RDS) [11,12].
Nutritional status at birth has been reported to be correlated with respiratory morbidity, mortality, and prognosis. Therefore, we aimed to find the correlation between nutritional markers at birth and the need for respiratory support on the first day of life as well as early weight gain. We also aimed to identify clinical factors associated with nutritional markers and need for respiratory support on the first day of life.
This is a retrospective study of 94 newborns admitted to the neonatal intensive care unit (NICU) of Kyungpook National University Children's Hospital between March and December 2017 (Figure 1). We included newborns who met the required feeding volume through enteral feeding and who had measurements of all nutritional biomarkers from cord blood or blood sample within 24 hours after birth. Hence, we excluded those whose nutritional markers were measured beyond 24 hours after birth. We also excluded newborns with chromosomal or major congenital anomalies and those who needed parenteral nutrition. However, we included those with atrial or ventricular septal defect but had no heart failure.
This study was approved by the Institutional Review Board of Kyungpook National University Chilgok Hospital and was granted a waiver of informed consent (approval no. 2018-08-023).
Demographic and clinical data on the mother and infant were collected from medical record reviews. The maternal clinical history included premature rupture of membranes (PROM), gestational diabetes mellitus (GDM), and pregnancy-induced hypertension. The neonatal clinical data included gestational age, birth weight, sex, delivery mode, Apgar score at 1 and 5 minutes after birth, use of respiratory support within 24 hours after birth, type of feeding, small for gestational age (SGA), and number of days to recover birth weight. The SGA was defined as the 10th percentile for gestational age as calculated by the 2013 Fenton growth calculator for preterm infants [13].
Respiratory support was defined as the use of nasal continuous positive airway pressure, humidified high-flow nasal cannula (HHFNC), or mechanical ventilation on the first day of life. We provided respiratory support when infants presented with signs of respiratory distress such as tachypnea (respiratory rate >60 breaths/min), severe intercostal and subcostal retractions, apnea with bradycardia (heart rate <100 beats/min), and respiratory acidosis (pH <7.2 and capillary PCO2 >60 mm Hg), and needed more than a 40% to 70% fraction of inspired O2 concentration to maintain >90 % of oxygen saturation. In our NICU, HHFNC with room air was the first line of respiratory support after initial positive pressure ventilator at birth. The mode of respiratory support on the first day of life was assigned depending on the severity of respiratory distress and respiratory acidosis on blood gas.
Infants who needed respiratory support were classified according to conditions such as RDS, transient tachypnea of newborn (TTN), infection, and others. Infection involved sepsis and pneumonia. Infants who required respiratory support because of apnea or seizure were defined as others.
The number of days to recover birth weight was used as a marker of weight gain during the early neonatal period. Feeding was classified into breast milk, preterm formula milk, and formula milk. Feeding with both breast milk and formula milk in a volume ratio of 1:1 was defined as mixed feeding.
We measured the levels of serum total protein, albumin, ferritin, 25-hydroxyvitamin D (25-OHD), and prealbumin in cord blood as nutritional markers. The serum levels of total protein, albumin, and ferritin were measured using bromocresol purple method and bromocresol green method, respectively, which were assessed using the chemiluminescence assay (TBA-2000 FR/DXC 800, Denka Seiken Co. LTD., Tokyo, Japan). The serum prealbumin concentrations were measured by radial turbidimmunoassay (TBA 2000FR, Nittobo Medical, Co. LTD., Osaka, Japan). The serum concentrations of 25-OHD were measured using radioimmunoassay (DIAsource 25OH-Vit.D3-Ria-CT kit, DIAsource Immuno-Assays S.A., Louvain-la-Neuve, Belgium).
Statistical analysis was performed with IBM SPSS Statistics version 23.0 (IBM Corp., Armonk, NY, USA). SGA infants were compared with appropriate for gestational age (AGA) infants using the Mann-Whitney U-test or chi-square test according to continuous or categorical variables. Pearson’s correlation was used to analyze the correlation between gestational age and nutritional markers. The correlation between time to recover birth weight and nutritional markers, with adjustment for gestational age, was determined using partial correlation. Comparison of variables according to disease and type of feeding was assessed using one-way analysis of variance. Meanwhile, analysis of potential confounding factors affecting the need for respiratory support on the first day of life was performed using logistic regression. Statistical significance was set at P<0.05.
The clinical and demographic characteristics of the patients are presented in Table 1. The mean gestational age was 36.6±2.3 weeks (range, 33.1 to 40.5), and the mean birth weight was 2,714±575 g (range, 1,810 to 3,840). Of the 94 patients, nine (10.0%) were SGA infants. The mean time to recover birth weight during full enteral feeding was 6.6±3.0 days. Most of the infants (84%) were fed formula milk during the time to recover their birth weight.
Sixty-three infants (67%) needed respiratory support on the first day of life. The causes of respiratory support were RDS (12.7%), TTN (20.6%), infection (57.1%), and others (9.6%).
The mean levels of total protein, albumin, and prealbumin at birth were 5.2±0.6 g/dL, 3.3±0.3 g/dL, and 7.9±1.6 mg/dL, respectively, whereas the mean levels of serum ferritin and 25-OHD were 218.0±202.7 and 26.6±14.1 ng/mL, respectively.
Figure 2 presented the correlation between gestational age and nutritional markers. The number of days to recover birth weight was correlated with gestational age (r =–0.469, P<0.001). The serum letabvels of total protein (r =0.663, P<0.001), albumin (r=0.542, P<0.001), prealbumin (r =0.332, P=0.001), and ferritin (r =0.352, P<0.001) at birth were also correlated with gestational age, but serum 25-OHD level was not (r =–0.029, P=0.782). Figure 3 shows the correlation between birth weight and nutritional markers. Birth weight was correlated positively with serum concentrations at birth of total protein (r =0.438, P <0.001), albumin (r =0.348, P =0.001), ferritin (r =0.363, P <0.001), and prealbumin (r =0.531, P <0.001), but not with 25-OHD levels (r =–0.043, P=0.686). Days to recover birth weight were correlated with birth weight (r =–0.334, P=0.001).
As shown in Figure 4, the number of days to recover birth weight was correlated with levels of total protein (r =–0.359, P <0.001), albumin (r =–0.335, P=0.002), ferritin (r =–0.309, P=0.004), and 25-OHD (r =0.237, P=0.031), but not with prealbumin levels (r =–0.171, P=0.128). Meanwhile, after adjusting for gestational age, the time to recover birth weight showed no significant correlation with the levels of total protein (r =0.030, P=0.775), albumin (r =0.001, P =0.999), prealbumin (r =–0.028, P =0.787), ferritin (r =–0.098, P=0.352), and 25-OHD (r =0.136, P=0.194) (Figure 5).
Table 2 presents the comparison of clinical characteristics and nutritional status at birth between SGA and AGA infants. The proportion of preterm infants, gestational age, time to recover birth weight, and the need for respiratory support on the first day of life were not significantly different between the two groups.
The serum levels of total protein, albumin, ferritin, and 25-OHD were also not significantly different between both groups. However, prealbumin levels at birth were lower in SGA infants (6.1 mg/dL; interquartile range [IQR], 5.9 to 7.7) than in AGA infants (8.0 mg/dL; IQR, 6.9 to 9.0; P =0.038). In preterm infants, prealbumin levels were not significantly different between both groups, whereas among full-term infants, the prealbumin levels were higher in AGA infants (8.5 mg/dL; IQR, 7.8 to 9.8) than in SGA infants (5.9 mg/dL; IQR, 5.9 to 6.8; P<0.001).
There was no significant difference in gestational age, birth weight, and time to recover birth weight between infants with and without the disease. However, total protein and albumin levels were significantly higher in infants who did not need respiratory support than in infants with diseases (Table 3). Among the four disease groups, infants with infections had significantly lower serum levels of total protein (4.9±0.4 g/dL) than infants without respiratory support (5.4±0.7 g/dL, P=0.012).
There was also no difference in the number of days to recover birth weight in terms of type of feeding (Table 4). Gestational age was different by types of feeding (P=0.001). However, nutritional markers and days to recover birth weight were not significantly different among infants who had formula milk, preterm formula milk, and mixed feeding.
We analyzed the potential confounding factors associated with the need for respiratory support on the first day of life of the newborn (Table 5). A higher Apgar score at 1 minute was associated with a lower need for respiratory support. The need for respiratory support on the first day of life decreased 0.058 and 0.001 times with every 1 g/dL increase in serum total protein (95% confidence interval [CI], 0.004 to 0.833; P =0.036) and albumin (95% CI, 0.000 to 0.136; P=0.009) levels, respectively. However, maternal clinical factors such as PROM, preeclampsia, and GDM, and neonatal clinical factors such as mode of delivery, levels of prealbumin, ferritin, and vitamin D at birth, as well as time to recover birth weight were not significantly associated with the need for respiratory support on the first day of life.
In this study, nutritional markers at birth including total protein, albumin, prealbumin, and ferritin were correlated with gestational age and birth weight. Moreover, the prealbumin levels of SGA infants were significantly lower than those of AGA infants. Furthermore, lower levels of total protein and albumin at birth were associated with a higher risk of need for respiratory support on the first day of life, regardless of the Apgar score.
Many biochemical indicators are commonly used to assess nutritional status. Recent studies have shown that low plasma protein levels are associated with poor prognosis and high mortality among infants. Bonsante et al. [5] reported that low plasma protein levels on the first day of life can be used as a prognostic factor for severe adverse outcomes such as death, grade 3 or 4 intraventricular hemorrhage (IVH), or cystic periventricular leukomalacia (PVL). Iacobelli et al. [6] also suggested that hypoproteinemia was significantly associated with adverse outcome on the day of birth. Because total protein level is a key indicator of colloid oncotic pressure, it has been used as a predictor of morbidity and mortality in acute illness. Their other study showed that total plasma protein had a significant predictive value comparable to the Clinical Risk Index for Babies as well as Score for Neonatal Acute Physiology and Perinatal Extension II with scores greater than other validated severity scores [7]. Although infants with severe adverse outcomes, such as death, BPD, IVH, or PVL, were not included in our study, we found that low total protein levels at birth were associated with the need for respiratory support on the first day of life. Additionally, infants with infections such as pneumonia and sepsis showed lower total protein levels at birth than infants not requiring respiratory support.
Torer et al. [8] investigated the association between serum albumin levels and mortality in premature infants. The prevalence of RDS, sepsis, and mortality was significantly higher in infants with serum albumin levels less than the 25th percentile. Similarly, our study showed that lower albumin levels at birth was correlated with a higher need for respiratory support. Lower albumin levels result from inflammation and inadequate protein intake, which suggests an association between inadequate nutritional status and the need for respiratory support.
Vitamin D is also an important factor in early lung development and maturation. Vitamin D levels during pregnancy have a significant effect on placental development and weight, and play an important role in embryogenesis, fetal lung maturation and development [12]. Several studies have shown that vitamin D was associated with fetal and neonatal lung maturation. Particularly, vitamin D has been associated with acute respiratory morbidity and BPD development among preterm infants [10-12]. In contrast to these studies, vitamin D status at birth was not significantly associated with gestational age and need for respiratory support after birth in our study. But in our study, most of the participants were late preterm or full term infants, which had limitation to present the correlation between gestational age and vitamin D status at birth.
Low albumin levels reflect a protein deficiency and immune deficiency status. However, the half-life of albumin is long (17 to 20 days), and the liver synthesizes albumin continuously in the early stage of malnutrition; thus, serum albumin levels remain relatively constant and may not present early nutritional deficiency [2,3,8]. On the other hand, prealbumin is mainly synthesized by the liver and excreted by the kidneys and gastrointestinal tract within its short half-life (1.9 days). The small size, short half-life, and abundant tryptophan content of prealbumin make it useful as a nutritional indicator [1-3]. Compared with albumin, prealbumin is sensitive to protein intake and is a good indicator of early nutritional status [1-4,12]. Prealbumin levels in umbilical cord blood were positively correlated with gestational age and birth weight [14], although a study by Su et al. [15] suggested no association of prealbumin level with birth weight and gestational age. In our study, however, albumin and prealbumin levels at birth was correlated with gestational age and birth weight. Furthermore, albumin and prealbumin levels at birth were correlated with number of days to recover birth weight, but not after adjusting for gestational age. These results suggest that the time to recover birth weight was more correlated with gestational age compared to nutritional status at birth in our study. Prealbumin levels of SGA infants were significantly lower than those of AGA infants, which could indicate that SGA infants have inadequate nutritional intake.
Infants without RDS have significantly higher prealbumin levels than infants with RDS [14]. An increase in prealbumin levels was demonstrated in neonates exposed to exogenous steroid administration or increased endogenous corticosteroid secretion such as during prolonged rupture of membranes. If a steroid such as betamethasone is administrated before labor, it could activate the liver’s synthetic ability, thereby elevation of prealbumin levels in the cord blood. Compared with a previous study, the prealbumin levels of infants with RDS were not significantly lower than those of infants without need for respiratory support. Also, the prealbumin levels at birth were not associated with the need for respiratory support on the first day of life. The prealbumin levels of infants from mothers with PROM were not significantly higher than those of infants from mothers without PROM (Supplementary Table 1).
Neonatal nutritional status at birth is correlated with maternal nutritional status during pregnancy. Lower maternal vitamin D and iron levels predisposed newborns to lower vitamin D and iron status at birth [16-18]. In our study, maternal nutritional markers were not measured; therefore, we did not analyze the correlation between maternal and neonatal total protein and albumin levels at birth. Here, total protein and albumin levels at birth showed a significant association with need for respiratory support, regardless of the Apgar score. This suggested that improving the maternal nutritional status could be an important factor for decreasing the risk of respiratory support in the neonate during the first day of life.
Our study has several limitations. We only included patients whose mothers had maternal PROM, preeclampsia, and GDM, which limited the analysis for identifying maternal diseases associated with nutritional status. We included neonatal risk factors such as respiratory distress, preterm infants, and apnea. Overall, there was limited comparisons with healthy infants. In the case of infants requiring parenteral nutrition, the volumes of fluid and feeding were individually different and were dependent on clinical status. Thus, we included only infants who met the required feeding volume through enteral feeding to minimize confounding factors. Consequently, early preterm infants were not included in this study. Furthermore, the small number of SGA infants posed a limitation on the comparison of nutritional markers between SGA and AGA infants.
In conclusion, nutritional status at birth could be associated with need for respiratory support on the first day of life, regardless of the Apgar score. Further studies on the correlation between maternal and neonatal nutritional markers, maternal macronutrients and micronutrients, and maternal nutritional status are warranted.
SUPPLEMENTARY MATERIALS
Supplementary materials related to this article can be found
online at https://doi.org/10.5385/nm.2019.26.1.24.
Supplementary Table 1.
Comparison of Clinical Characteristics and Nutritional Markers at Birth and According to Maternal Disease
ACKNOWLEDGMENTS
This work was supported by Biomedical Research Institute grant, Kyungpook National University Hospital (2015).
REFERENCES
1. Delliere S, Cynober L. Is transthyretin a good marker of nutritional status? Clin Nutr. 2017; 36:364–70.
2. Mol N, Kwinta P. How to determine the nutritional status of preterm babies?: review of the literature. Dev Period Med. 2015; 19:3 Pt 1:324–9.
3. Jung JA, Park EA, Seo JW, Lee SJ. The utility of serum prealbumin as a biochemical marker for nutritional adequacy in neonates. J Korean Pediatr Soc. 2000; 43:605–10.
4. Moskowitz SR, Pereira G, Spitzer A, Heaf L, Amsel J, Watkins JB. Prealbumin as a biochemical marker of nutritional adequacy in premature infants. J Pediatr. 1983; 102:749–53.
5. Bonsante F, Ramful D, Samperiz S, Daniel S, Godeluck A, Robillard PY, et al. Low plasma protein levels at birth are associated with poor cardiovascular adaptation and serious adverse outcome in infants with gestational age <32 weeks: the ProHémie study. Neonatology. 2017; 112:114–21.
6. Iacobelli S, Bonsante F, Lacoutiere C, Ferdynus C, Cottenet J, Binquet C, et al. Hypoproteinemia on the first day of life and adverse outcome in very preterm infants admitted to the neonatal intensive care unit. J Perinatol. 2012; 32:520–4.
7. Iacobelli S, Bonsante F, Quantin C, Robillard PY, Binquet C, Gouyon JB. Total plasma protein in very preterm babies: prognostic value and comparison with illness severity scores. PLoS One. 2013; 8:e62210.
8. Torer B, Hanta D, Yapakci E, Gokmen Z, Parlakgumus A, Gulcan H, et al. Association of serum albumin level and mortality in premature infants. J Clin Lab Anal. 2016; 30:867–72.
9. Yang CY, Li BY, Xu P, Yang YJ, Yang QZ. Correlation of serum albumin with the clinical features and prognosis of preterm neonates in the neonatal intensive care unit. Clin Exp Obstet Gynecol. 2016; 43:149–53.
10. Onwuneme C, Martin F, McCarthy R, Carroll A, Segurado R, Murphy J, et al. The association of vitamin D status with acute respiratory morbidity in preterm infants. J Pediatr. 2015; 166:1175–80.
11. Cetinkaya M, Cekmez F, Erener-Ercan T, Buyukkale G, Demirhan A, Aydemir G, et al. Maternal/neonatal vitamin D deficiency: a risk factor for bronchopulmonary dysplasia in preterms? J Perinatol. 2015; 35:813–7.
12. Lykkedegn S, Sorensen GL, Beck-Nielsen SS, Christesen HT. The impact of vitamin D on fetal and neonatal lung maturation. A systematic review. Am J Physiol Lung Cell Mol Physiol. 2015; 308:L587–602.
13. Fenton TR, Kim JH. A systematic review and meta-analysis to revise the Fenton growth chart for preterm infants. BMC Pediatr. 2013; 13:59.
14. Georgieff MK, Sasanow SR, Mammel MC, Ophoven J, Pereira GR. Cord prealbumin values in newborn infants: effect of prenatal steroids, pulmonary maturity, and size for dates. J Pediatr. 1986; 108:972–6.
15. Su PH, Wang SL, Chen JY, Hu JM, Chang HP, Chen SJ. Transthyretin levels are not related to Apgar score in low birth weight and very low birth weight infants. Early Hum Dev. 2008; 84:533–8.
16. Við Streym S, Kristine Moller U, Rejnmark L, Heickendorff L, Mosekilde L, Vestergaard P. Maternal and infant vitamin D status during the first 9 months of infant life-a cohort study. Eur J Clin Nutr. 2013; 67:1022–8.
17. Ariyawatkul K, Lersbuasin P. Prevalence of vitamin D deficiency in cord blood of newborns and the association with maternal vitamin D status. Eur J Pediatr. 2018; 177:1541–5.
18. McCarthy EK, Kenny LC, Hourihane JOB, Irvine AD, Murray DM, Kiely ME. Impact of maternal, antenatal and birth-associated factors on iron stores at birth: data from a prospective maternal-infant birth cohort. Eur J Clin Nutr. 2017; 71:782–7.
Figure 1.
Flowchart of enrolled patients. PN, parenteral nutrition; RDS, respiratory distress syndrome; TTN, transient tachypnea of newborn.
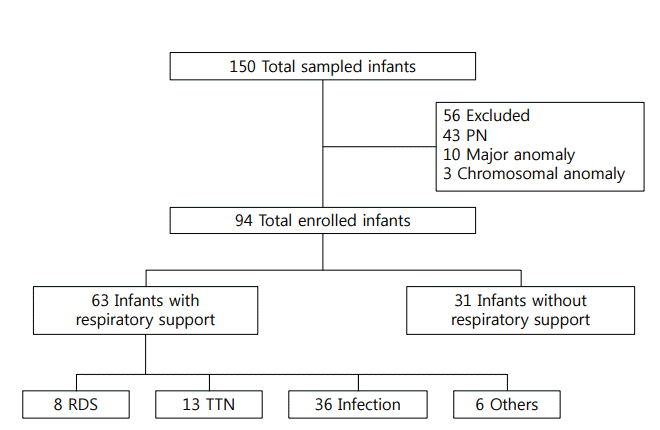
Figure 2.
Correlation between gestational age and days to recover birth weight (A), serum levels of total protein (B), albumin (C), prealbumin (D), ferritin (E), and 25-hydroxyvitamin D (25-OHD) (F) at birth.
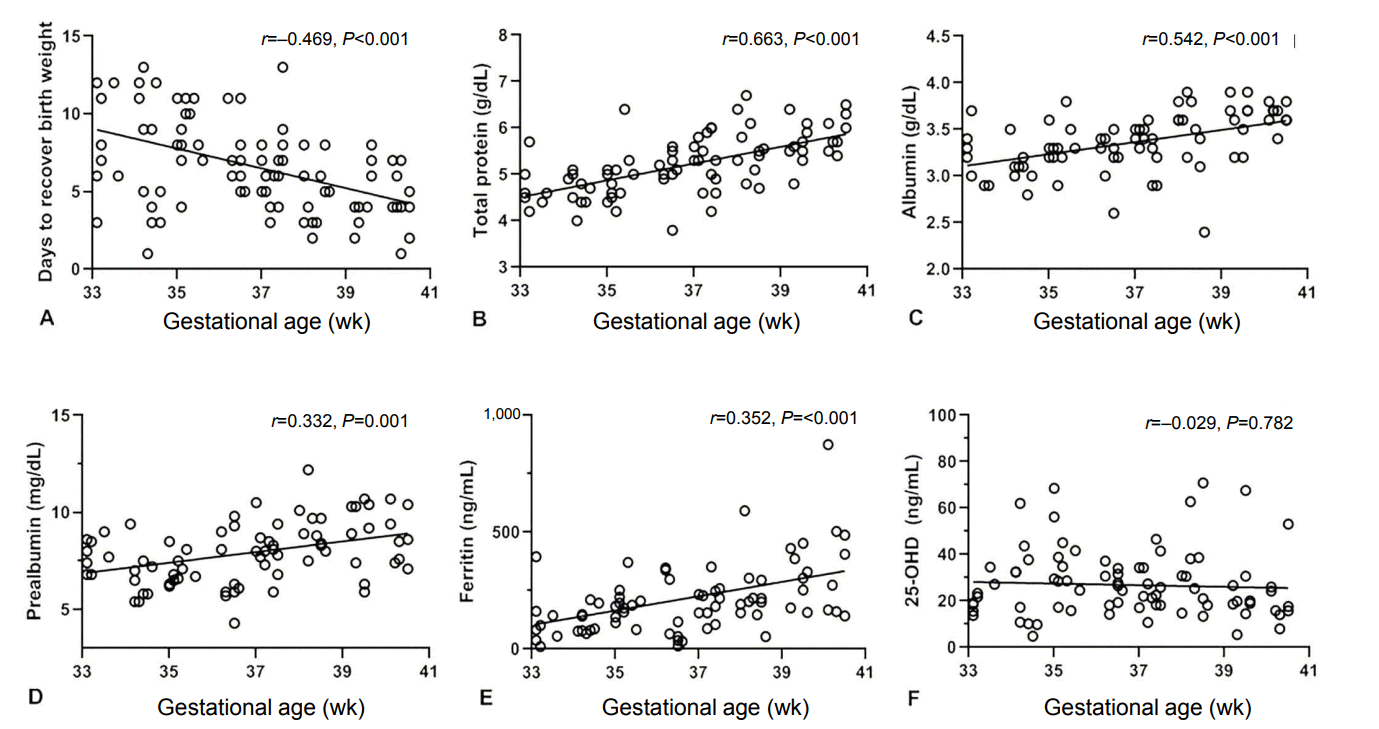
Figure 3.
Correlation between birth weight and days to recover birth weight (A), serum levels of total protein (B), albumin (C), prealbumin (D), ferritin (E), and 25-hydroxyvitamin D (25-OHD) (F) at birth.
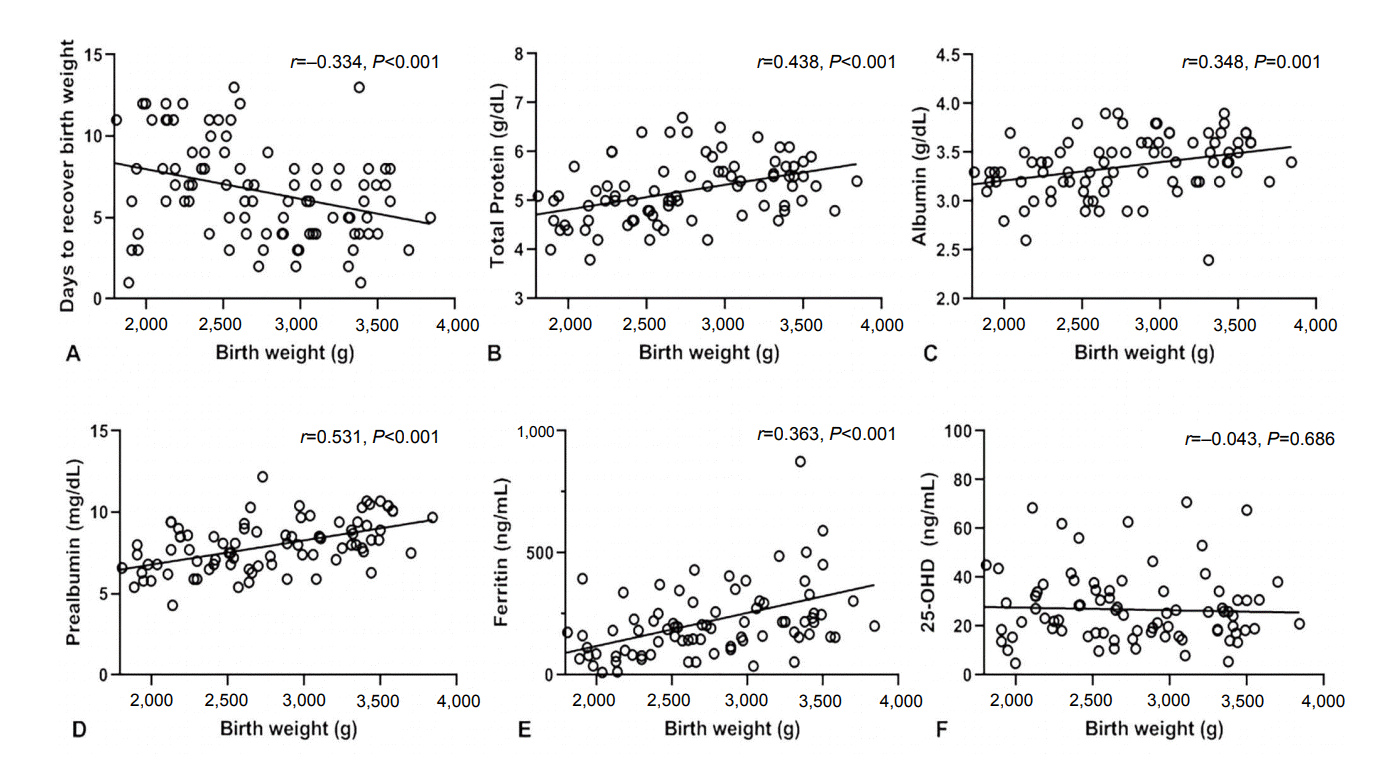
Figure 4.
Correlation between days to recover birth weight and serum levels of total protein (A), albumin (B), prealbumin (C), ferritin (D), and 25-hydroxyvitamin D (25-OHD) (E) at birth.
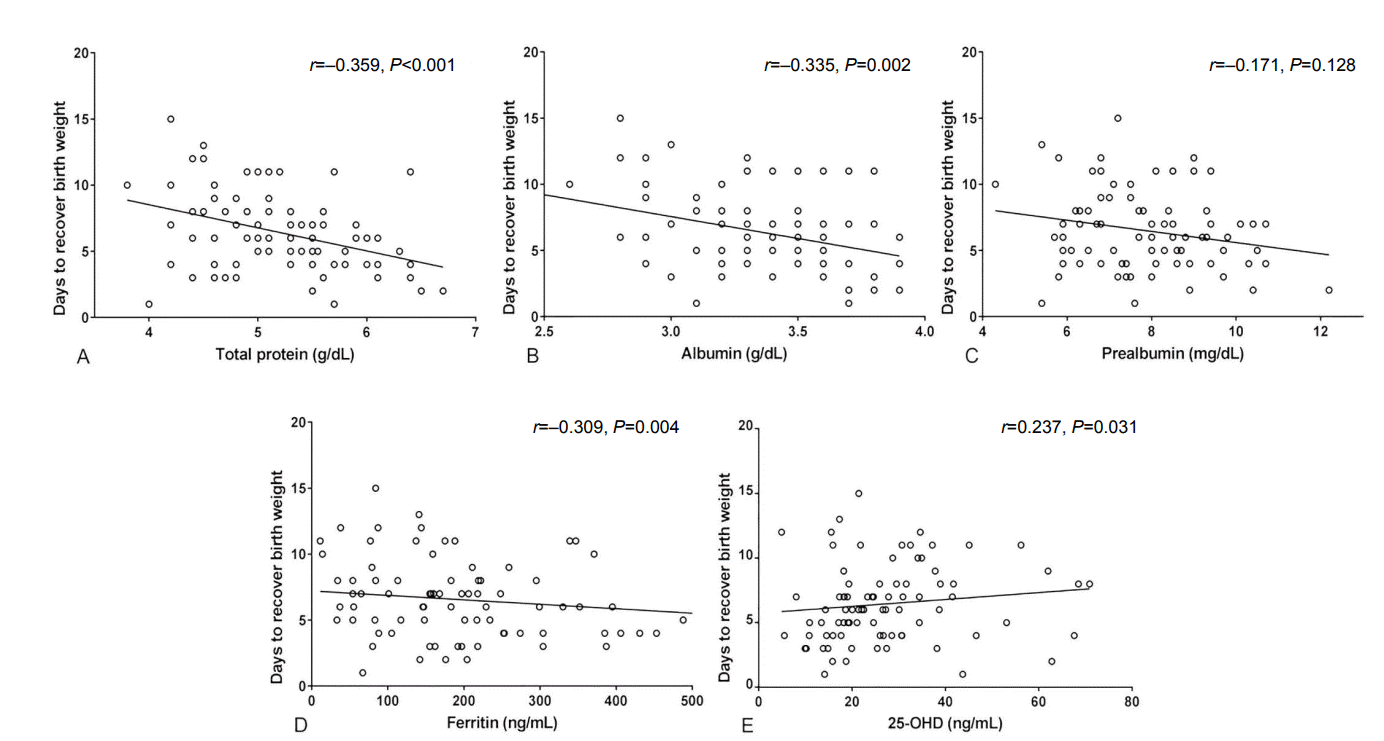
Figure 5.
Correlation between days to recover birth weight and serum levels of total protein (A), albumin (B), prealbumin (C), ferritin (D), and 25-hydroxyvitamin D (25-OHD) (E) at birth after adjustment for gestational age.
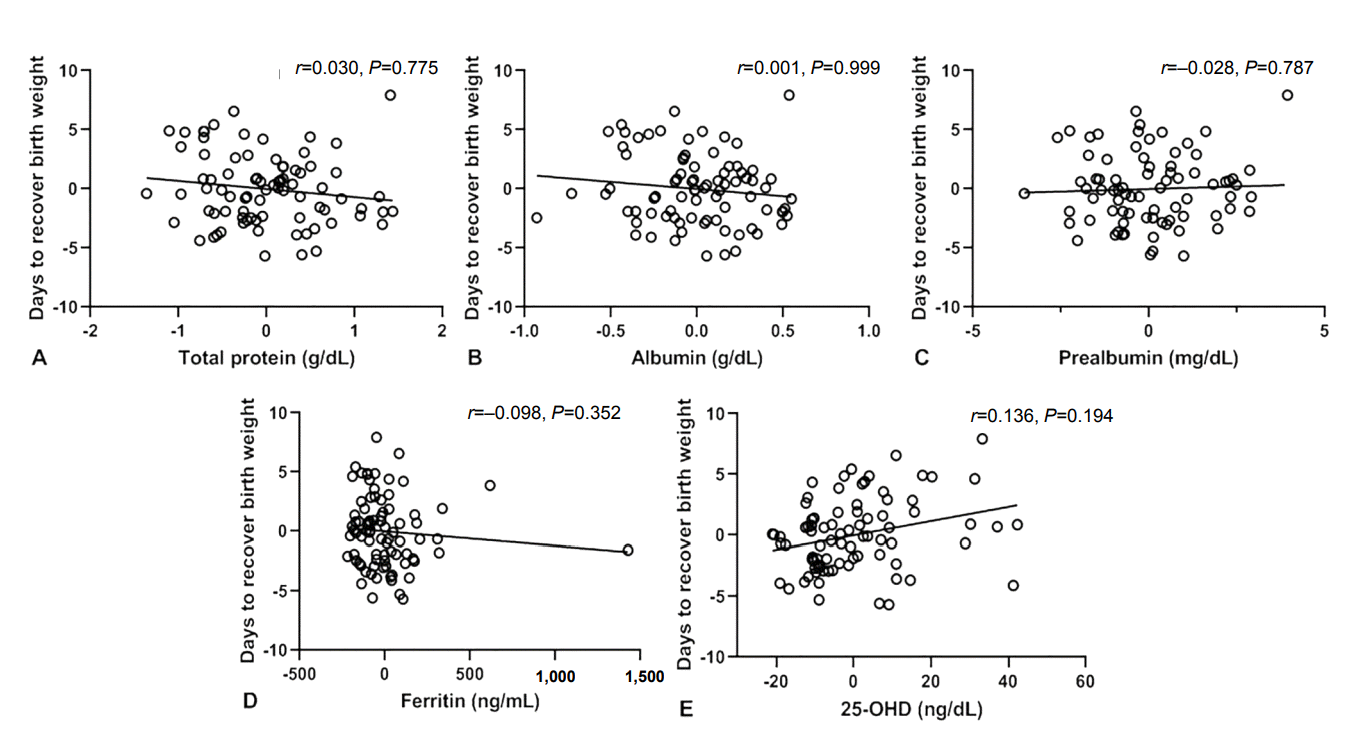
Table 1.
Clinical and Demographic Characteristics of Patients (n=94)
Table 2.
Comparison of Nutritional Status at Birth between Small-for-Gestational Age Infants and Appropriate for Gestational
Age Infants
Table 3.
Comparison of Nutritional Markers at Birth and Days to Recover Birth Weight According to Disease
| Variable | RDS | TTN | Infection | Others | No need for respiratory support | ANOVA P-value* |
Post hoc comparison using Turkey HSD test† |
|||
|---|---|---|---|---|---|---|---|---|---|---|
| RDS | TTN | Infection | Others | |||||||
| Number | 8 (8.5) | 13 (13.8) | 36 (38.3) | 6 (6.4) | 31 (33.0) | |||||
| Gestational age (wk) | 36.1±1.4 | 35.6±2.1 | 36.7±2.3 | 36.3±2.6 | 36.6±2.4 | 0.772 | 0.999 | 0.992 | 1.000 | 0.981 |
| Birth weight (g) | 2,280.0±202.5 | 2,707.5±524.2 | 2,684.2±561.5 | 2,563.3±765.4 | 2,780.6±565.6 | 0.408 | 0.455 | 0.998 | 0.981 | 0.979 |
| Days to recover birth weight | 7.2±3.4 | 6.9±3.1 | 7.1±3.2 | 7.7±3.8 | 6.0±2.9 | 0.602 | 0.949 | 0.966 | 0.801 | 0.930 |
| Nutritional markers | ||||||||||
| Total protein (g/dL) | 4.7±0.4 | 4.9±0.3 | 4.9±0.4 | 4.9±0.3 | 5.4±0.7 | <0.001 | 0.09 | 4 0.141 | 0.012 | 0.654 |
| Albumin (g/dL) | 3.1±0.2 | 3.2±0.2 | 3.2±0.2 | 3.3±0.1 | 3.4±0.3 | 0.007 | 0.906 | 0.927 | 0.976 | 0.986 |
| Prealbumin (mg/dL) | 6.9±1.1 | 7.2±1.1 | 7.8±1.3 | 7.0±0.9 | 8.2±1.7 | 0.180 | 0.511 | 0.649 | 0.947 | 0.779 |
| Ferritin (ng/mL) | 172.2±98.9 | 154.4±85.6 | 200.8±109.0 | 158.0±46.6 | 253.6±266.8 | 0.645 | 0.958 | 0.836 | 0.937 | 0.968 |
| 25-OHD (ng/mL) | 22.9±12.3 | 22.7±11.1 | 32.6±18.0 | 27.2±2.5 | 26.5±13.8 | 0.411 | 0.990 | 0.975 | 0.657 | 1.000 |
Table 4.
Comparison of Nutritional Markers at Birth and Days to Recover Birth Weight According to Types of Feeding
| Variable | Breast milk | Preterm formula milk | Formula milk | Mix | ANOVA P value* |
Post hoc comparison using Turkey HSD test† |
||
|---|---|---|---|---|---|---|---|---|
| Breast milk | Preterm formula milk | Mix | ||||||
| Number | 2 (2.1) | 11 (11.7) | 75 (79.8) | 6 (6.4) | ||||
| Gestational age (wk) | 38.1±2.2 | 34.1±2.3 | 36.6±2.0 | 37.2±2.6 | 0.001 | 1.000 | 0.034 | 1.000 |
| Birth weight (g) | 2,910.0±480.8 | 2,756.4±443.6 | 2,752.0±560.7 | 2,281.7±537.3 | 0.230 | 0.970 | 0.540 | 0.279 |
| Days to recover birth weight | 10.5±3.5 | 6.5±2.5 | 6.0±2.9 | 8.5±2.1 | 0.037 | 1.000 | 0.963 | 0.235 |
| Nutritional markers | ||||||||
| Total protein (g/dL) | 5.2±0.5 | 5.2±0.5 | 5.2±0.7 | 5.2±0.6 | 0.999 | 1.000 | 1.000 | 1.000 |
| Albumin (g/dL) | 3.5±0.4 | 3.3±0.2 | 3.4±0.3 | 3.3±0.3 | 0.799 | 1.000 | 1.000 | 1.000 |
| Prealbumin (mg/dL) | 9.1±2.3 | 8.0±1.7 | 7.9±1.5 | 7.9±1.5 | 0.845 | 1.000 | 1.000 | 1.000 |
| Ferritin (ng/mL) | 236.0±96.2 | 220.3±129.7 | 221.4±230.8 | 248.3±216.1 | 0.993 | 1.000 | 1.000 | 1.000 |
| 25-OHD (ng/mL) | 31.2±9.8 | 25.8±18.2 | 27.9±14.5 | 23.3±6.1 | 0.734 | 0.828 | 0.998 | 0.589 |
Table 5.
Association of Clinical Characteristics and Nutritional Status with the Need for Respiratory Support on the First Day of Life


 PDF
PDF Citation
 Print
Print


 XML Download