INTRODUCTION
MATERIALS AND METHODS
1. Study design
2. Data collection and definitions
3. Neurodevelopmental assessment
1) Bayley-III
2) School-age tests
(1) Cognitive test: K-WISC-IV
(2) Behavioral test: K-CBCL
4. Statistical analysis
RESULTS
1. Demographic characteristics
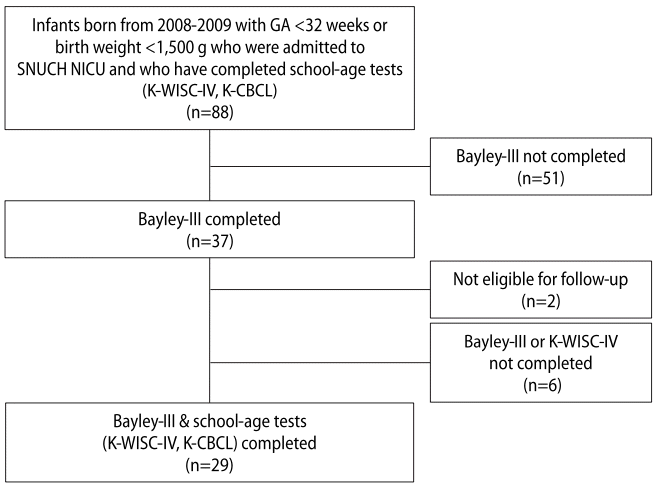
 | Figure 1.Flow chart of the study. Abbreviations: GA, gestational age; SNUCH, Seoul National University Children’s Hospital; NICU, neonatal intensive care unit; K-WISC, Korean version of the Wechsler Intelligence Scale for Children; K-CBCL, Korean version of the Child Behavior Checklist; Bayley-III, Bayley Scales of Infant and Toddler Development, third edition. |
Table 1.
Values are expressed as mean±standard deviation or number (%).
Abbreviations: NICU, neonatal intensive care unit; Bayley-III, Bayley Scales of Infant and Toddler Development, third edition; K-WISC, Korean version of the Wechsler Intelligence Scale for Children; FSIQ, full-scale intelligence quotient; K-CBCL, Korean version of the Child Behavior Checklist.
2. Correlations and comparisons of the Bayley-III subscales
3. Correlations of the Bayley-III subscales with school-age tests (K-WISC-IV and K-CBCL)
Table 2.
| Bayley-III | FSIQ | Internalizing problems | Externalizing problems | Total behavior problems |
|---|---|---|---|---|
| Cognitive | 0.612* | –0.309 | –0.204 | –0.292 |
| Language | 0.477* | –0.201 | –0.243 | –0.237 |
| Motor | 0.523* | –0.302 | –0.19 | –0.25 |
| Social-emotional | 0.361† | –0.368† | –0.266 | –0.365† |
| Adaptive behavior | 0.48* | –0.342 | –0.33 | –0.467* |
| Communication | 0.531* | –0.34 | –0.188 | –0.349 |
| Functional pre-academics | 0.359† | –0.126 | –0.177 | –0.149 |
| Self-direction | 0.356† | –0.303 | –0.26 | –0.421† |
4. Predictive ability of the Bayley-III subscales for the schoolage tests (K-WISC-IV and K-CBCL)
Table 3.
Values are expressed as mean±standard deviation unless otherwise stated.
Abbreviations: Bayley-III, Bayley Scales of Infant and Toddler Development, third edition; CA, corrected age; K-WISC, Korean version of the Wechsler Intelligence Scale for Children; FSIQ, full-scale intelligence quotient; SD, standard deviation.
Table 4.
| Bayley-III low group (<–1 SD) |
95% Confidence interval |
||||
|---|---|---|---|---|---|
| AUC | Sensitivity | Specificity | PPV | NPV | |
| Cognitive | 0.524 (0.331–0.711) | 12.5 (1.6–38.3) | 92.3 (64.0–99.8) | 66.7 (16.9–95.2) | 46.2 (40.2–52.2) |
| Language | 0.680* (0.482–0.840) | 43.8 (19.8–70.1) | 92.3 (64.0–99.8) | 87.5 (49.6–98.0) | 57.1 (45.7–67.9) |
| Motor | 0.625* (0.427–0.797) | 25.0 (7.3–52.4) | 100.0 | 100.0 | 52.0 (44.9–59.0) |
| Social-emotional | 0.649* (0.451–0.816) | 37.5 (15.2–64.6) | 92.3 (64.0–99.8) | 85.7 (45.1–97.8) | 54.5 (44.3–64.4) |
| Adaptive behavior | 0.767† (0.574–0.903) | 68.8 (41.3–89.0) | 84.6 (54.6–98.1) | 84.6 (59.6–95.4) | 68.8 (50.6–82.5) |
| Communication | 0.680* (0.482–0.840) | 43.8 (19.8–70.1) | 92.3 (64.0–99.8) | 87.5 (49.6–98.0) | 57.1 (45.7–67.9) |
| Functional pre-academics | 0.642 (0.443–0.810) | 43.8 (19.8–70.1) | 84.6 (54.6–98.1) | 77.8 (46.6–93.4) | 55.0 (42.8–66.6) |
| Self-direction | 0.673* (0.475–0.835) | 50.0 (24.7–75.3) | 84.6 (54.6–98.1) | 80.0 (50.5–94.0) | 57.9 (44.4–70.3) |
Abbreviations: Bayley-III, Bayley Scales of Infant and Toddler Development, third edition; CA, corrected age; K-WISC, Korean version of the Wechsler Intelligence Scale for Children; FSIQ, full-scale intelligence quotient; SD, standard deviation; AUC, area under curve; PPV, positive predictive value; NPV, negative predictive value.
Table 5.
| Communication low group (<–1 SD) |
95% Confidence interval |
||||
|---|---|---|---|---|---|
| AUC | Sensitivity | Specificity | PPV | NPV | |
| Somatic complaints | 0.860* (0.718–0.897) | 100.0 (15.8–100.0) | 88.9 (70.8–97.6) | 40.0 (18.7–66.0) | 100.0 |
| Anxious/depressed | 0.708† (0.512–0.861) | 60.0 (14.7–94.7) | 70.8 (48.9–87.4) | 30.0 (14.2–52.5) | 89.5 (73.8–96.2) |
| Social problems | 0.766† (0.573–0.902) | 71.4 (29.0–96.3) | 86.4 (65.1–97.1) | 62.5 (34.5–84.1) | 90.5 (74.4–96.9) |
| Attention problems | 0.700† (0.502–0.855) | 75.0 (19.4–99.4) | 80.0 (59.3–93.2) | 37.5 (18.6–61.2) | 95.2 (78.4–99.1) |
| Aggressive problems | 0.879* (0.761–0.989) | 100.0 (29.2–100.0) | 80.8 (60.6–93.4 | 37.5 (21.4–56.9) | 100.0 |


 PDF
PDF Citation
 Print
Print


 XML Download