Journal List > Neonatal Med > v.25(3) > 1516080867

Baek, Jin, Jeon, and Heo: The Effect of Maternal Pre-pregnancy Body Mass Index on Very Low Birth Weight Infants

Abstract

Purpose

The pre-pregnancy body mass index (BMI) is associated with adverse neonatal outcomes. However, studies on very low birth weight (VLBW) infants are rare. This study aimed to investigate the effect of maternal pre-pregnancy BMI on VLBW infants.

Methods

This retrospective study evaluated singleton VLBW infants born at the CHA Gangnam Medical Center from 2006 to 2016. The neonates were classified into three groups according to the maternal pre-pregnancy BMI: underweight (<18.5 kg/m2), normal weight (≥18.5 to <23 kg/m2), and overweight or obese (≥23 kg/m2). Clinical characteristics and morbidities of mothers and infants were analyzed.

Results

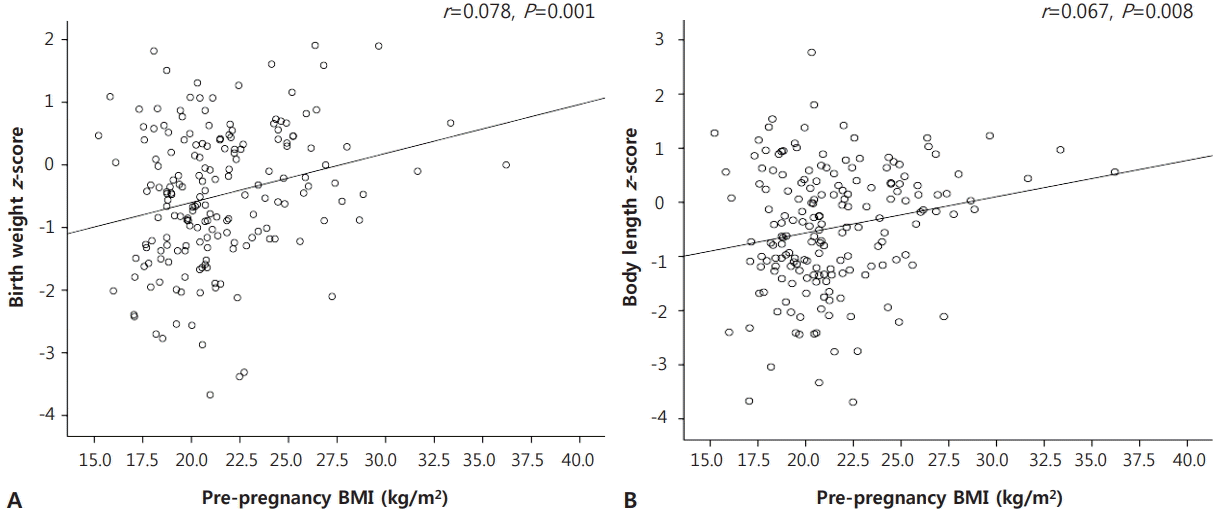
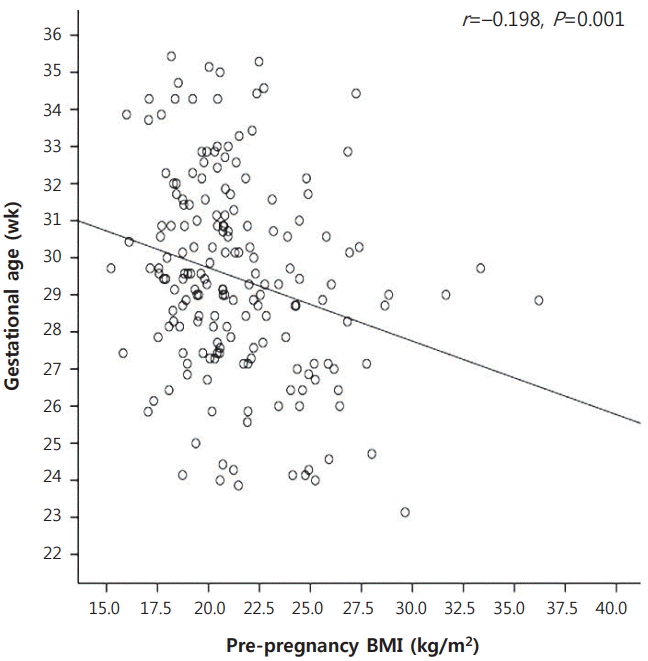
A total of 181 infants belonging to underweight (16.6%), normal weight (58.6%), and overweight or obese (24.8%) groups were enrolled. The pre-pregnancy BMI had a significant negative correlation with gestational age (r=−0.198, P=0.001) and a significant positive correlation with the z-score of the birth weight (r=0.078, P=0.001) and body length (r=0.067, P=0.008). The number of extremely preterm infants was significantly higher in the overweight or obese group. The proportion of risk of small for gestational age infants was higher in the underweight group (adjusted odds ratio [OR], 2.958; 95% confidence interval [CI], 1.113 to 7.864), whereas that of infants with severe retinopathy of prematurity was higher in the overweight or obese group (adjusted OR, 9.546; 95% CI, 1.230 to 74.109).

Conclusion

In our population of VLBW infants, the pre-pregnancy BMI was associated with gestational age, intrauterine growth, and adverse neonatal outcomes. Therefore, proper weight control before pregnancy is important.

서론

산모의 적절한 임신 중 체중 증가에도 불구하고, 비정상적인 산모의 임신 전 체질량지수는 산모와 신생아에게 부정적인 영향을 미칠 위험성이 높다[1]. 과체중 또는 비만 산모인 경우 임신성 고혈압, 임신성 당뇨의 위험이 높으며 미숙아 분만, 부당 중량아, 사산과의 연관성이 높다[2-4]. 반면 저체중 산모인 경우에는 미숙아나 저체중 출생아의 분만과 연관성이 높다고 보고된 바 있다[2,5,6].
이처럼 임신 전 체질량지수는 산모의 예후에 영향을 줄 뿐만 아니라 태아의 성장과 발달 및 신생아의 예후에 영향을 미칠 수 있으나, 최근 빠르게 증가하는 극소 저체중 출생아만을 대상으로 산모의 임신 전 체질량지수가 신생아에게 미치는 영향에 대한 보고는 매우 드물다. 2009년 Bruno 등[7]이 301명의 극소 저체중 출생아를 대상으로 산모의 임신 전 체질량지수와 신생아 질환의 중증도의 연관성에 대해 보고하였는데, 이 연구에서는 신생아 질환 중증도의 지표인 Score for Neonatal Acute Physiology (SNAP)와의 연관성만을 보아 연관이 없다는 결론을 내렸으며, 그 외 신생아 신체 계측 및 이환율 등과의 연관성은 확인하지 않았다. 국내에서는 극소 저체중 출생아를 대상으로 산모의 임신 전 체질량지수가 미치는 영향에 대한 연구는 없다.
이에 본 연구에서는 단태아로 출생한 극소 저체중 출생아를 대상으로, 산모의 임신 전 체질량지수가 산모의 이환율, 신생아의 신체 계측 및 이환율 등에 미치는 영향에 대해 조사하였다.

대상 및 방법

1. 대상

2006년 1월부터 2016년 12월까지 강남차병원에서 출생하여 신생아집중치료실에 입원한 출생체중 1,500 g 미만의 극소 저체중 출생아 중, 단태아로 출생하였으며 산모의 임신 전 체질량지수 확인이 가능한 181명을 대상으로 하였다.

2. 방법

연구대상 신생아와 산모의 의무기록을 후향적으로 분석하여 병력을 조사하였다. 산모의 임신 전 체질량지수는 임신 후 첫 외래 방문 시 산모와의 인터뷰를 통해 기록된 임신 전 체중과 직접 측정한 키를 토대로 계산(body mass index [kg/m2])한 뒤 다음의 3개 군으로 분류하였다: 저체중(underweight, <18.5 kg/m2), 정상 체중(normal weight, ≥18.5 to <23 kg/m2), 과체중 혹은 비만(overweight/obese, ≥23 kg/m2) [8]. 각 군에 대해 산모의 특성, 신생아의 특성, 이환율 등을 비교 분석하였다.
산모의 특성으로 분만 당시 나이, 분만력, 흡연력, 조기 분만, 조기 양막파수(≥18시간) 유무, 전자간증, 임신성 당뇨병, 분만 방법, 산전 부신피질호르몬 투여, 인공 수정 여부, 임신 전과 출산 시의 체중 및 체질량지수를 조사하여 비교 분석하였다. 체중 또는 체질량지수의 증가 비율은, 임신 전과 출산 시의 체중 또는 체질량지수 증가분을 임신 전 체중 또는 체질량지수로 나누어 계산하였다. 신생아의 기본적인 특성으로는 재태 연령, 출생 시 체중, 키, 두위, 성별, 5분 아프가점수, 부당 경량아, 부당 중량아 여부를 포함하였다. 연령 대비 출생체중이 10% 미만인 경우는 부당 경량아로, 90% 초과인 경우는 부당 중량아로 정의하였다. 출생 시 체중, 키, 두위 z-score는 2013 Fenton 성장곡선을 기준으로 구하여 비교하였다[9]. 신생아의 임상적 특성 및 이환된 질환으로는 약물 혹은 외과적 치료가 필요한 동맥관 개존증, 배양검사로 확진된 패혈증, 침습적 또는 비침습적 환기기 및 보조적 산소요법을 포함하는 호흡 보조의 기간, 수혈 횟수, 총 정맥 내 영양요법 기간, Bell 등[10]의 분류상 2기 이상의 괴사성 장염, 중등증과 중증의 기관지 폐 이형성증[11], Papile 등[12]의 분류에 따라 뇌초음파검사에서 확인된 3단계 이상의 뇌실내출혈, 낭종성 뇌실주위 백질연화증, 3기 이상의 미숙아 망막병증[13], 퇴원 시점에 연령 대비 체중이 10% 미만인 경우로 정의된 자궁외 성장지연, 사망률, 신생아집중치료실 입원 치료 기간을 조사하였다. 본 연구는 강남차병원 임상시험심사위원회의 승인을 받았으며, 후향적 연구로 동의서 면제 승인을 받았고, 자료 분석 시 연구 대상자의 개인 정보는 포함하지 않았다(IRB No. GCI-18-19).

3. 통계학적 분석

통계 분석은 SPSS Statistics version 23 (IBM Co., Armonk, NY, USA)을 사용하여 연속형 변수는 Kruskall-Wallis test로 비교하였으며, 범주형 변수는 Pearson’s chi-square test를 이용하였다. 연속형 변수는 중앙값과 사분범위로 표시하였으며, 범주형 변수는 퍼센트로 표시하였다. 단변량 분석에서 유의미한 차이를 보였던 변수와 산모의 임신 전 체질량지수와의 연관성을 보기 위하여 연속형 변수에 대해서는 선형회귀분석을, 범주형 변수에 대해서는 로지스틱 회귀 분석을 시행하였다. P-value가 0.05 미만인 경우를 통계적으로 유의한 차이가 있다고 판단하였다.

결과

1. 산모의 임상적 특성과 이환율

임신 전 체질량지수 확인이 가능한 산모는 총 181명이었으며, 그 중 저체중 산모군은 30명, 정상체중 산모군은 106명, 과체중 혹은 비만 산모군은 45명이었다. 분만 당시 산모의 나이 중간값은 저체중 산모군이 33세, 정상체중 산모군이 34세, 과체중 혹은 비만 산모군이 33세로 세 군 간에 유의한 차이는 없었다. 임신 전 체중의 중간값은 저체중 산모군, 정상체중 산모군, 과체중 혹은 비만 산모군에서 각각 46.0, 52.0, 65.0 kg이었으며 임신 전 체질량지수의 중간값은 각각 17.8, 20.5, 25.2 kg/m2로 세 군 간에 유의한 차이를 보였다. 임신 전과 비교한 출산 시의 체중 및 체질량지수 증가 비율은 세 군에서 각각 18.7%, 17.4%, 8.9%로 체질량지수가 큰 군일수록 유의하게 증가 비율이 낮아지는 경향을 확인할 수 있었다(Table 1).
임신 전 체질량지수에 따른 산모의 이환율을 비교해 보았을 때, 조기 진통, 18시간 이상의 조기 양막파수, 전자간증의 비율은 세 군 간 유의한 차이가 없었으나, 임신성 당뇨는 과체중 혹은 비만 산모군이 20%로, 저체중 산모군의 6.7%, 정상체중 산모군의 3.8%에 비해 유의하게 높은 것을 확인할 수 있었다(Table 1). 임신 전 체질량지수와 산모 이환율의 상관성을 알기 위해 다항 로지스틱 회귀분석을 시행하였을 때, 산모의 분만 시 나이, 다분만 여부, 임신 중 체중 변화의 비율(%)을 보정한 상태에서, 과체중 혹은 비만 산모군에서 임신성 당뇨의 위험도가 유의하게 높아지는 것(adjusted odds ratio, 4.931; 95% confidence interval, 1.320 to 18.416; P =0.018)을 확인할 수 있었다.

2. 신생아의 임상적 특성과 이환율

신생아의 재태 연령 중간값은 저체중 산모군, 정상체중 산모군, 과체중 혹은 비만 산모군 각각에서 29+6주, 29+4주, 28+5주로 과체중 혹은 비만 산모군에서 유의하게 낮은 것을 확인할 수 있었다(P =0.001). 이에 따라 재태 연령이 28주 미만인 초극소 미숙아의 비율이 세 군에서 각각 16.7%, 24.5%, 46.7%로 임신 전 체질량지수가 큰 군일수록 유의하게 높아지는 양상을 보였다(P =0.006). 출생체중은, 임신 전 체질량지수가 큰 군일수록 재태 연령이 낮아짐에 따라 함께 작아지는 경향을 보였으나, 성별, 재태 연령을 보정한 값인 출생체중 z-score는 세 군에서 각각 -1.03, -0.64, -0.10으로 유의하게 높아지는 것을 알 수 있었다. 출생 시 몸길이 또한 체중과 비슷하게 임신 전 체질량지수가 큰 군일수록 유의하게 짧아지는 경향을 보였으나, 몸길이 z-score는 세 군에서 각각 -0.74, -0.63, 0.06으로 유의하게 높아지는 것을 알 수 있었다. 두위 z-score에서는 이런 유의성을 보이지 않았다(Table 2). 임신 전 체질량지수와 신생아의 재태 연령, 출생체중 z-score, 출생 시 몸길이 z-score의 상관성을 보기 위해 선형회귀분석을 하였을 때, 재태 연령과는 유의한 음의 상관관계를, 출생체중 및 출생 시 몸길이 z-score와는 유의한 양의 상관관계를 보임을 알 수 있었으며(Figures 1, 2), 산모의 분만 시 연령, 전자간증, 임신성 당뇨, 임신 중 체중 증가 비율(%)로 보정하였을 때도 이러한 상관성은 지속됨을 확인하였다(Table 3).
신생아의 이환율과 관련하여, 부당 경량아 비율은 산모의 임신 전 체질량지수가 낮은 군일수록 유의하게 높아지는 양상을 보였으며(각각 40.0%, 23.6%, 6.7%; P =0.03), 부당 중량아 비율은 세 군 간에 유의한 차이가 없었다. 2기 이상의 괴사성 장염 비율은 저체중 산모군에서 16.7%로, 다른 군에 비해 유의하게 높은 양상을 보였으며, 3기 이상의 미숙아 망막증은 과체중 혹은 비만 산모군에서 13.5%로 유의하게 높은 양상을 보였다. 그 외 다른 신생아 이환율은 세 군 간에 유의한 차이를 보이지 않았다(Table 2). 임신 전 체질량지수와 신생아의 부당 경량아 간의 상관성을 보기 위해 산모의 분만 시 나이, 전자간증, 임신성 당뇨, 임신 중 체중 증가 비율(%)로 보정한 다항 로지스틱 회귀분석을 시행하였을 때, 저체중 산모군은 부당 경량아의 위험도를 2.958배 높이며, 과체중 혹은 비만 산모군은 위험도를 0.149배 낮추는 것을 확인하였다. 신생아의 장기 합병증 중, 단변량 분석에서 유의한 차이를 보인 2기 이상의 괴사성 장염과 3기 이상의 미숙아 망막증에 대해 임신 전 체질량지수가 미치는 영향을 확인하기 위해 2가지 모델로 다항 로지스틱 회귀분석을 시행하였다. 첫 번째 모델로 위의 부당 경량아 분석 시 사용한 보정 인자에 산전 부신피질호르몬 투여, 성별, 재태 연령, 출생체중, 부당 경량아를 추가하여 보정하였을 때, 저체중 산모군에서 2기 이상의 괴사성 장염 위험도가 11.473배로 유의하게 높았으며, 과체중 혹은 비만 산모군에서 3기 이상의 미숙아 망막증 위험도가 9.366배로 유의하게 높았다. 이들의 보정 인자에, 장기 합병증에 영향을 미칠 수 있는 신생아의 출생 후 임상적 특성을 추가하여 보정한 두 번째 모델에서는, 2기 이상의 괴사성 장염에 대해서는 통계학적 유의성이 없었으나, 3기 이상의 미숙아 망막증에 대해서는 위험도가 9.546배로 여전히 유의하게 높은 것을 확인하였다(Table 4).

고찰

이번 연구에서는 단태아로 출생한 극소 저체중 출생아를 대상으로 산모의 임신 전 체질량지수가 산모 및 신생아에 미치는 영향을 확인하였다. 임신 전 체질량지수가 과체중 혹은 비만인 산모군에서 임신성 당뇨의 위험도가 높았다. 산모의 임신 전 체질량지수는 재태 연령과는 음의 상관관계를, 출생체중 및 출생 시 몸길이 z-score와는 양의 상관관계를 보였으며, 저체중 산모군에서 부당 경량아의 위험도가 높았고, 과체중 혹은 비만 산모군에서 중증 미숙아 망막증의 위험도가 높았다.
본 연구에서 과체중 혹은 비만 산모군의 경우, 임신성 당뇨의 위험도가 높아짐을 확인하였다. Chu 등[14]이 보고한 메타분석 연구에서, 임신성 당뇨의 위험도가 정상체중 산모군에 비해 과체중 산모군에서는 2.14배, 비만 산모군에서는 3.56배, 중증 비만 산모군에서는 8.56배 증가한다고 보고하였는데, 이는 본 연구에서 과체중 혹은 비만 산모군을 합하여 계산된 4.931배와 유사한 정도이다. 산모가 비만, 임신성 당뇨에 이환된 경우, 태아 거대아의 위험성이 높아지며[15,16], 이것은 신생아의 지방 비율 및 체지방량 증가와 연관되어 장기적으로 소아 비만, 더 나아가 제2형 당뇨와 심혈관계 질환의 위험성을 높일 수 있다. 따라서 임신 전 과체중 혹은 비만인 산모에서 임신성 당뇨에 이환되었을 경우, 산전 신생아의 적극적인 모니터링 및 출생 후의 생활 습관 개선 등을 통하여 장기적인 합병증을 예방하려는 노력이 필요하다.
기존의 여러 연구에서 산모의 과체중 혹은 비만 상태가 미숙아분만과 연관이 된다는 결론을 내리고 있다[17-19]. 본 연구에서도 과체중 혹은 비만 산모군에서 재태 연령이 유의하게 낮았으며, 특히 재태 연령 28주 미만의 초극소 미숙아 비율이 유의하게 높은 것을 확인할 수 있었다. 또한 산모의 임신 전 체질량지수가 높아질수록 재태 연령이 낮아지는 음의 상관관계가 있음을 확인하였고, 이것은 산모의 연령, 전자간증, 임신성 당뇨, 임신 중 산모의 체중 증가 비율을 보정했을 때에도 마찬가지였다. 이와 같은 결론을 설명할 수 있는 기전으로, 비만 산모에게서 보이는 경한 정도의 염증 상태를 들 수 있다. 기존의 여러 연구에서 산모의 비만은 만성적인 낮은 정도의 체내 염증 상태와 연관되어 있으며, 인터루킨-6 (interleukin-6, IL-6), IL-8, C-반응단백질(CRP), 종양괴사인자-α(tumor necrosis factor-α, TNF-α) 등 전염증성 사이토카인이 유의하게 증가되어 있음을 언급하고 있다[20-22]. 이것이 자궁근층의 수축과 양막의 약화를 통해 조산을 유도할 수 있다. 그 외에도 비만과 연관된 인슐린 저항성이 염증 표지자 및 전염증성 사이토카인을 증가시키는 것, 비만 산모에서 융모양막염의 중요한 원인인 비뇨생식기계 감염이 많은 것, 그리고 이런 산모가 감염에 더 취약한 것 등이 가능한 기전으로 언급되고 있다[17].
임신 전 체질량지수와 부당 경량아의 연관성에 대한 기존 연구에서는, 본 연구 결과와 마찬가지로 저체중 산모군에서 부당 경량아가 많으며, 임신 전 체질량지수가 높아질수록 부당 경량아의 위험이 감소한다는 결론이 많다[2,23-25]. 하지만 대부분 미숙아와 만삭아의 구분이 모호하며 서양인을 대상으로 한 연구들이 많다. 대상자군이 동양인인 연구로 2016년 Zhang 등[26]이 보고한 연구에서는 만삭아의 경우, 본 연구와 비슷한 결론으로 부당 경량아의 위험이 저체중 산모군에서는 높아지며, 과체중 산모군에서는 낮아지는 것으로 보고하였다. 하지만, 미숙아를 따로 분석하였을 때는 저체중 산모군이 아닌 과체중 산모군에서 부당 경량아의 위험성이 높아짐을 언급하였다. 이 연구의 경우, 미숙아의 기준을 37주 미만 출생아로 하여 출생체중 1,500 g 미만을 대상으로 한 본 연구와 대상자가 다르며, 과체중 산모군의 기준 또한 임신 전 체질량지수가 23 kg/m2 이상인 경우로 정의한 본 연구와 달리 24 kg/m2 이상인 경우로 정의하여, 상반된 결론이 났을 가능성이 있다. 아직까지 극소 저체중 출생아만을 대상으로 하여 산모의 임신 전 체질량지수가 부당 경량아에 미치는 영향에 대한 국내외 논문이 없는 실정으로, 본 논문이 가지는 의의가 크다고 하겠다.
본 연구에서는 임신 전 체질량지수가 신생아의 출생 시 체중 및 몸 길이 z-score와 양의 상관관계를 가짐을 확인하였다. 기존 연구에서 임신 중 산모의 체중 증가가 신생아의 성장에 영향을 미친다는 보고들이 많으며, Sridhar 등[27]의 연구에서는 특히 임신 2, 3분기 동안의 산모의 체중 증가가 신생아의 성장과 더 긴밀히 연관되어 있음에 대해 언급하였다. 본 연구의 경우는, 극소 저체중 출생아만을 대상으로 하였으며, 각 군당 재태 연령의 중간값이 28-29주이기에, 대부분의 산모가 임신 2분기 말에서 3분기 초에 분만을 한 경우이다. 하지만 본 연구에서는 오히려 임신 전 체질량지수가 큰 군에서 절대적인 체중 증가 및 체중 증가 비율이 낮았음에도 불구하고 z-score가 유의하게 높았으며, 산모의 체중 증가 비율을 보정한 상태에서도 임신 전 체질량지수가 클수록 출생 시 체중 및 몸길이 z-score가 증가하는 양상을 보였다. 따라서 임신 중의 체중 증가 정도와 상관없이 산모의 임신 전 체질량지수 자체가 신생아의 키, 체중에 영향을 줄 수 있기에 임신을 계획하는 경우 산전 체중 조절을 통한 관리가 중요하다.
산모의 임신 전 체질량지수가 미숙아의 합병증과 연관된다는 결론은 아직까지 많지 않다. 최근 발표된 Pai 등[28]의 연구에서 산모의 임신 전 비만이 뇌실내출혈과 연관이 있다는 언급이 있었지만, 이 또한 재태 연령으로 보정하였을 때 유의한 차이를 보이지 않음으로써 임신 전 비만 자체보다는 그것이 재태 연령에 미치는 영향 때문일 가능성을 시사하였다. 본 연구의 단변량 분석에서 산모의 임신 전 저체중이 신생아 괴사성 장염과 연관이 있을 수 있다는 결과를 보였고, 산전 요인, 재태 연령과 체중을 포함하는 신생아의 기본적 특성을 보정한 로지스틱 회귀 분석에서도 유의한 연관성을 보였다. 하지만, 신생아 괴사성 장염에 영향을 미칠 수 있는 출생 후 신생아의 임상적 특성을 추가하여 보정했을 때, 임신 전 체질량지수와 괴사성 장염 간에 유의한 연관성이 없음을 확인하였다. 이를 통해 신생아 괴사성 장염이 임신 전 저체중 자체보다는 이에 영향을 받은 출생 후 신생아의 임상적 특성과 연관성이 큼을 확인할 수 있었다. 또 다른 미숙아 합병증으로, 산모의 과체중 혹은 비만 상태가 3기 이상의 미숙아 망막증 위험도를 높이는 것을 확인할 수 있었다. 산전 요인, 신생아의 기본적 특성뿐 아니라 출생 후 신생아의 임상적 특성을 보정했을 때에도 임신 전 과체중 혹은 비만이 미숙아 망막증과 유의한 연관성을 보였다. 산모의 비만은 앞서 언급된 바와 같이 만성적인 낮은 정도의 체내 염증 상태와 연관되어 전염증성 사이토카인이 유의하게 증가되어 있다[20-22]. 이러한 산모의 염증 상태는 태아의 염증 프로파일에도 영향을 미쳐 신생아 체내 염증 지표를 증가시킬 수 있다[29-31]. 생후 1달 이내 신생아의 증가된 전염증성 사이토카인들이 추후 미숙아 망막증의 발병 위험성을 높인다는 연구[32]를 통해서도 알 수 있듯이 이러한 염증 반응이 미숙아 망막증의 중요한 유발 기전이 될 수 있으며, 비만 산모의 염증 상태가 미숙아 망막증의 위험성을 높일 가능성이 있음을 시사한다. 산모의 임신 전 체질량지수와 신생아 합병증에 대한 이러한 연관성은 본 연구를 통해 처음으로 언급된바, 추후 동물 실험 및 대규모 임상 연구 등 추가적인 연구를 통한 확인이 필요하다.
본 연구는 몇 가지 제한점을 가지고 있다. 첫째, 후향적 연구이며 연구 대상자 수가 적어 결과의 해석에 제한이 있을 수 있다. 둘째, 연구에 포함된 산모 중 체질량지수가 25 kg/m2를 초과하는 비만 군에 속하는 산모의 수가 적어 과체중군과 비만군의 산모를 하나의 군으로 분석함으로써 두 군 간의 차이는 확인할 수 없었다. 셋째, 임신 기간을 다 채우지 못한 극소 저체중 출생아만을 대상으로 하였고 임신 중 체중 증가 속도를 확인하지 못해 Institute of Medicine에서 제시하는 임신 중 체중 증가의 적정성[33] 여부는 판단하지 못하였다.
결론적으로, 이번 연구에서는 극소 저체중 출생아에서 산모의 임신 전 체질량지수는 재태 연령과는 음의 상관관계를, 출생체중 및 출생 시 몸길이 z-score와는 양의 상관관계를 보였으며, 저체중 산모군에서 부당 경량아의 위험도가 높았고, 과체중 혹은 비만 산모군에서 중증 미숙아 망막증의 위험도가 높았음을 확인하였다.

REFERENCES

1. Dzakpasu S, Fahey J, Kirby RS, Tough SC, Chalmers B, Heaman MI, et al. Contribution of prepregnancy body mass index and gestational weight gain to adverse neonatal outcomes: population attributable fractions for Canada. BMC Pregnancy Childbirth. 2015; 15:21.
2. Shin D, Song WO. Prepregnancy body mass index is an independent risk factor for gestational hypertension, gestational diabetes, preterm labor, and small- and large-for-gestationalage infants. J Matern Fetal Neonatal Med. 2015; 28:1679–86.
3. Flenady V, Koopmans L, Middleton P, Froen JF, Smith GC, Gibbons K, et al. Major risk factors for stillbirth in high-income countries: a systematic review and meta-analysis. Lancet. 2011; 377:1331–40.
4. McDonald SD, Han Z, Mulla S, Beyene J; Knowledge Synthesis Group. Overweight and obesity in mothers and risk of preterm birth and low birth weight infants: systematic review and metaanalyses. BMJ. 2010; 341:c3428.
5. Han Z, Mulla S, Beyene J, Liao G, McDonald SD; Knowledge Synthesis Group. Maternal underweight and the risk of preterm birth and low birth weight: a systematic review and metaanalyses. Int J Epidemiol. 2011; 40:65–101.
6. Heaman M, Kingston D, Chalmers B, Sauve R, Lee L, Young D. Risk factors for preterm birth and small-for-gestational-age births among Canadian women. Paediatr Perinat Epidemiol. 2013; 27:54–61.
7. Bruno CJ, Locke R, Mackley A, Paul DA. The association between maternal body mass index and severity of neonatal illness in very low birth weight infants. J Matern Fetal Neonatal Med. 2009; 22:560–4.
8. World Health Organization Western Pacific Region; International Association for the Study of Obesity. International Obesity Task Force. The Asia-Pacific perspective: redefining obesity and its treatment. Sydney: Health Communications Australia Pty Limited;2000.
9. Fenton TR, Kim JH. A systematic review and meta-analysis to revise the Fenton growth chart for preterm infants. BMC Pediatr. 2013; 13:59.
10. Bell MJ, Ternberg JL, Feigin RD, Keating JP, Marshall R, Barton L, et al. Neonatal necrotizing enterocolitis. Therapeutic decisions based upon clinical staging. Ann Surg. 1978; 187:1–7.
11. Jobe AH, Bancalari E. Bronchopulmonary dysplasia. Am J Respir Crit Care Med. 2001; 163:1723–9.
12. Papile LA, Burstein J, Burstein R, Koffler H. Incidence and evolution of subependymal and intraventricular hemorrhage: a study of infants with birth weights less than 1,500 gm. J Pediatr. 1978; 92:529–34.
13. The International Committee for the Classification of the Late Stages of Retinopathy of Prematurity. An international classification of retinopathy of prematurity. II. The classification of retinal detachment. Arch Ophthalmol. 1987; 105:906–12.
14. Chu SY, Callaghan WM, Kim SY, Schmid CH, Lau J, England LJ, et al. Maternal obesity and risk of gestational diabetes mellitus. Diabetes Care. 2007; 30:2070–6.
15. Ovesen PG, Jensen DM, Damm P, Rasmussen S, Kesmodel US. Maternal and neonatal outcomes in pregnancies complicated by gestational diabetes. a nation-wide study. J Matern Fetal Neonatal Med. 2015; 28:1720–4.
16. Santangeli L, Sattar N, Huda SS. Impact of maternal obesity on perinatal and childhood outcomes. Best Pract Res Clin Obstet Gynaecol. 2015; 29:438–48.
17. Sung SJ, Lee SM, Kim S, Kim BJ, Park CW, Park JS, et al. The risk of spontaneous preterm birth according to maternal prepregnancy body mass index in twin gestations. J Korean Med Sci. 2018; 33:e103.
18. Cnattingius S, Villamor E, Johansson S, Edstedt Bonamy AK, Persson M, Wikstrom AK, et al. Maternal obesity and risk of preterm delivery. JAMA. 2013; 309:2362–70.
19. Al-Obaidly S, Parrish J, Murphy KE, Maxwell C. Maternal pre-gravid body mass index and obstetric outcomes in twin gestations. J Perinatol. 2014; 34:425–8.
20. Gregor MF, Hotamisligil GS. Inflammatory mechanisms in obesity. Annu Rev Immunol. 2011; 29:415–45.
21. Aye IL, Lager S, Ramirez VI, Gaccioli F, Dudley DJ, Jansson T, et al. Increasing maternal body mass index is associated with systemic inflammation in the mother and the activation of distinct placental inflammatory pathways. Biol Reprod. 2014; 90:129.
22. Christian LM, Porter K. Longitudinal changes in serum proinflammatory markers across pregnancy and postpartum: effects of maternal body mass index. Cytokine. 2014; 70:134–40.
23. Nohr EA, Vaeth M, Baker JL, Sorensen TIa, Olsen J, Rasmussen KM. Combined associations of prepregnancy body mass index and gestational weight gain with the outcome of pregnancy. Am J Clin Nutr. 2008; 87:1750–9.
24. Yu Z, Han S, Zhu J, Sun X, Ji C, Guo X. Pre-pregnancy body mass index in relation to infant birth weight and offspring overweight/obesity: a systematic review and meta-analysis. PLoS One. 2013; 8:e61627.
25. Abenhaim HA, Kinch RA, Morin L, Benjamin A, Usher R. Effect of prepregnancy body mass index categories on obstetrical and neonatal outcomes. Arch Gynecol Obstet. 2007; 275:39–43.
26. Zhang B, Yang S, Yang R, Wang J, Liang S, Hu R, et al. Maternal prepregnancy body mass index and small for gestational age births in Chinese women. Paediatr Perinat Epidemiol. 2016; 30:550–4.
27. Sridhar SB, Xu F, Hedderson MM. Trimester-specific gestational weight gain and infant size for gestational age. PLoS One. 2016; 11:e0159500.
28. Pai VV, Carmichael SL, Kan P, Leonard SA, Lee HC. Maternal body mass index and risk of intraventricular hemorrhage in preterm infants. Pediatr Res. 2018; 83:1146–51.
29. Pantham P, Aye IL, Powell TL. Inflammation in maternal obesity and gestational diabetes mellitus. Placenta. 2015; 36:709–15.
30. Segovia SA, Vickers MH, Gray C, Reynolds CM. Maternal obesity, inflammation, and developmental programming. Biomed Res Int. 2014; 2014:418975.
31. Oben JA, Mouralidarane A, Samuelsson AM, Matthews PJ, Morgan ML, McKee C, et al. Maternal obesity during pregnancy and lactation programs the development of offspring non-alcoholic fatty liver disease in mice. J Hepatol. 2010; 52:913–20.
32. Holm M, Morken TS, Fichorova RN, VanderVeen DK, Allred EN, Dammann O, et al. Systemic inflammation-associated proteins and retinopathy of prematurity in infants born before the 28th week of gestation. Invest Ophthalmol Vis Sci. 2017; 58:6419–28.
33. Institute of Medicine and National Research Council. Weight gain during pregnancy: reexamining the guidelines. Washington, DC: The National Academies Press;2009.

Figure 1.
Pre-pregnancy body mass index (BMI) showed a negative correlation with gestational age.
nm-2018-25-3-118f1.tif
Figure 2.
Pre-pregnancy body mass index (BMI) showed a positive correlation with z-score of birth weight (A) and body length (B).
nm-2018-25-3-118f2.tif
Table 1.
Maternal Characteristics and Morbidities according to Pre-pregnancy BMI
Characteristics Pre-pregnancy BMI
Underweight (n=30) Normal (n=106) Overweight or obese (n=45) P-value
Age (yr) 33 (30-35) 34 (31-36) 33 (30-37) 0.265
 ≥35 yr 8 (26.7) 45 (42.5) 19 (42.2) 0.275
Multiparity 7 (23.3) 19 (17.9) 12 (26.7) 0.455
Smoking 0 0 0
Cesarean section 22 (73.3) 90 (84.9) 36 (80.0) 0.329
Breech presentation 5 (16.7) 35 (33.0) 12 (26.7) 0.204
Antenatal corticosteroids use 17 (56.7) 67 (63.2) 29 (64.4) 0.767
Artificial reproductive technique 2 (6.7) 13 (12.3) 8 (17.8) 0.359
Body weight (kg)
 Pre-pregnancy 46.0 (42.8-48.2) 52.0 (50.0-56.3) 65.0 (61.0-70.5) <0.001
 At delivery 54.3 (49.6-59.4) 62.6 (59.0-66.0) 73.0 (67.8-78.0) <0.001
 Gain 8.7 (6.0-13.1) 9.0 (6.5-12.1) 5.5 (4.0-10.5) 0.016
 % Gain 18.7 (14.3-27.8) 17.4 (11.8-25.0) 8.9 (5.8-16.6) <0.001
BMI (kg/m2)
 Pre-pregnancy 17.8 (17.1-18.2) 20.5 (19.5-21.4) 25.2 (24.3-26.9) <0.001
 At delivery 20.9 (19.6-22.4) 24.2 (23.0-25.6) 28.3 (27.1-30.3) <0.001
 Gain 3.3 (2.4-5.0) 3.6 (2.5-4.9) 2.4 (1.5-4.0) 0.015
 % Gain 18.7 (14.3-27.8) 17.4 (11.8-25.0) 8.9 (5.8-16.6) <0.001
Preterm labor 13 (43.3) 50 (47.2) 27 (60.0) 0.263
Preterm premature rupture of membrane >18 hr 9 (30.0) 36 (34.0) 16 (35.6) 0.880
Preeclampsia 7 (23.3) 43 (40.6) 18 (40.0) 0.211
GDM 2 (6.7) 4 (3.8) 9 (20.0) 0.004

Values are expressed as median (interquartile range) or number (%).

Abbreviations: BMI, body mass index; GDM, gestational diabetes mellitus.

Table 2.
Neonatal Characteristics and Outcomes according to Pre-pregnancy BMI
Characteristics Pre-pregnancy BMI
Underweight (n=30) Normal (n=106) Overweight or obese (n=45) P-value
Male sex 20 (66.7) 46 (43.4) 29 (64.4) 0.014
Gestational age (wk) 29+6 (28+4 to 32+1) 29+4 (28+1 to 31+3) 28+5 (26+3 to 20+0) 0.001
 <28 wk 5 (16.7) 26 (24.5) 21 (46.7) 0.006
Birth weight (g) 1,220 (1,025 to 1,445) 1,155 (958 to 1,310) 1,010 (820 to 1,295) 0.028
 <1,000 g 6 (20.0) 26 (24.5) 21 (46.7) 0.011
Birth weight z-score -1.03 (-1.66 to 0.42) -0.64 (-1.29 to 0.25) -0.10 (-0.61 to 0.67) 0.003
Head circumference (cm) 27.0 (25.8 to 28.4) 27.0 (25.0 to 28.0) 25.5 (23.8 to 27.5) 0.005
Head circumference z-score -0.60 (-1.43 to 0.73) -0.38 (-0.92 to 0.32) 0.00 (-0.95 to 0.74) 0.162
Body length (cm) 38.9 (37.0 to 40.3) 37.4 (35.5 to 39.0) 36.5 (34.0 to 39.0) 0.015
Body length z-score -0.74 (-1.21 to 0.60) -0.63 (-1.34 to 0.21) 0.06 (-0.65 to 0.50) 0.018
Apgar score at 5 min <7 12 (40.0) 54 (50.9) 25 (55.6) 0.409
SGA 12 (40.0) 25 (23.6) 3 (6.7) 0.003
LGA 1 (3.3) 3 (2.8) 4 (8.9) 0.241
Treated PDA, no./total no. 7/30 (23.3) 27/105 (25.7) 14/41 (34.1) 0.512
Sepsis, no./total no. 8/30 (26.7) 21/106 (19.8) 6/44 (13.6) 0.376
Duration of respiratory support (d) 10 (4 to 29) 15 (6 to 39) 22 (9 to 44) 0.081
Number of blood infusion* 1 (1 to 2) 2 (0 to 4) 2 (0 to 3) 0.872
Duration of TPN infusion (d) 23 (15 to 31) 21 (14 to 35) 27(16 to 38) 0.600
NEC stage >2, no./total no. 5/30 (16.7) 4/105 (3.8) 3/42 (7.1) 0.047
Moderate to severe BPD, no./total no. 3/26 (11.5) 13/97 (13.4) 5/37 (13.5) 0.966
IVH grade >3, no./total no. 1/29 (3.4) 5/103 (4.9) 1/43 (2.3) 0.766
Cystic PVL, no./total no. 1/29 (3.4) 5/103 (4.9) 3/43 (7.0) 0.785
ROP stage >3, no./total no. 2/26 (7.7) 2/95 (2.1) 5/37 (13.5) 0.035
EUGR, no./total no. 20/30 (66.7) 72/104 (69.2) 25/45 (55.6) 0.270
Death 2 (6.7) 7 (6.6) 3 (6.7) 1.000
PMA at discharge (wk) 38+1 (36+0 to 39+4) 38+0 (36+4 to 39+6) 37+5 (35+4 to 38+4) 0.205
Changes of body weight z-score during hospitalization -1.20 (-1.98 to -0.69) -1.18 (-2.07 to -0.71) -1.54 (-2.05 to -0.67) 0.849
Duration of hospitalization (d) 51 (32 to 70) 55 (38 to 71) 61 (46 to 73) 0.302

Values are expressed as number (%) or median (interquartile range).

* Data were available for 29 infants in the underweight group, 103 infants in the normal weight group, and 42 infants in the overweight or obese group;

Data were available for 28 infants in the underweight group, 98 infants in the normal weight group, and 41 infants in the overweight or obese group;

Data were available for 30 infants in the underweight group, 105 infants in the normal weight group, and 45 infants in the overweight or obese group.

Abbreviations: BMI, body mass index; SGA, small for gestational age; LGA, large for gestational age; PDA, patent ductus arteriosus; TPN, total parenteral nutrition; NEC, necrotizing enterocolitis; BPD, bronchopulmonary dysplasia; IVH, intraventricular hemorrhage; PVL, periventricular leukomalacia; ROP, retinopathy of prematurity; EUGR, extrauterine growth retardation; PMA, post-menstrual age.

Table 3.
Linear Correlation between Gestational Age, Birth Weight z-Score, Body Length z-Score, and Pre-pregnancy BMI
Pre-pregnancy BMI (kg/m2)
B SE P-value
Gestational age (wk) -0.501 0.218 0.023*
Birth weight z-score 0.212 0.088 0.017*
Body length z-score 0.224 0.099 0.026*

* Adjusted for maternal age, preeclampsia, gestational diabetes mellitus, maternal weight gain (%).

Abbreviation: BMI, body mass index.

Table 4.
Estimated OR and 95% CI of Neonatal Outcomes according to Pre-pregnancy BMI
Pre-pregnancy BMI OR (95% CI)
Unadjusted model Adjusted model 1 Adjusted model 2
SGA
 Underweight 2.160 (0.917-5.090) 2.958 (1.113-7.864)*
 Normal Reference Reference
Overweight or obese 0.231 (0.066-0.811) 0.149 (0.033-0.679)*
NEC≥stage 2
 Underweight 5.050 (1.263-20.189) 11.473 (1.548-85.028) 10.274 (0.813-129.753)
 Normal Reference Reference Reference
 Overweight or obese 1.942 (0.416-9.077) 1.187 (0.150-9.381) 0.217 (0.007-6.745)
ROP≥stage 3
 Underweight 3.875 (0.519-28.940) 6.999 (0.608-80.549) 6.242 (0.457-85.160)
 Normal Reference Reference Reference
 Overweight or obese 7.266 (1.343-39.309) 9.366 (1.339-65.523) 9.546 (1.230-74.109)

* Adjusted for maternal age, preeclampsia, gestational diabetes mellitus, and maternal weight gain (%);

Adjusted for maternal age, preeclampsia, gesta-tional diabetes mellitus, maternal weight gain (%), antenatal corticosteroids use, sex, gestational age, birth weight, and SGA;

Adjusted for maternal age, preeclampsia, gestational diabetes mellitus, maternal weight gain (%), antenatal corticosteroids use, sex, gestational age, birth weight, SGA, treat-ed patent ductus arteriosus, duration of respiratory support, number of blood infusion, and sepsis.

Abbreviations: OR, odds ratio; CI, confidence interval; BMI, body mass index; SGA, small for gestational age; NEC, necrotizing enterocolitis; ROP, retinopathy of prematurity.

TOOLS
Similar articles