

 PDF
PDF Citation
 Print
Print


INTRODUCTION
Falls are one of the leading causes of hospitalization and premature death, accounting for most of the disability due to unintentional injuries in the older population.1 The substantial burden of falls appears to be a global phenomenon as per the Global Burden of Diseases, Injuries and Risk Factors Study of 2017, and falls are the second leading cause of mortality owing to unintentional injuries.2 Additionally, in Korea, disability-adjusted life years (DALY) and years lived with disability (YLD) due to falls are higher as compared to those for other injuries, and DALY and YLD due to falls show increasing trends.3 In the older population, demographic factors, gait disturbance, impaired vision, dizziness, impaired cognition, and cardiovascular disease have been suggested as individual risk factors for falls.4
A variety of adverse health outcomes can be attributed to ambient air pollutants. Particulate matter (PM), particles with diameters of 10 microns or less, is a common proxy indicator of air pollutants and is known to have the greatest impact on human health among the causes of air pollution.5 Previous studies have reported associations between exposure to air pollutants and respiratory disease, cardiovascular morbidity and mortality, and cognitive decline.67 The accumulation of small particles that are not filtered out by barriers present in the respiratory tract may cause a pulmonary or systemic inflammatory response.8 The exposure to PM can contribute to falls at the proximal level because it is associated with the individual-level risk factors of falls.
The fundamental goal of healthcare activity is equality across different socioeconomic groups and geographical areas. Therefore, investigating the inequality of health outcomes and related factors is important. However, a traditional approach to estimate the difference between group health outcomes, mostly represented as averages, may connote the risk of erroneous estimates of regional differences because the method does not consider individual-level heterogeneity.9 Especially in the case of PM, the exposure can be measured and the intervention can be applied at the regional level. Therefore, the size of the regional difference and the effect of the risk factors should be considered simultaneously in terms of primary prevention.
Previous studies have suggested that the PM levels may be associated with the risk of falls or related health outcomes. In a multilevel analysis conducted in six middle- or low-income countries, the three-year PM2.5 concentration was positively associated with fall-related injuries. 1 However, this study did not include comorbidities at the individual level and confounders at the regional level; therefore, the air pollutant levels may act as a proxy for other environmental factors. In Korea, in a study on the association between air quality and hip fracture, PM10 was positively associated, while others were not, with hip fracture.10 A study in seven cities of Korea found that the levels of air pollutants such as SO2, CO, and NO2 were positively associated with death by unintentional injury, most of which were caused by falls. Moreover, PM levels did not show a significant association with unintentional injury deaths.11 These results reflected neither a direct association nor regional differences.
In the present study, we analyzed the association between air pollutant levels and falls and investigated the variation of falls between regions and how much of the variation was explained by air pollutant levels.
METHODS
Study participants
The participants of Korean Community Health Survey (KCHS), conducted by the Korea Centers for Disease Control and Prevention in 2019, were included in this study. The KCHS was a nationwide survey to investigate health statistics for adults aged 19 and over by regional district.12 In 229,099 participants of 2019 KCHS, 11,519 subjects of 13 districts that did not have an air quality monitoring station or did not measure PM10 or PM2.5 were excluded. Furthermore, 13,185 subjects who had missing values in covariates were excluded. Finally, 204,395 participants (139,971 participants aged under 65 and 64,424 participants aged 65 or over) from 237 municipal districts were included in the analysis.
Variables
Data on age, sex, marital status, education status, household income, drinking, smoking, physical activity, categorized BMI, depressive symptoms, cognitive impairment, diabetes, hypertension, urban forest area ratio, urban forest of life zone per capita, population density, PM10, and PM2.5 were included in the analysis. All the covariates were obtained from the KCHS dataset. Marital status was classified into married, unmarried, and others. Education status was defined as public education lasting > 9 years. Household income was measured with questionnaires, and the household income quartiles were defined by dividing the household incomes of all the participants into four quartiles. Drinking status was categorized as never drinker, former drinker, occasional drinker, and current drinker. Subjects who had never consumed alcohol in their lifetime were categorized as never drinker, and those who had a history of drinking, but did not currently drink were categorized as former drinkers. Among the participants who were currently consuming alcohol, those who drank at a frequency of less than once a month were categorized as occasional drinkers, and those who drank at a higher frequency were categorized as current drinkers. Smoking status was classified into never smoker, former smoker, and current smoker according to whether the participants were currently smoking and whether they had smoked in their lifetime. Physical activity was defined as walking for at least 5 days a week and for 30 minutes or more at a time. BMI was calculated with the heights and weights, and subjects were divided into four groups: underweight, normal weight, overweight, and obesity.13 Depressive symptoms were measured using the Korean version of the Patient Health Questionnaire-9 (PHQ-9) which is a simple screening tool for depression.14 Presence of depressive symptoms was defined as a score of 10 or higher on the PHQ-9. Cognitive impairment was defined as experiencing an exacerbated memory loss or confusion. Diabetes and hypertension were determined by treatment or a previous diagnosis. Urban forest area ratio and urban forest of life zone per capita in 2019, provided by Korea Forest Service, were used as regional-level covariates, and the participants were divided into quartiles according to them. Population density data of each district was obtained from the Ministry of the Interior and Safety of Korea. For PM10 and PM2.5, data of the annual exposure of each area from the annual air quality report of 2019 provided by the ministry of environment was used. If two or more measuring stations were located in the area, the average of the values of the stations was used. More than two falls in the past 12 months was defined as the outcome using the following two questions about fall experiences as follows: “Have you fallen in the past year?” and “How many times have you fallen in the past year?”
Statistical analyses
General characteristics were presented according to the presence or absence of recurrent fall experiences, and additionally stratified according to age group. Characteristics of participants included in the analysis were shown as mean ± standard deviation or number (%). Student’s t-test and chi-square tests were used to show the significance of difference according to recurrent fall experiences. Multilevel logistic regression with individuals nested within 237 municipal districts was conducted to estimate the association between air pollutants and recurrent falls using a four-step model. The null model included only the intercept. Model 1 included individual-level variables only. Model 2 included Model 1 variables plus urban forest area ratio and urban forest area of life zone per capita and population density. Finally, in Model 3, all the individual-level and regional-level variables were included. To estimate the regional effects in the total variance of recurrent fall experiences, intra-class correlation coefficient (ICC) was calculated using the latent variable approach.15 To assess the attribution of adjusted variables to the regional variance of recurrent fall experiences, proportional change in variance (PCV) was calculated in all the models except the null model. The PCV of the model was calculated as the proportional change in the area level variance between the null model and Model 1; Model 1 and Model 2; and Model 2 and Model 3. Because the characteristics and effect of falls on overall health may vary by age, age-stratified analyses with a cutoff of 65 years were conducted. All the analyses were performed using R (ver. 4.0.2, Vienna, Austria).
Ethics statement
This study was covered under the review list pursuant to Article 2.2 of the Enforcement Rule of Bioethics and Safety Act in Korea, and the data were exempted from Institutional Review Board review (IRB no. 1040198-221208-HR-151-01). All data were fully anonymized before the data were provided.
RESULTS
Table 1 presents the characteristics of the subjects by recurrent fall experience in each age group. In total population, subjects that experienced recurrent falls were younger, had higher proportions of women, participants living alone, less educated, and had lower incomes as compared to the group who did not experience falls. Furthermore, depressive symptom, hypertension, diabetes, and abnormal BMI were more prevalent in the group that experienced recurrent falls. In young group, subjects who experienced recurrent falls had a higher proportion of urban residents, current drinkers, current smokers, hypertension, and physically active people, while in older group, subjects who experienced recurrent had lower proportion of urban residents, current drinkers, current smokers, hypertension, and physically active people. In older group, cognitive impairment was more prevalent in fall group than in normal group.
Table 1
Descriptive statistics of study participants by recurrent fall experiences
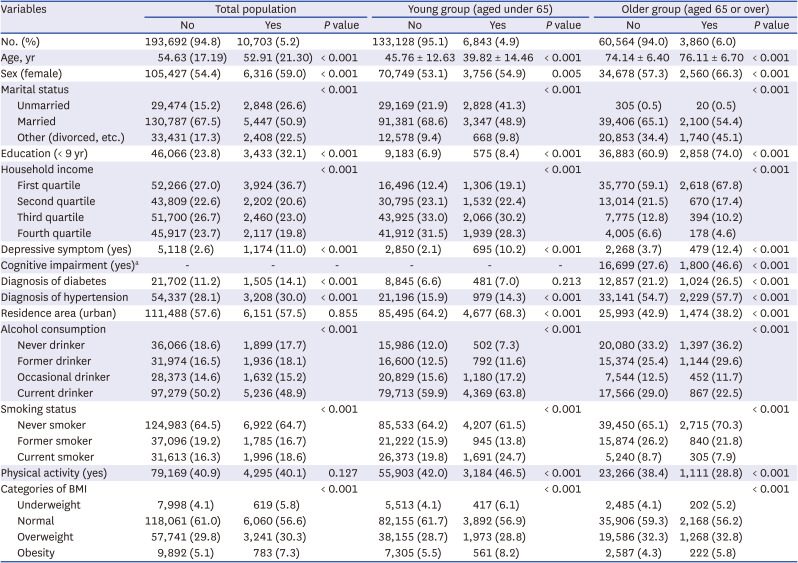
Table 2 presents the results of the multilevel analysis of recurrent fall experiences. In the null model, the proportion of variance of recurrent fall experiences explained by region was 5.00%. Individual-level variables decreased the ICC of the null model to 4.67%, and regional confounders decreased the ICC of model 1 to 4.25%. PM10 and PM2.5 levels reduced the ICC of model 2 by 4.14% and 4.11%, respectively. After adjusting for individual and urban forest variables, PM10 (odds ratio [OR], 1.131; 95% confidence interval [CI], 1.026–1.247) and PM2.5 (OR, 1.202; 95% CI, 1.051–1.374) levels increased the risk of recurrent falls significantly. PM10 and PM2.5 accounted for 2.82% and 3.33% of the unexplained regional variance in Model 2, respectively. Among the individual-level covariates included in the analysis, old age, female, unmarried, low education, low income, drinking, smoking, underweight or obesity, depressive symptom, and diabetes increased the risk of recurrent fall experiences.
Table 2
Results of the multilevel logistic regression analysis of recurrent fall experiences
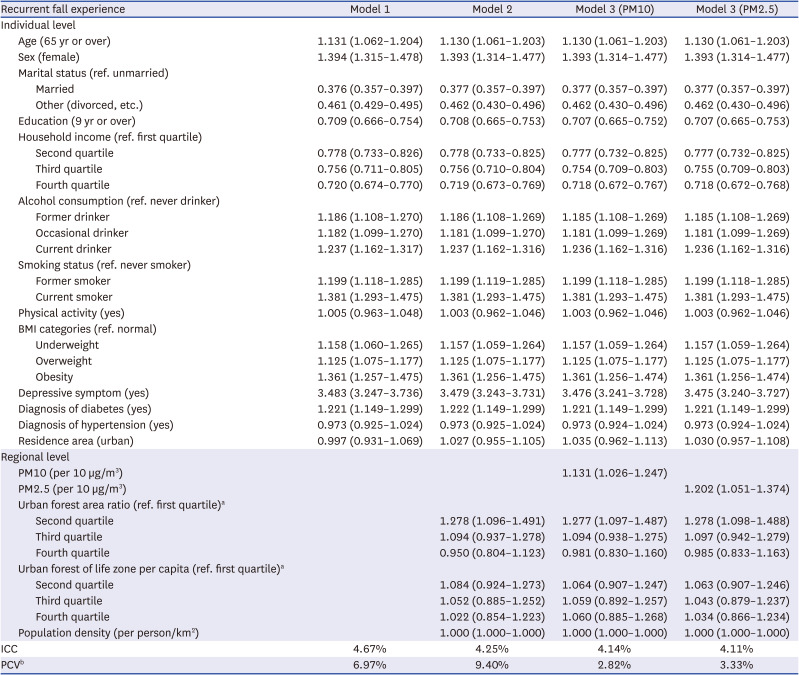
Values are presented as beta coefficients (95% confidence interval). In the null model, the ICC was 5.00%
PM = particulate matter, BMI = body mass index, ICC = intraclass correlation coefficient, PCV = proportional change in variance.
aUrban forest area ratio and urban forest of life zone per capita were acquired for 237 regions and categorized into quartiles; bThe proportional change in the area level variance between the empty model and model 1; model 1 and model 2; and, model 2 and model 3.
Tables 3 and 4 present the results of multilevel analyses in the older and younger people, respectively. In all the models, the ICC in the young group was larger than that in the older group. PM10 (OR, 1.164; 95% CI, 1.050–1.292) and PM2.5 (OR, 1.247; 95% CI, 1.081–1.438) levels were associated with recurrent falls in the older population. However, these associations were attenuated in the young (PM10 [OR, 1.081; 95% CI, 0.967–1.208]; PM2.5 [OR, 1.147; 95% CI, 0.984–1.338]). Furthermore, the PCV of model 3, the proportion of remaining regional variance of model 2 that was explained by PM, were larger in the older people (PM10: 4.73%; PM2.5: 5.27%) than that in the younger people (PM10: 0.80%; PM2.5: 1.39%). The direction of the effect of age and physical activity on recurrent falls was different depending on the age group. The risk of recurrent falls increased as age decreased in the young group and as age increased in the older group. Physical activity increased the risk of recurrent falls in the young group and decreased the risk of recurrent falls in the older group. Sex, education level, income level, smoking, diabetes, obesity and depressive symptoms were associated with an increased risk of recurrent falls in both age groups. Marital status, alcohol consumption and hypertension were associated with an increased risk of recurrent fall in the younger age group, but not in the older group.
Table 3
Results of the multilevel logistic regression analysis of recurrent fall experiences in older people (≥ 65 years)
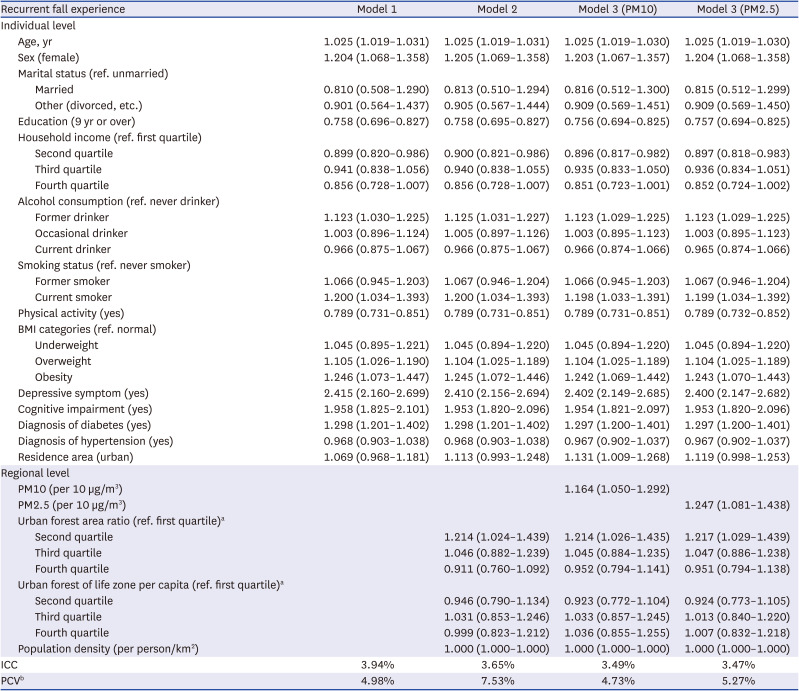
Values are presented as beta coefficients (95% confidence interval).
In the null model, the ICC was 4.14%.
PM = particulate matter, BMI = body mass index, ICC = intraclass correlation coefficient, PCV = proportional change in variance.
aUrban forest area ratio and urban forest of life zone per capita were acquired for 237 regions and categorized into quartiles; bThe proportional change in the area level variance between the empty model and model 1; model 1 and model 2; and, model 2 and model 3.
Table 4
Results of the multilevel logistic regression analysis of recurrent fall experiences in the young (< 65 years)
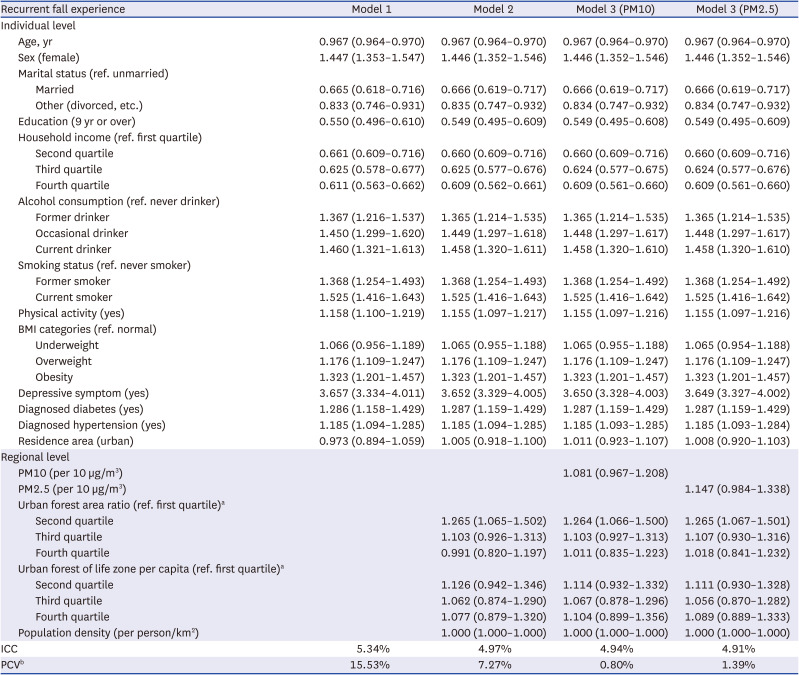
Values are presented as beta coefficients (95% confidence interval). In the null model, the ICC was 6.26%.
PM = particulate matter, BMI = body mass index, ICC = intraclass correlation coefficient, PCV = proportional change in variance.
aUrban forest area ratio and urban forest of life zone per capita were acquired for 237 regions and categorized into quartiles; bThe proportional change in the area level variance between the empty model and model 1; model 1 and model 2; and model 2 and model 3.
DISCUSSION
In the present study, PM10 or PM2.5 levels were positively associated with fall experiences in the total population after adjusting for regional-level and individual-level covariates. However, the association between PM and falls was attenuated in the young. The regional difference in recurrent falls was larger in the younger than that in the older people; however, the PM levels accounted for a larger proportion of regional variance in the older people than that in the young.
A previous multilevel analysis of participants from six countries in the SAGE study showed a positive association between long-term exposure of PM2.5 and fall-related injuries; this association was consistent with the results of our study.1 However, the results of the age-stratified analysis of this study differed from those of ours. In the SAGE study, the strength of the association between PM2.5 exposure and fall-related injury did not differ by age. This discrepancy may be due to differences in the adjusted variables in the analysis. Furthermore, there are no studies investigating the association between PM levels and falls in Korea. However, there is one study on the association between PM levels and hip fracture and one study on the association between PM levels and unintentional injury death. These studies may suggest a relationship between PM and falls because most hip fractures and unintentional injury deaths are caused by falls. A retrospective cohort study from 2011 to 2015 on air pollutants and hip fracture was conducted among participants aged ≥ 30 years using the National Health Insurance service cohort database in Korea. This study revealed positive associations between PM and hip fracture, similar to our study results.10 In contrast, a previous study on unintentional injury deaths from 2002 to 2008 in 7 metropolitan cities in Korea did not find a significant association between PM and unintentional injury deaths. This study was conducted as a time-stratified case-crossover analyses over the previous 3 days and investigated the short-term effects of PM. The differences in the study design and outcome variables may have caused the difference between the results of this study and the present one.11
In this study, the regional difference in recurrent falls was larger in the young than that in the older population. This result may be attributed to the characteristics of the falls. According to a previous study, as age increased, the proportion of indoor falls increased and the proportion of falling during vigorous physical activity decreased.16 Indoor falls are associated with worse physical function and poor health, whereas outdoor falls are associated with increased and better physical activity and above-average health.17 The subgroup analysis of young participants in the present study revealed that age and physical activity were inversely associated with falls. Falls in young participants may include a larger proportion of outdoor falls than that in the older participants; therefore, the regional disparities in recurrent falls in the young may be greater than that in the older population. On the other hand, PM levels explained the larger proportion of regional difference in the older population than that in the young, and the strength of the association between PM and falls was greater in the older population than that in the young. Previous studies have reported that the risk of PM exposure for adverse health outcomes increased with age.1819
The biological pathway explaining the induction of falls due to PM exposure has not been elucidated. However, there are some potential mechanisms. First, PM exposure can lead to impaired visual acuity and ophthalmic conditions such as eye irritation or conjunctivitis through the decreased protective function of tear film, cornea, and conjunctiva and the deterioration in the microcirculation that nourishes the retina.2021 Second, fall-related medical conditions may be attributed to systemic oxidative stress and inflammation due to pulmonary accumulation and translocation of PM to the systemic circulation. Particularly, systemic inflammation inducing impaired hemostatic and vascular function results in cardiovascular and neurologic diseases including atherosclerosis, stroke, and neurodegenerative disease. In a human study, mild cognitive impairment was associated with living along crowded roads, suggesting that chronic environmental air pollutant exposure may affect cognitive function.22 In a previous study using the SAGE dataset that showed the positive association between PM2.5 levels and fall-related injury in low- and middle-income countries, a stratified analyses was conducted by dietary antioxidant consumption, including the consumption of fruits and vegetables. In the high-consumption group, the association between PM2.5 levels and fall-related injury was attenuated as compared to that in the low-consumption group. The result suggested an oxidative stress-related mechanism between PM exposure and falls despite the limitation in terms of green leafy vegetables, and fruits intake in low- and middle-income countries as a result of socioeconomic status (SES).1
In our study, low SES, smoking, abnormal BMI, cognitive decline, depressive symptom, and diabetes were associated with increased risk of recurrent falls. These results are consistent with previous studies. SES is known as a risk factor for falls, and the association was explained by an indirect pathway through lifestyle, psychosocial effect, and resilience to sudden health changes.23 Smoking was associated with unintentional injury, because smoking decreases physical function.24 A report suggested U-shaped association between BMI and falls, because underweight may be a marker of frailty and obesity can cause poor gait and postural balance.25 Cognitive function have bidirectional relationship with falls. Falls may be the consequences of cognitive decline and also may deteriorate cognitive function. In the same way, depression may be caused by fall experience and may cause fall through exacerbating cognitive and physical function.26 Diabetes affects sensory, cognitive function and balance secondary to diabetic neuropathy.27 In our study, hypertension and alcohol consumption were associated with recurrent falls in younger age groups, but not in older age groups. Hypertension may be linked with falls as it is associated with several cardiovascular diseases. Although in older group, reduced cerebral blood flow from hypotension is also the risk factor of falls, therefore direction of association between hypertension and falls might be attenuated.28 Previous studies of association between alcohol consumption and falls reported conflicting results and usually did not find significant association in older group. This inconsistency may be accounted for protective effect of alcohol consumption to cognitive function.2930
There are some limitations worth noting in our study. First, air pollutant levels might be estimated crudely. Ambient air pollutant levels could be acquired only in the areas where the measuring stations were located in 2019, and one value was used as the representative value of the administrative region. Second, the effect of air pollutant levels on fall experiences may surrogate the effects of other unknown regional variables. Therefore, in our study, we adjusted for the urban forest variables and other regional-level variables that may be associated with the general condition and lifestyle including physical activity and effect of air pollutant on subjects. Urban forestry may mitigate PM levels in surrounding areas. At the plant level, the foliage surface can capture and accumulate PM, thus acting as a biological filter. At the canopy level, clustered plants have been reported to block PM.31 Third, our study did not measure an individual exposure level and used the annual mean levels of PM as the proxy of actual exposure levels of PM. However, previous study reported high correlations between ambient PM levels and both indoor and personal PM exposure.32 In addition, World Health Organization designates annual mean concentrations of PM as one of the indicators of the global health observatory.33 Finally, it is difficult to investigate temporal effects such as the lag time effect of PM due to the limitations of the cross-sectional study design.
In conclusion, PM concentration was associated with repeated falls even after considering other regional variables and individual-level differences. In addition, there was a regional difference in the occurrence of falls, and the PM concentration explained a part of the gap; however, the gap was explained more in the older population than in the young.
 XML Download