

 PDF
PDF Citation
 Print
Print


INTRODUCTION
Social inequalities in childhood cancer exist and socioeconomic gaps in the survival rates of children with cancer between countries are increasing.1 While social inequalities have been identified as an important causal risk factor in childhood cancer deaths and childhood cancer,234567 whether social inequalities have hindered reductions in childhood cancer deaths and whether the gaps of social inequalities increase the inequalities in the risk of childhood cancer death have not been determined. In addition, little research has been conducted on how social inequalities in childhood cancer change over time.
In Korea, while the incidence rate, as well as the prevalence, is increasing and mortality from childhood cancer is decreasing,8910 several studies related to inequalities in childhood cancer mortality according to socioeconomic position have been reported.111213 However, there are few studies on the trends in social inequalities in under-5 cancer mortality rates in Korea. Therefore, this study explored how the social inequalities in the cancer mortality of children under 5 years of age have changed over time.
The previous studies presented the effects of parents’ socioeconomic conditions1415161718 and the child’s birth conditions (low weight and premature birth)1920 on child mortality separately, few studies on the interactive effect of parental social class and low birthweight and preterm birth on under-5 cancer mortality were reported. Therefore, this study attempted to analyze how the social inequalities interact with the child’s birth conditions (low weight and premature birth) and effect on cancer deaths under the age of 5.
In addition to the socioeconomic factors of parents and the birth factors of the child, risk factors affecting cancer death under the age of 5 such as birth sex,21 parental age,22 and maternal risk factors (birth type, birth order, and interval)23 have been reported. Therefore, in this study, birth sex, parental age, maternal risk factors, and marital status were considered as covariates, by referring to variables related to death under the age of 5 in previous studies.
This study aimed to investigate trends in social inequalities in the cancer mortality rates of children under 5 years old in Korea using 1995–1999 and 2010–2014 national birth cohorts and analyze how the interactive effect between parental social class and inappropriate birth outcomes, such as lower birthweight and preterm birth, affected cancer mortality of children under 5 years of age. This study provides evidence for childhood cancer prevention policies by analyzing the social inequalities of children under the age of 5 who died of cancer.
The hypothesis of this study was that parental social class interacts with birth conditions (birthweight and gestational age), and affects cancer deaths under the age of 5. Birth conditions (birthweight and gestational age) act as intermediate factors with parental social class on under-5 cancer mortality; and birth sex, parental age, maternal risk factors (multiple births, the number of mother’s newborn infants, and the number of deaths among the mother’s newborn infants), and marital status act as covariates in this study.
METHODS
Study population
National birth cohorts were constructed by linking 1995–1999 and 2010–2014 national birth cohort data and death data from Statistics Korea using social security numbers.24 The 1995–1999 cohort was constructed from all the national births from January 1, 1995 to December 31, 1999, and the 2010–2014 cohort, from January 1, 2010 and December 31, 2014. The birth data were linked with national death data, which were obtained from Statistics Korea to construct a dataset that included children up to 5 years of age.24
The total number of births was 3,323,613 in the 1995–1999 cohort and 2,297,876 in the 2010–2014 cohort, 622 cancer deaths were included in the 1995–1999 cohort and 252 in the 2010–2014 cohort.
Variables
From the national birth cohorts, parental socioeconomic position (i.e., parental educational background and employment status), gestational age, low birth weight, and other covariates (i.e., birth sex, parental age, maternal risk factors (multiple births, the number of mother’s newborn infants, the number of deaths among the mother’s newborn infants), and marital status) were analyzed as risk factors that could affect under-5 cancer mortality rates.
In this study, parental educational background and parents’ employment status were considered as proxy of parental social class factors affecting under-5 cancer mortality. Parental educational background was identified using “regular educational status,” a term used by the Ministry of Education and categorized as non-educated (0 years), elementary (1–6 years), middle (7–9 years), high school (10–12 years), and university education or higher (≥ 13 years). As the number of births in parents who graduated from high school or had lower levels of education has decreased over time, this study classified the educational level into two groups: university education or higher and high school or lower. The parents’ employment status was grouped into three categories of non-manual workers (legislators, senior officials, managers, professionals, technicians, practical professionals, office workers, service workers, and sales workers), manual workers (skilled agricultural, forestry and fishery workers, craft and affiliated craft workers, device and machine operators, assemblers, and laborers), and economically inactive (students under 14 years, unemployed people, houseworkers, and soldiers).
Birth weight and gestational age were considered as intermediate factors. Gestational age was grouped into preterm (≥ 16 weeks and < 37 weeks) and term (37–45 weeks) to examine the effects of preterm delivery. Birth weight was grouped into normal birth weight (≥ 2,500 g) and low birth weight (≥ 500 g and < 2,500 g).
Parental age, maternal risk factors (multiple births, the number of mother’s newborn infants, and the number of deaths among the mother’s newborn infants), and marital status act as covariates. Parental age was re-categorized into < 25 years, 25 years to 35 years, and ≥ 35 years. The number of multiple births was grouped into one (singleton) and two or more (multiple).
The number of total births was classified as one and two or more. The number of deaths among the mother’s newborn infants was categorized as zero (none) and one or more. Marital status was re-grouped into married and non-married.
For the outcome indicators, under-5 cancer mortality was identified for all cancers (International Classification of Diseases, 10th Revision [ICD-10], C00–C99), including leukemia (ICD-10, C91–C95) and central nervous system (CNS) cancers (ICD-10, C70–C72), which were the most common cancers among the childhood cancers in Korea.
Statistical methods
The statistical analyses applied the Cox proportional hazard model in accordance with the retrospective cohort study. The crude death rates and the incidence density were calculated as the number of deaths per 100,000 children and 100,000 person-years.
Kaplan-Meier survival curves were used to describe the survival pattern within the under-5 deaths for the parental socioeconomic variables. Multivariable Cox proportional hazards regression model was used, and hazards ratios and 95% confidence intervals (CIs) were calculated to estimate the effect of parental social class on under-5 cancer mortality adjusted for birth sex, parental age, multiple births, the number of mother’s newborn infants, the number of deaths among the mother’s newborn infants, and marital status.
Interaction analysis was conducted to analyze how the interaction between parental social class (parental educational background and parents’ employment status) and birth conditions (preterm birth and underweight) of the child affected cancer deaths in children under the age of 5.
This study also explored the combined effect between paternal social class and maternal social class, and paternal education and paternal employment.
The statistical programs used were SAS 9.4 (SAS Institute, Cary, NC, USA), Stata 6.0 (StataCorp LLC, College Station, TX, USA), and R (R Foundation, Vienna, Austria).
Ethics statement
This study was conducted in accordance with the prevailing ethical principles. The Office of Research Integrity and Compliance Institutional Review Board (IRB) at the Kangwon National University Hospital reviewed and approved this study and the use of data from the National Statistics Office in Korea (KWNUIRB-2018-11-005).
RESULTS
Under-5 cancer mortality rates according to parental education, parental employment, and birth characteristics in 1995–1999 and 2010–2014 cohorts
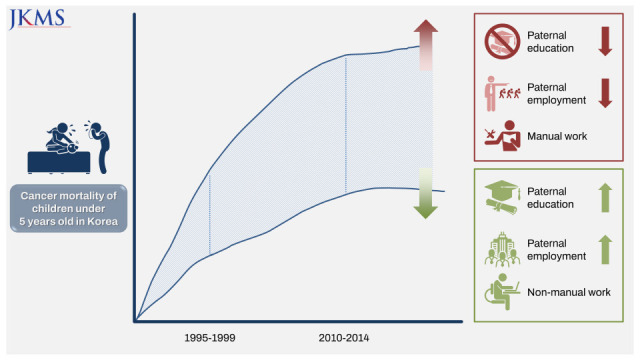
Cancer deaths under the age of 5 decreased significantly in all risk variables over a 15-year period in the 2010–2014 cohort compared to the 1995–1999 cohort (Table 1). The difference in mortality rates in children under the age of 5 according to paternal education, paternal employment, maternal employment, the total number of births, and birth weight increased, whereas the gaps between cancer deaths in children under the age of 5 years and multiple births, the number of deaths among births, and marital status decreased (Table 1).
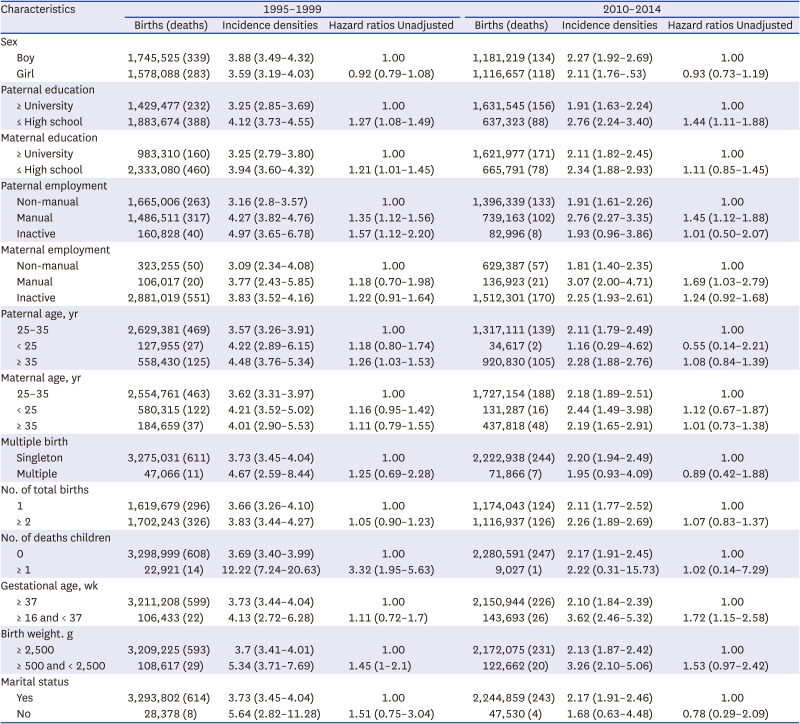
Table 1
Under-5 cancer mortality rates (incidence densities), hazard ratios according to parental education, parental employment, and birth characteristics, 1995–1999 cohort and 2010–2014 cohort
Values are presented as HRs (95% CIs).
Unadjusted: unadjusted univariate hazard ratios.
HRs = hazard ratios, 95% CIs = 95% confidence intervals.
![]()
The main risk factors that significantly affected under-5 cancer mortality rates after adjusting for the confounding variables of gender, parental age, birth weight, gestational age, total maternal births, number of deaths among the births, maternal history of multiple births, and marital status were paternal education and employment status, and paternal age in the 1995–1999 cohort, and paternal education and employment status, and maternal employment status in the 2010–2014 cohort (Table 1).
Widening social inequalities in under-5 cancer mortality in Korea
The hazard ratios (HRs) for under-5 cancer mortality according to parental social class adjusted for gender, parental age, birth weight, gestational age, the total number of births, total deaths among the total births, multiple births, and marital status showed that social inequalities in under-5 cancer mortality increased in the 2010–2014 cohort compared to the 1995–1999 cohort in Korea (Table 2, Figs. 1 and 2). In paternal education, the adjusted HR for under-5 cancer mortality in children with parents with high school or below education compared to university education was 1.23 (95% CI, 1.04–1.46) in the 1995–1999 cohort and increased by 1.45 (95% CI, 1.11–1.89) in the 2010–2014 cohort (Table 2, Figs. 1 and 2). There was no significant difference in under-5 cancer mortality in the cohorts according to maternal education.
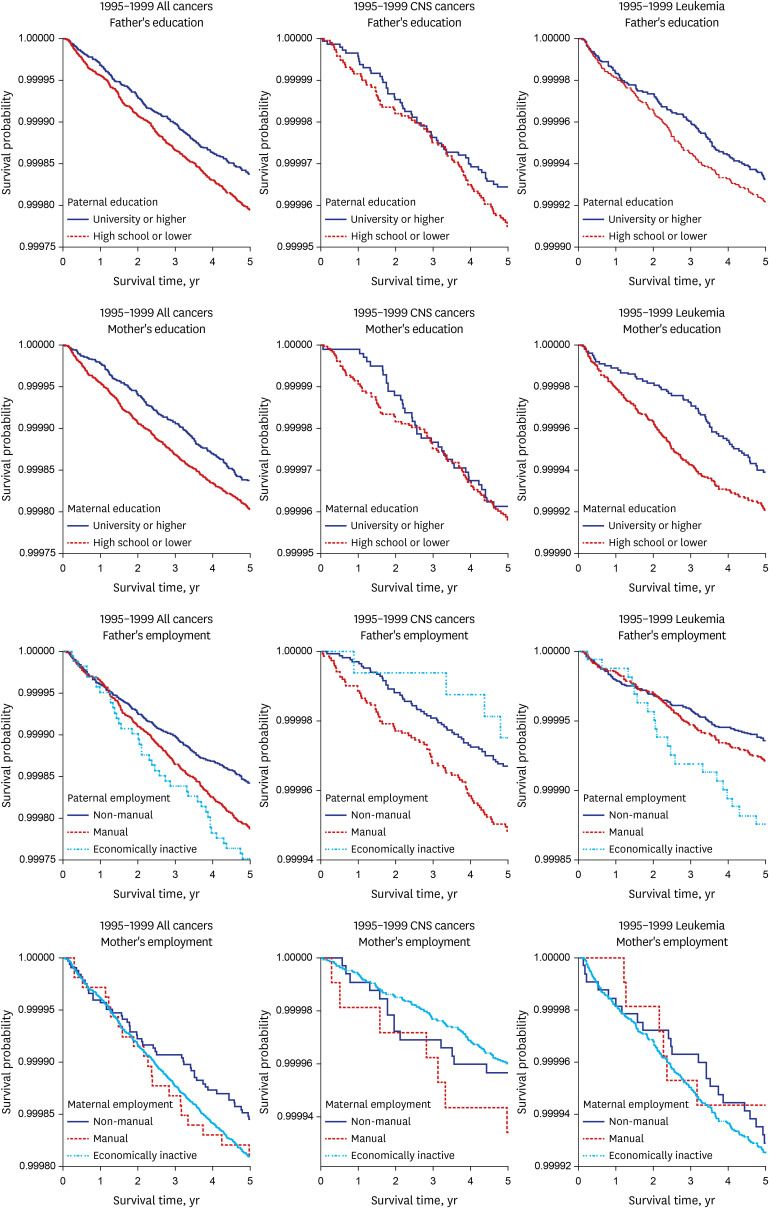
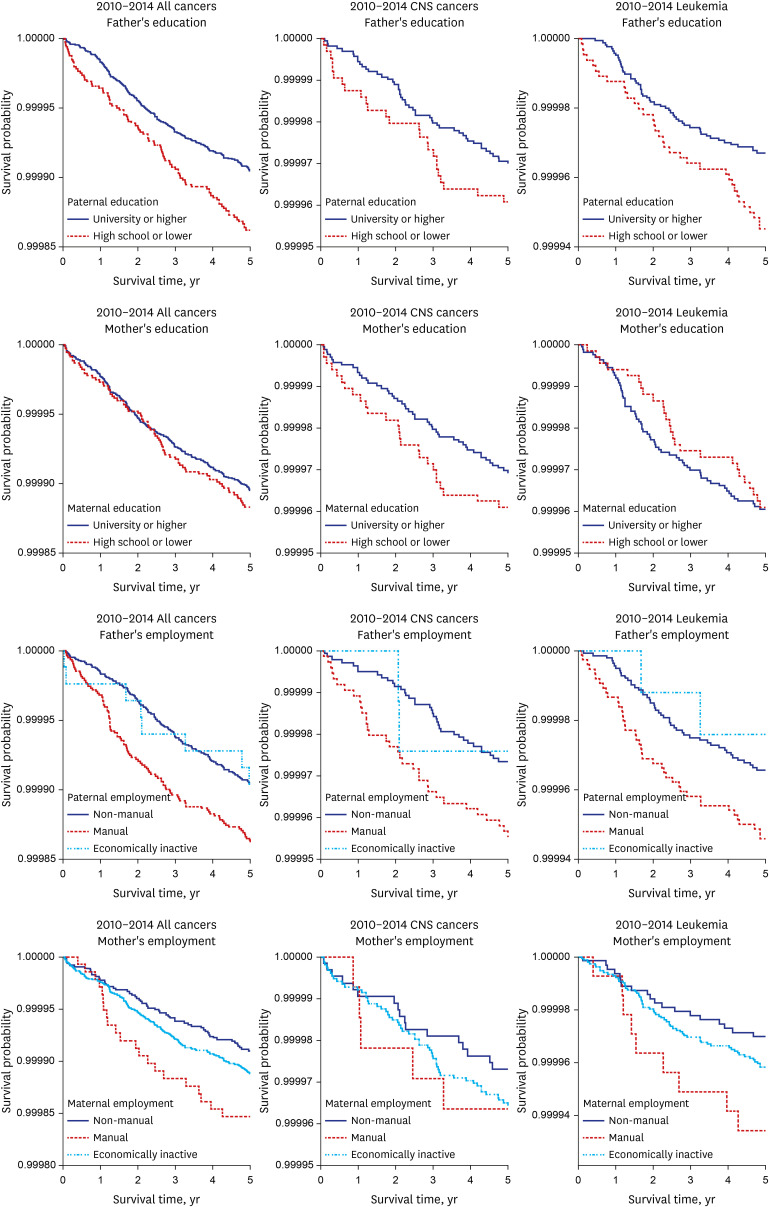
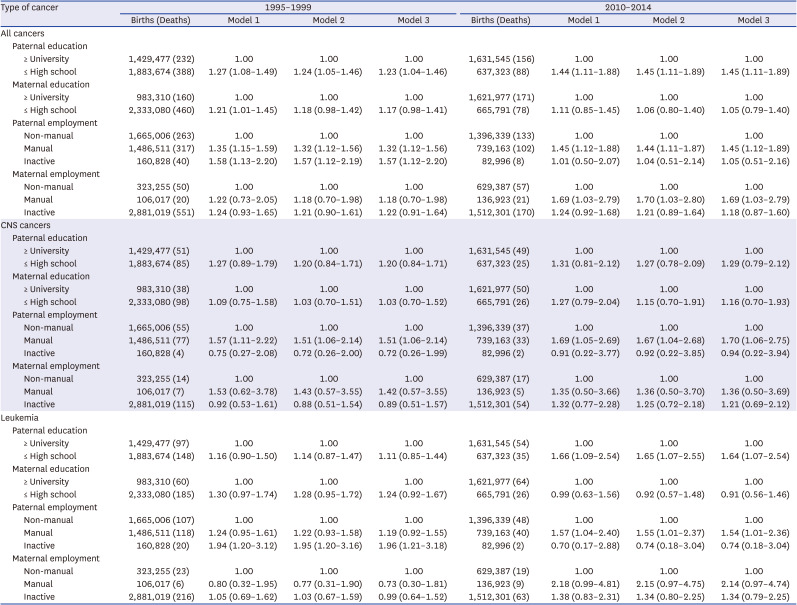
Fig. 1
Five-year Kaplan-Meier survival curves for children under 5 years with cancers by parental education and employment. The Statistics Korea, 1995–1999 birth cohort.
![]()
Fig. 2
Five-year Kaplan-Meier survival curves for children under 5 years with cancers by parental education and employment. The Statistics Korea, 2010–2014 birth cohort.
![]()
Table 2
HRs (95% CI) of under-5 cancer (all cancers, CNS cancers, leukemia) mortality according to parental education and employment state, 1995–1999, 2010–2014
Values are presented as HRs (95% CIs).
Model 1: unadjusted univariate.
Model 2: adjusted for sex and parental age.
Model 3: adjusted for sex, parental age, birth weight, gestational age, total maternal births, number of deaths among the total births, maternal history of multiple births.
HRs = hazard ratios, 95% CIs = 95% confidence intervals, CNS = central nervous system.
![]()
For paternal employment status, the adjusted HR of under-5 cancer mortality in the manual work group compared to the non–manual work group was 1.32 (95% CI, 1.12–1.56) in the 1995–1999 cohort and increased to 1.45 (95% CI, 1.12–1.89) in the 2010–2014 cohort. The corresponding HRs for maternal employment status were 1.18 (95% CI, 0.7–1.98) in the 1995–1999 cohort and 1.69 (95% CI, 1.03–2.79) in the 2010–2014 cohort (Table 2, Figs. 1 and 2).
For leukemia and CNS cancers, the risk factors increasing the social inequalities of under-5 cancer mortality in the 1995–1999 and 2010–2014 cohorts were paternal employment status for under-5 CNS cancer mortality, and paternal education and paternal employment status for under-5 leukemia mortality.
The adjusted HR of under-5 leukemia mortality in the lower paternal education group (high school or lower) compared to the higher paternal education group (university or higher) was 1.11 (95% CI, 0.85–1.44) in the 1995–1999 cohort and increased to 1.64 (95% CI, 1.07–2.54) in the 2010–2014 cohort. The adjusted HR of under-5 leukemia mortality in the paternal manual work group compared to the paternal non-manual work group was 1.19 (95% CI, 0.92–1.55) in the 1995–1999 cohort and increased to 1.54 (95% CI, 1.11–1.89) in the 2010–2014 cohort (Table 2, Figs. 1 and 2). Compared to the paternal non-manual work group, the adjusted HR of under-5 CNS cancer mortality in the paternal manual work group was 1.51 (95% CI, 1.06–2.14) in the 1995–1999 cohort and increased to 1.7 (95% CI, 1.06–2.75) in the 2010–2014 cohort (Table 2, Figs. 1 and 2).
The role of low birth weight and gestational age in under-5 cancer mortality
The risk of under-5 total cancer mortality was higher in low birth weight (less than 2,500 g) and preterm (less than 37 weeks) births compared to normal birth weight or normal term births. The crude HR of under-5 cancer mortality was 1.45 (95% CI, 1.00–2.10) in low birth weight births than that of normal birth weight or normal term births in the 1995–1999 cohort, and 1.72 (95% CI, 1.15–2.58) in preterm births in the 2010–2014 cohort. However, after adjusting for the covariates, the adjusted HRs were not statistically significant (Table 2).
The interaction between parental socioeconomic status (education and employment) and adverse birth outcomes (low birth weight and preterm birth) on under-5 cancer mortality
Since the main factors associated with under-5 cancer mortality in this study were found to be the paternal education level, parental employment status, and adverse birth outcomes (low birth weight and preterm birth), we analyzed the interactions between these variables and under-5 cancer mortality in the 1995–1999 and 2000–2014 national birth cohorts.
When the paternal socioeconomic conditions were higher (university education or higher, non-manual employment), the risk of under-5 cancer mortality was highly correlated with adverse birth outcomes (low birth weight and preterm birth). However, when the paternal socioeconomic conditions were lower (high school or lower, manual or economically inactive), paternal socioeconomic conditions more significantly affected under-5 cancer mortality, even in the normal birth and normal gestational age groups, regardless of adverse birth outcomes (Table 3). These results indicated that socioeconomic conditions had more effect on under-5 cancer mortality than adverse birth outcomes.
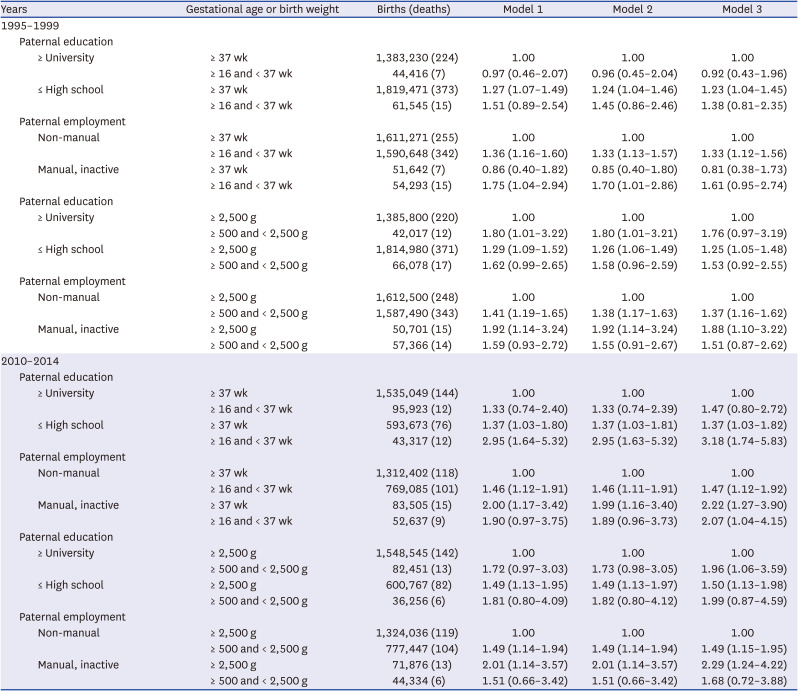
Table 3
Interactions between paternal education and paternal employment state with adverse birth outcomes (preterm births and low birthweights) on under-5 cancer mortality, 1995–1999, 2010–2014
Values are presented as hazard ratios (95% confidence intervals).
Model 1: unadjusted univariate.
Model 2: adjusted for sex and parental age.
Model 3: adjusted for sex, parental age, total maternal births, number of deaths among the total births, maternal history of multiple births.
![]()
These relationships were highly statistically relevant for the lower employment groups (manual or economically inactive) compared to the higher employment group (manual), lower birth weight compared to preterm births, and the 2010–2014 cohort compared to the 1995–1999 cohort (Table 3).
The interaction between parental socioeconomic status and under-5 cancer mortality
The effect of the interactions between parental socioeconomic factors, namely parental education and parental employment on under-5 cancer mortality in both the 1995–1999 and 2010–2014 national birth cohorts showed that the risk of under-5 cancer mortality increased when the combined parental social class was lower, and this relationship was greater in the 2010–2014 cohort compared to the 1995–1999 cohort (Tables 4 and 5).
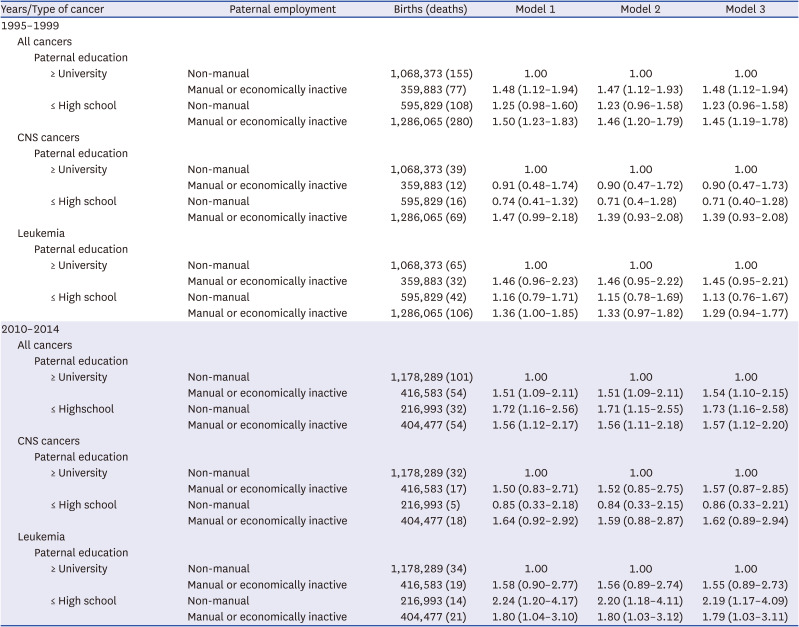
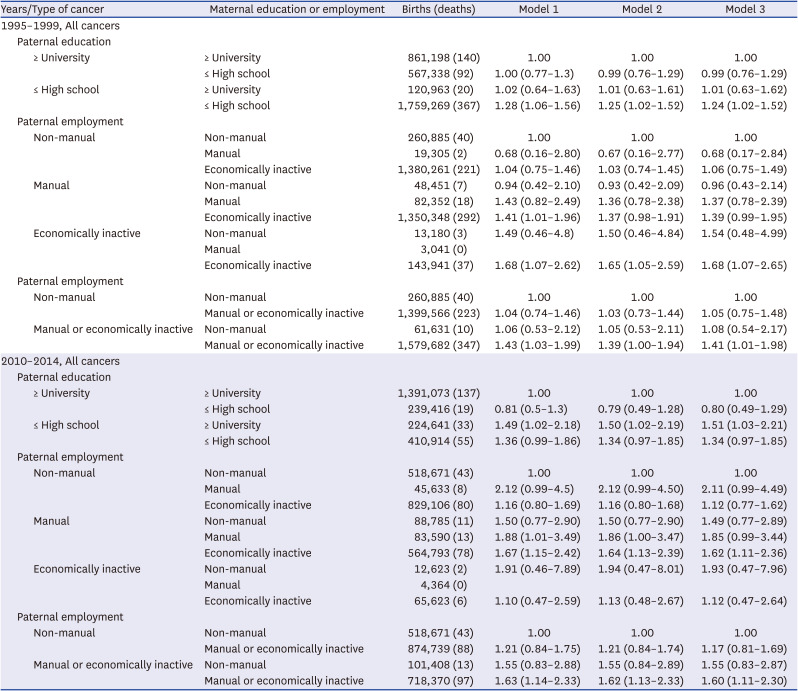
Table 4
Interactions between paternal education and paternal employment with under-5 cancer mortality, 1995–1999, 2010–2014
Values are presented as hazard ratios (95% confidence intervals).
Model 1: unadjusted univariate.
Model 2: adjusted for sex and parental age.
Model 3: adjusted for sex, parental age, birth weight, gestational age, total maternal births, number of deaths among the total births, maternal history of multiple births.
![]()
Table 5
Interactions between paternal education and maternal education, paternal employment and maternal employment with under-5 cancer mortality (all cancers), 1995–1999, 2010–2014
Values are presented as hazard ratios (95% confidence intervals).
Model 1: unadjusted univariate.
Model 2: adjusted for sex and parental age.
Model 3: adjusted for sex, parental age, birth weight, gestational age, total maternal births, number of deaths among the total births, maternal history of multiple births.
![]()
The interaction between parental education and employment status was also evident in leukemia, and the association was stronger in the 2010–2014 cohort than in the 1995–1999 cohort. In the case of CNS cancers, the interaction between parental education and employment was not statistically significant (Tables 4 and 5).
DISCUSSION
This study mainly showed that the socioeconomic gap in the risk of under-5 cancer mortality widened between the 1995–1999 and 2010–2014 cohorts in Korea. The risk factors that had a greater impact on overall under-5 cancer mortality in the 2010–2014 cohort compared to the 1995–1999 cohort were paternal education level, parental employment status, and maternal employment status. The combined effect of paternal education and paternal employment status, parental education and maternal education, and paternal employment and maternal employment status was greater in the 2010–2014 cohort than in the 1995–1999 cohort. When the parental socioeconomic status was lower (high school or lower, manual work, and economically inactive status), the risk of under-5 cancer mortality was higher even in the normal birth weight and normal term groups.
This study showed that cancer deaths in children under the age of 5 in Korea in the 2010–2014 cohort decreased significantly compared to the 1995–1999 cohort for all risk variables. This result is consistent with Korean statistics. The incidence rate, as well as the prevalence, is increasing, and the mortality of childhood cancer is decreasing.8910 The crude incidence rate of cancer in children under 5 was 16.1 (out of 100,000) children in 1999 and increased to 19.9 in 2018. The prevalence of cancer in children under 5 was 45.0 (out of 100,000) in 2007 and increased to 52.4 in 2018.9 In contrast, the mortality rate of cancer in children under 5 in Korea with cancer decreased from 5.84 (out of 100,000) in 1993 to 1.93 in 2020.10 These data reflect the developments in medical technology, where advances in prevention, early detection, and early treatment have contributed to reducing cancer deaths in children under the age of 5.
Cancer deaths in children with adverse birth outcomes (preterm birth and low birth weight) also decreased. This study found that the effect of adverse birth outcomes (low birth weight, preterm birth) on under-5 cancer mortality decreased from the 1995–1999 cohort to the 2010–2014 cohort. This is also due to the development of medical technology. The government’s “project to support infertile couples” has resulted in an increase in the number of multiple births.25 Korea’s multiple births, preterm births (< 37weeks), and low birthweights (< 2,500 g) increased from 2.7%, 5.8%, and 4.9%, respectively, in 2010 to 4.9%, 8.5%, and 6.8% in 2020.25 Even though the number of low birth weight babies under 2,500 g continues to increase in Korea, the risk of death among these babies has decreased due to advancements in neonatal intensive care.25
This study showed that social inequalities in under-5 cancer mortality exist and the gaps in social inequalities in under-5 cancer mortality risk were greater in the 2010–2014 cohort than in the 1995–1999 cohort. Several previous studies reported social inequalities in under-5 cancer mortality.151721 This study extended the investigation and found that social inequalities in under-5 cancer mortality risk were greater in the 2010–2014 cohort than in the 1995–1999 cohort.
The study results are consistent with those of a few previous studies, which reported that the differences in childhood cancer deaths due to differences in social class were increasing.2627 Ribeiro et al.26 showed a significant decrease in childhood leukemia deaths in developed countries, but relatively less in developing countries. Jakab et al.27 reported that childhood leukemia deaths according to material deprivation have been continuing in Hungary for the past 45 years.
In this study, the reason why the socioeconomic gap of under-5 cancer mortality in the 2010–2014 birth cohort increased compared to the 1995–1999 birth cohort in Korea is that the decline in under-5 cancer mortality rates progressed faster in the higher social class than in the lower social class due to increase of social inequalities, while the overall under-5 cancer mortality rates were decreasing.
We can infer several causes of the increasing socioeconomic gap in this study.
First of all, the socioeconomic gap in under-5 cancer mortality increased according to differences in the paternal education level, as well as employment status. The socioeconomic gap in under-5 cancer mortality widened depending upon the level of education and employment status of the father.
Thus, in Korea, paternal education might influence the family wage level and childrearing methods, leading to an effect on under-5 cancer mortality.2829 The mechanism by which the paternal educational background affects under-5 cancer mortality may be that a difference in paternal educational backgrounds influences economics and the standard of living within the family, leading to an increase in under-5 cancer mortality. In Korea, higher paternal education levels were reported to be associated with higher wage levels283031 and more childrearing time with relatively fewer working hours.29 Thus, cancer deaths among children would decrease.
The main source of the increasing income inequalities (as a proxy for social inequalities) in Korea is wage inequalities in the labor market. The expansion of labor market wage inequalities3233 over the past 15 years has resulted in worsening income inequalities. Korea’s income inequalities has widened since the mid-1990s34 and grew significantly worse between the 1998 financial crisis and the 2008 and 2009 global economic crises (Supplementary Fig. 1).
The inequalities in parental educational levels also led to inequalities in working hours and parental childrearing time29 and inequalities in the quality, as well as the quantity, of childcare, which may have caused the inequalities in under-5 cancer mortality seen in this study. According to Song,29 the amount of time spent by fathers on household labor increased in 2009 compared to 1999, which was inferred to be the result of more highly educated fathers in Korea.
The reason why the inequalities in under-5 cancer mortality according to paternal education levels were large seems to be due to the father’s role as head of the household. The household income in Korea can be determined by the socioeconomic level of the male heads of households because the male head still plays a major role in Korea, and the wife contributes less than 20% of the household income.35 Korea is a male-dominated patriarchal society. Currently, men’s social class occupies a more important position in family relationships than that of women because of the patriarchal cultural tradition centered on Confucianism and the supremacy of men in the capitalist society of Korea.
Secondly, the maternal socioeconomic status might contribute to the widening social inequalities in under-5 cancer mortality. For mothers, the gap in under-5 cancer mortality between the manual group and non-manual group increased in the 2010–2014 cohort compared to the 1995–1999 cohort in this study. In Korea, women in low social groups have gradually entered manual jobs centered on interpersonal services. This kind of manual work has increased the physical workload, working hours, and night labor, increasing the physical work burden on the mother and increasing the under–5 cancer mortality gap between the manual and non-manual groups.3031
Thirdly, in this study, cancer deaths among children under the age of 5 increased between the normal and abnormal childbirth groups (low birth weight groups). The reason for this seems to be that low social status and abnormal births are increasing.
In this study, the combined effect of paternal education and paternal employment, and paternal and maternal employment on under-5 cancer mortality was increased. The under-5 cancer mortality risk was greater than that of the individual socioeconomic factors. In particular, the combined effect of having both the father and mother employed in manual work widened the gap in under-5 cancer mortality rates compared to the effect of one parent employed in manual work.
The results of this study also suggested that even when the birth conditions were normal (normal gestational age and normal birth weight), under-5 cancer mortality was higher under low socioeconomic conditions, suggesting that socioeconomic conditions are becoming more important factors in under-5 cancer mortality.
Therefore, this study showed that the interaction of socioeconomic factors was important because various socioeconomic factors interacted to increase the under-5 cancer mortality rate.
This study found that under-5 cancer mortality social inequalities also existed for leukemia and these social inequalities increased over time. The interaction between the level of education and employment status was evident in leukemia, and the association was stronger in the 2010–2014 cohort than in the 1995–1999 cohort. However, this was not true for CNS cancers, even though a previous study reported inequalities in childhood CNS cancer mortality.36
Several previous studies reported a relationship between socioeconomic factors and leukemia.56123738 The reason for the greater social inequalities in under-5 cancer mortality for leukemia was that the survival rate of leukemia is related to malnutrition; the immune system including the child’s vaccination history; exposure to infectious agents; exposure to ionizing irradiation and certain chemicals, e.g., benzene, cytotoxins, alkylators, and topoisomerase II inhibitors; parental social (environmental and occupational) contact in the workplace; and accessibility to treatment for children and adolescents in the lower social class.3940
In conclusion, this study showed that the risk factors mainly affecting under-5 cancer mortality were paternal education and paternal employment, and these social inequalities were greater in the 2010–2014 cohort compared to the 1995–1999 cohort. While under-5 cancer mortality was also higher in the low birth weight and preterm birth groups, when the paternal socioeconomic status was higher (university or higher, non-manual group), under-5 cancer mortality was higher even in the normal birth weight or normal term group when the paternal socioeconomic status was lower (high school or lower, manual group, and economically inactive status). This relationship was stronger in the 2010–2014 cohort compared to in the 1995–1999 cohort. The interaction between the educational level and employment status also existed for leukemia, but not for brain cancer.
 XML Download