

 PDF
PDF Citation
 Print
Print


INTRODUCTION
Aortic stenosis (AS) is the most common acquired valvular heart disease, with a prevalence of 9.8% at ages 80 to 89 years.1) In contemporary practice, transcatheter aortic valve replacement (TAVR) is the gold standard for managing patients with symptomatic severe AS with high surgical risk.2) In recent years, randomized controlled trials have reported favorable outcomes for TAVR in intermediate and low-risk patients as well.3)4) Widespread availability of TAVR and lower associated procedural risk compared with surgery change the threshold for intervention in AS patients.
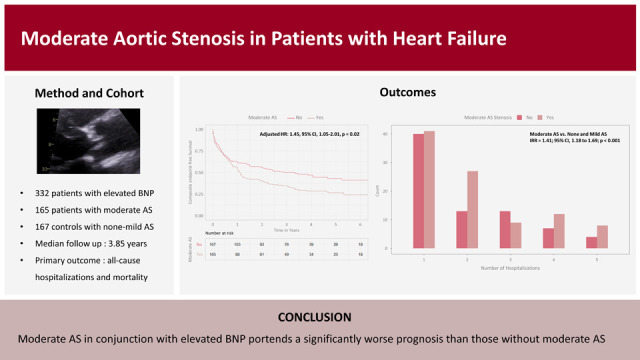
Management of moderate AS is less well established. There is evidence that moderate AS confers a surprisingly adverse prognosis,5) approaching that of severe AS.6)7) Notably, moderate AS has not been extensively studied in patients with concomitant heart failure (HF). Recently, Jean et al. revealed that moderate AS was associated with an increased risk of mortality, and TAVR appeared to improve survival in patients with heart failure and reduced ejection fraction (HFrEF).7) The potential role of TAVR in the treatment of patients with moderate AS is currently being investigated in the ongoing patients with heart failure with reduced ejection fraction trial (TAVR UNLOAD).8) The objective of the current study was to further describe the characteristics and clinical course of patients with moderate AS with evidence of concomitant HF compared with a contemporary control group.
METHODS
Ethical statement
This is a single-center, retrospective cohort study conducted at The Christ Hospital, Cincinnati, OH under the approval of the Institutional Review Board (protocol ID 14-13: The Christ Hospital Structural Database); the need for informed consent was waived due to retrospective, observational nature of the study that did not impact patients’ care.
Patients
The echocardiography database (Merge, Inc, Las Vegas, NV, USA) was screened for those with moderate or less AS between September 2013 and August 2021, and the resulting group (n=997) was further screened in the electronic health record for brain natriuretic peptide (BNP) level >100 pg/mL within 6 months of the index echocardiogram (n=378). This step yielded 378 subjects. After 46 patients were excluded for inadequate echocardiography data, a total of 332 patients were eligible for the study. The moderate AS group (n=165) was compared with the rest of the group (none-mild AS, n=167). There was no specific creation of a control group or matching of baseline characteristics.
HFrEF is defined as the clinical diagnosis of HF with a left ventricular ejection fraction (LVEF) ≤50%, while HF with preserved ejection fraction (HFpEF) is defined as LVEF ≥50%.9) Patients with previous aortic valve surgery, a history of congenital heart disease, implanted left ventricular assist device, or a history of heart transplantation were also excluded. The following demographic and clinical variables were collected at a time point most proximate to the index echocardiogram: age, sex, body mass index, body surface area, hemoglobin, and serum creatinine. In addition, the presence of comorbidities (hypertension, diabetes, coronary artery disease, atrial fibrillation, chronic obstructive pulmonary disease, peripheral vascular disease, cerebrovascular accident, myocardial infarction), smoking history, and cardiac medications (antiplatelet agents, renin-angiotensin-aldosterone antagonists, calcium-channel blocker β-blocker, diuretic, statin) were recorded.
Echocardiography
All patients underwent a comprehensive echocardiographic assessment using commercially available ultrasound systems (Philips IE33; Philips Ultrasound, Bothell, WA, USA). Left ventricular end-diastolic volume, left ventricular end-systolic volume, and LVEF were measured using the modified Simpson’s method. Transaortic peak velocity was obtained by continuous-wave Doppler echocardiography, and the pressure gradient was calculated using the simplified Bernoulli equation. Aortic valve area (AVA) was calculated using the continuity equation. The following echocardiographic parameters were also recorded: AVA (AVA-cm2), AVA index (cm2/m2), interventricular septal end-diastolic thickness (IVSd-mm), left ventricular internal diameter in end diastole (LVIDd-mm), left ventricular posterior wall end-diastolic thickness (PWd-mm), LVEF (%), peak and mean transaortic pressure gradients (mmHg), left atrial (LA) volume index (mL/m2), tricuspid annular plane systolic excursion (TAPSE-cm), E/A ratio, medial e’ velocity (cm/s), lateral e’ velocity (cm/s), E/e’ ratio, tricuspid regurgitation velocity (m/s), degree of aortic and mitral regurgitation. Echocardiographic indices were measured following the American Society of Echocardiography standards.10) Moderate AS was defined as AVA between 1 and 1.5 cm2, peak trans-aortic velocity of 3.0–3.9 m/s, or mean pressure gradient of 20–39 mmHg.11) Those not meeting these criteria formed the none-mild AS comparator (control) group.
Clinical outcomes
All patients’ records were reviewed from the date of the index echocardiogram until the death or the end of the study period. Clinical data were obtained by review of medical records, telephone interviews, and the social security database. The primary endpoint was the combination of all-cause mortality or all-cause hospitalization.
Statistical analysis
Continuous variables were presented as mean ± standard deviation (SD) for normal distributions, and median + interquartile range for non-normal distributions. Normality was tested using skewness, kurtosis, visual inspection of the histogram, and QQ plot. Categorical data were displayed as frequency (percentage), and comparisons between groups were performed using the chi-square test. As appropriate, continuous variable comparisons between groups were performed using the Student’s t-test or the Mann-Whitney U test. The Kaplan-Meier curve and log-rank test were computed to analyze all-cause mortality differences between moderate AS and control. For the Cox regression model, univariate analysis of each of the possible predictors of the outcome was tested, and only those variables that were significant at p<0.20 were included in a multivariate model to determine the independent predictors of the primary endpoint.12) However, age, gender, hemoglobin (Hgb), and baseline LVEF were included in multivariate analysis, regardless of univariate analysis results. The Poisson regression model was performed to examine the difference in hospitalization rates between groups. The hazard ratio (HR) and incidence rate ratio were presented as mean and 95% confidence interval (CI). A two-sided p value of <0.05 was considered statistically significant. The statistical analyses were performed using IBM SPSS Statistics for Windows, version 22.0 (IBM Corp., Armonk, NY, USA) and R software, version 4.0.3 (The R Foundation, Vienna, Austria).
RESULTS
Baseline patient characteristics
A total of 332 consecutive patients (mean age of 75±14 years, 49.4% male) were included in our study. 165 patients (49.7%) had moderate AS, while 167 (50.3%) had none-mild AS and formed the control group. In the control group, 17 patients (10.2%) had no AS and 150 patients (89.8%) had mild AS. There were baseline differences between the two groups in the proportion of patients with a history of atrial fibrillation (42.1% in moderate AS vs. 31.3% in control, p=0.04). No other significant differences in comorbidities or cardiac medication were found between groups (p>0.05 for all, Table 1). Mean BNP levels were similarly elevated: 530 pg/mL (187–1004) in the moderate AS group vs. 518 pg/mL (182–945) in control, p=0.27).
Table 1
Baseline clinical characteristics of the cohorts
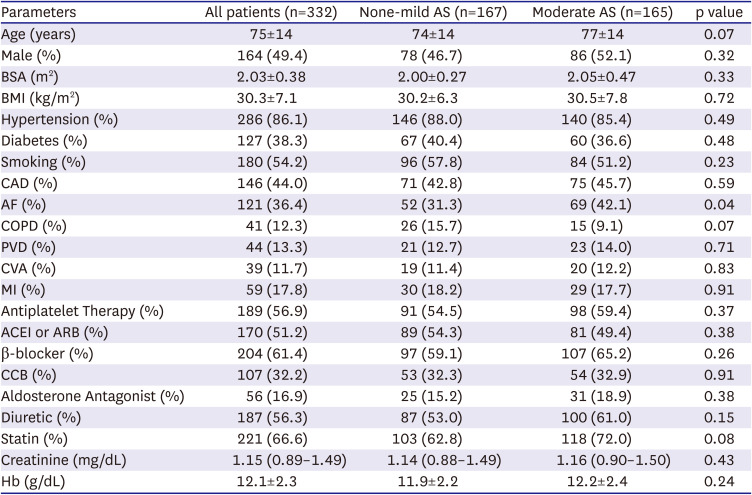
Continuous variables are expressed as mean ± standard deviation with normal distribution and median and interquartile range with non-normal distribution. Categorical variables are presented as number (%).
ACEI = angiotensin-converting enzyme inhibitors; AF = atrial fibrillation; ARB = angiotensin II receptor blocker; AS = aortic stenosis; BMI = body mass index; BSA = body surface area; CAD = coronary artery disease; CAV = cerebrovascular accident; CCB = calcium-channel blocker; COPD = chronic obstructive pulmonary disease; Hb = hemoglobin; MI = myocardial infarction; PVD = peripheral vascular disease.
Echocardiography
Patients with moderate AS had lower LVEF (50.0±13.3% vs. 54.4±11.2%, p=0.001), and the proportion of those with LVEF <50% was higher in moderate AS (41.2%) than in control (28.1%) (p=0.01). Moderate AS group had lower TAPSE (1.7±0.5 cm vs. 2.0±0.7 cm, p<0.001), and higher TR velocity (2.9 m/sec [2.4–3.3] vs. 2.6 m/s [2.4–3.0, p=0.03] compared to control. Peak E velocity (103.0 [79.9–124.5] vs. 87.0 [68.0–114.0], p=0.001) and average E/e’ ratio (16.7 [13.0–22.5] vs. 14.9 [11.5–19.3], p=0.02) were significantly higher in moderate AS group when compared to control. Similarly, moderate AS patients also tended to have a larger LA volume index compared to the control, but the difference did not reach statistical significance (40.8 mL/m2 [30.9–51.5] vs. 37.7 mL/m2 [28.2–49.2], p=0.08). No major differences were found for the other echocardiographic indices (Table 2). During the median follow-up duration of 3.85 years (interquartile range: 3.04–5.77 years), 68 (41%) patients had one follow-up echocardiogram, and 42 (25.5%) had a second study in the moderate AS group. However, there was a significant variation in the time interval from the index echocardiogram to the first follow-up study: 0.5 years to 3.2 years.
Table 2
Echocardiographic characteristics of the cohorts
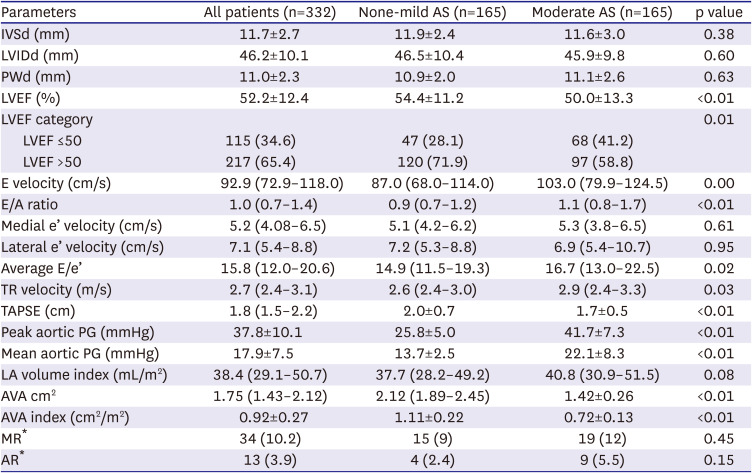
Continuous variables are expressed as mean ± standard deviation with normal distribution and median and interquartile range with non-normal distribution. Categorical variables are presented as number (%).
AR = aortic regurgitation; AS = aortic stenosis; AVA = aortic valve area; IVSd = interventricular septal end diastole; LA = left atrial; LVEF = left ventricular ejection fraction; LVIDd = left ventricular internal diameter end diastole; MR = mitral regurgitation; PG = pressure gradient; PWd = posterior wall end diastole; TAPSE = tricuspid annular plane systolic excursion; TR = tricuspid regurgitation.
*Moderate or greater mitral regurgitation.
Clinical outcomes
Overall, in both groups, 61 (18.4%) patients died. The overall event rate for the primary composite endpoint of all-cause mortality or all-cause hospitalization was 64.2% (95% CI, 58.7–69.3%). Moderate AS had significantly higher rates of the primary endpoint than none-mild AS in both univariate analysis (HR, 1.50; 95% CI, 1.14–1.97; p=0.004) (Figure 1A), and adjusted analysis (HR, 1.45; 95% CI, 1.05–2.01, p=0.02) (Table 3). A significant mortality difference was observed between the two groups in univariate analysis (23.0% in moderate AS vs. 13.8% in control, χ2(1)=4.088, p=0.043, log-rank test; HR, 1.70; 95% CI, 1.01–2.86, p=0.046) (Figure 1B), although this difference did not reach statistical significance in multivariate analysis (Supplementary Table 1). When stratified into the HFrEF (n=115) and HFpEF (n=217) groups, the effect of moderate AS on mortality was similar between HFrEF (HR, 1.51; 95% CI, 0.71–3.22; p=0.29) and HFpEF (HR, 1.65; 95% CI, 0.80–3.41; p=0.17). Neither subgroup showed a statistically significant effect of moderate AS on mortality.
Figure 1
Kaplan-Meier curves for all-cause mortality and composite endpoint. Kaplan-Meier curves comparing all-cause mortality and composite endpoint according to the presence or absence of moderate AS in patients with concomitant heart failure. Moderate AS had significantly higher rates of all-cause mortality and composite endpoint.
AS = aortic stenosis; CI = confidence interval; HR = hazard ratio.
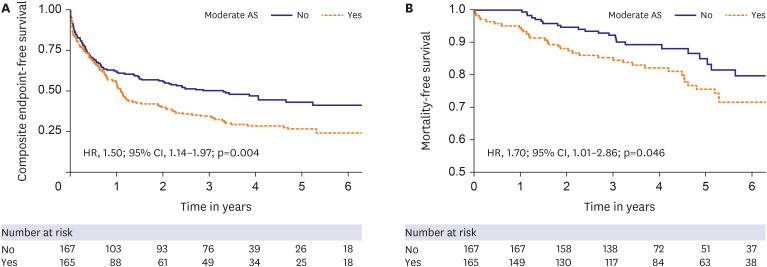
Table 3
Baseline clinical and echocardiographic parameter: predictors of the composite endpoint of time to mortality or hospitalization
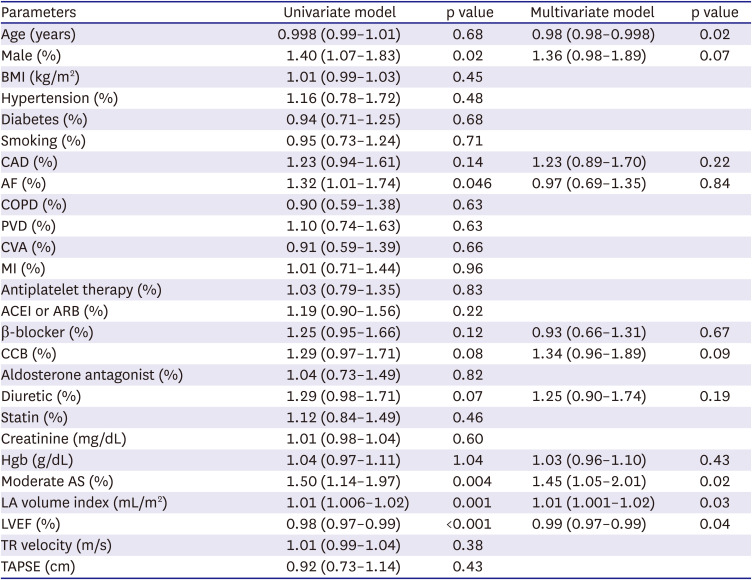
ACEI = angiotensin-converting enzyme inhibitors; AF = atrial fibrillation; ARB = angiotensin II receptor blocker; AS = aortic stenosis; BMI = body mass index; CAD = coronary artery disease; CAV = cerebrovascular accident; CCB = calcium-channel blocker; COPD = chronic obstructive pulmonary disease; LA = left atrial; LVEF = left ventricular ejection fraction; MI = myocardial infarction; PVD = peripheral vascular disease; TAPSE = tricuspid annular plane systolic excursion; TR = tricuspid regurgitation.
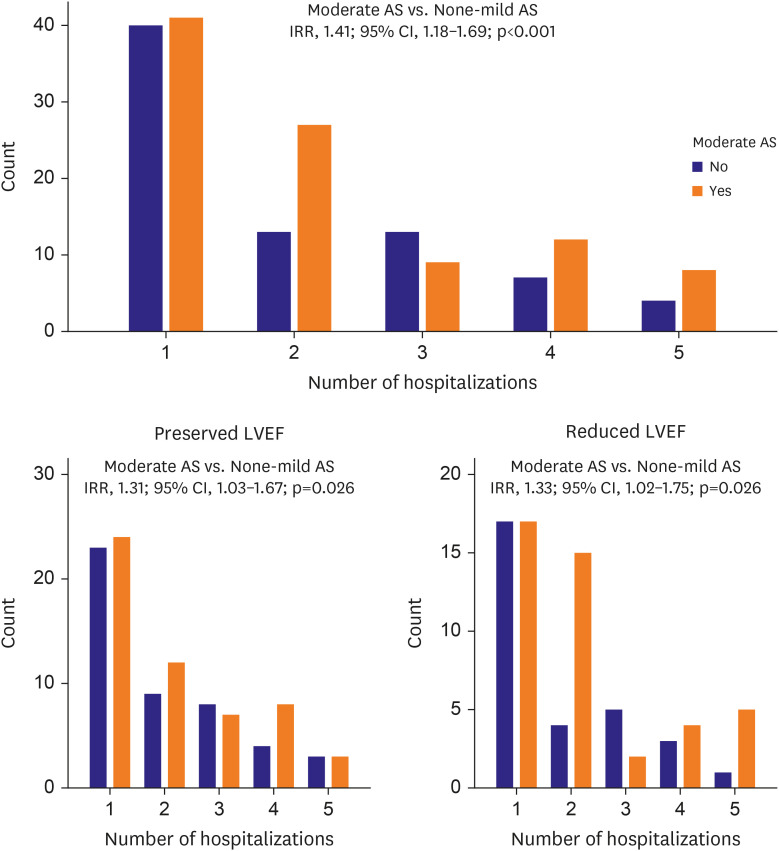
There was a total of 508 all-cause hospitalizations, with 299 in moderate AS and 209 in control. Using the Poisson regression model, moderate AS had 1.41 (95% CI, 1.18–1.69; p<0.001) times more all-cause hospitalizations per patient-year of follow-up compared with control (Figure 2). After adjustment for significant covariates (age, gender, coronary artery disease, atrial fibrillation, beta-blocker, calcium channel blocker, diuretics, hemoglobin, LVEF, LA volume index), moderate AS remained an independent predictor of all-cause hospitalizations (incidence rate ratio [IRR], 1.45; 95% CI, 1.18–1.79; p=0.005). Moderate AS was significantly associated with higher all-cause hospitalization rates in both HFrEF (IRR, 1.33; 95% CI, 1.02–1.75; p=0.038) and HFpEF [IRR], 1.31; 95% CI, 1.03–1.67; p=0.026) (Figure 2). There were 4 patients in the moderate AS group who underwent aortic valve replacement during the follow-up period.
Figure 2
Bar graphs for hospital admissions. Bar graphs showing the number of hospital admissions according to the presence or absence of moderate AS in patients with concomitant heart failure and stratified by LVEF. Moderate AS was significantly associated with higher all-cause hospitalization rates in both heart failure with reduced ejection fraction and heart failure with preserved ejection fraction.
AS = aortic stenosis; CI = confidence interval; IRR = incidence rate ratio; LVEF = left ventricular ejection fraction.
DISCUSSION
The presence of moderate AS with biomarker evidence of elevated filling pressures conferred significantly worse clinical outcomes than the comparator group. This finding was independent of LVEF.
Strange et al. observed that moderate AS was linked with high mortality rates over long-term follow-up with 1.3 and 2.3-fold increases in mortality compared to mild or absent AS, respectively.6) Another recent study reported that moderate AS was independently associated with all-cause mortality rates of 13%, 30%, and 44% at 1, 3, and 5 years.13) These studies used echocardiography data in a general patient population but not specifically focused on those with evidence of HF defined in our study as BNP >100 pg/mL. Other recent studies do suggest that moderate AS is associated with high mortality rates in patients with HFrEF,7)14) although little data are available for patients with moderate AS and HFpEF. Our study provides evidence that moderate AS was linked with a significantly higher number of hospitalizations in those with elevated BNP, regardless of ejection fraction.
Although current guidelines recommend aortic valve replacement for severe AS, the optimal strategy for moderate AS with underlying HF is not clear. With the widespread availability of TAVR, the question of valve replacement timing is particularly relevant. In this context, a relatively small observation study showed that TAVR was associated with improved survival in moderate AS patients with reduced ejection fraction.7) In this study, Jean et al included 262 patients with moderate AS and HFrEF and revealed that moderate AS was significantly linked with an increased risk of overall mortality (HR, 2.98; 95% CI, 2.08–4.31; p<0.0001) and the composite of HF hospitalization and mortality (HR, 2.34; 95% CI, 1.72–3.21; p<0.0001).7) Notably, 44 patients underwent aortic valve replacement with substantially improved survival (HR, 0.59; 95% CI, 0.35–0.98; p=0.04).7) Additionally, the results of the ongoing TAVR-UNLOAD trial will be important in clarifying the benefit of TAVR in HFrEF patients with moderate AS.8)
The follow-up of patients with moderate AS deserves comment. In this study, there was a minority of patients received routine annual echocardiographic follow-ups. It is doubtful that a significant number of these patients received studies in other systems not visible in our electronic health record (through CareEverywhere). The recommendations for follow-up studies at 1–2 year intervals should be more rigorously followed, given the rate of adverse events.
This study has several limitations. First, this is a retrospective study and subject to bias due to unmeasured confounders; however, we performed a comprehensive multivariable analysis adjusting for covariates. In addition, this is a single-center study; thus, a larger multicenter study with more events would help to further validate our findings. Moreover, given the retrospective nature of this study, echocardiograms were not obtained sequentially according to a predetermined protocol for timing and data acquisition. Therefore, we were unable to study the progression of moderate AS over time and its relationship to clinical outcomes. This study assessed the association of moderate AS with all-cause death and hospitalizations, but not specifically to cardiovascular or HF etiologies. Given the retrospective study design, the cause of events could not be accurately determined.
The combination of moderate AS and evidence of increased filling pressures portends a significantly worse prognosis than those without AS and should be followed closely with a raised sense of urgency. Addressing moderate AS in patients with evidence of elevated filling pressures should be considered an important therapy for HF, and not specifically for valve disease per se.
 XML Download