Journal List > Korean Circ J > v.52(12) > 1516080827

You, Lee, Choi, and Park: Establishment of an International Evidence Sharing Network Through Common Data Model for Cardiovascular Research

Author's summary

A distributed research network refers to a research network wherein multiple institutions unite for joint research based on common data model wherein the structure and meaning of the data are standardized. Researchers can only send the analysis code to multiple institutions and get the summarized analysis results. Thus, researchers cannot see any of the individual patient data at any time, and no individual patient data can be leaked from the institutions. The Observational Health Data Sciences and Informatics research network standardized 928 million unique records or 12% of the world’s population from 41 countries.

Abstract

A retrospective observational study is one of the most widely used research methods in medicine. However, evidence postulated from a single data source likely contains biases such as selection bias, information bias, and confounding bias. Acquiring enough data from multiple institutions is one of the most effective methods to overcome the limitations. However, acquiring data from multiple institutions from many countries requires enormous effort because of financial, technical, ethical, and legal issues as well as standardization of data structure and semantics. The Observational Health Data Sciences and Informatics (OHDSI) research network standardized 928 million unique records or 12% of the world’s population into a common structure and meaning and established a research network of 453 data partners from 41 countries around the world. OHDSI is a distributed research network wherein researchers do not own or directly share data but only analyzed results. However, sharing evidence without sharing data is difficult to understand. In this review, we will look at the basic principles of OHDSI, common data model, distributed research networks, and some representative studies in the cardiovascular field using the network. This paper also briefly introduces a Korean distributed research network named FeederNet.

INTRODUCTION

The term “big data” was introduced in the 1990s for large data that were difficult to handle with general software. In Korea, as the Health Insurance Review and Assessment Service and the National Health Insurance Corporation provided national claims data to researchers, the concept of medical big data was introduced, and active discussions about its use began. Since then, along with the widespread introduction of electronic health records (EHRs), collaborative research using large-scale multi-institutional medical data has become a hot topic.
However, sharing patient-level medical data across institutions has been limited largely due to the sensitive nature of medical data and lack of interoperability. Although relevant laws have been amended and the government has invested considerable resources in data standardization and collection, challenges remain (Figure 1). Until recently, most inter-institutional collaborative studies have been conducted using considerable budget and manpower. Meanwhile, a novel paradigm for international collaborative research has been proposed: distributed research network (DRN) based on a common data model (CDM).
Figure 1

Principles of distributed research network and CDM. Sharing data is very difficult due to various technical, legal and human issues. In a distributed research network, multiple data sources with different structures and semantics are standardized into CDM with same structure and semantics. Researchers can send analysis code in R or SQL format to each institution and receive analysis results without sharing individual patient data.

CDM = common data model.
kcj-52-853-g001

DISTRIBUTED RESEARCH NETWORK AND OBSERVATIONAL MEDICAL OUTCOMES PARTNERSHIP COMMON DATA MODEL

A DRN refers to a research network wherein multiple institutions unite for joint research based on CDM. Hospitals and data holding institutions with medical and billing data convert data into standardized CDM, and the researcher sends their analysis code in R or SQL format to each institution. Since the data is already standardized as observational medical outcomes partnership (OMOP) CDM, the analysis code can be operated in multiple institutions without additional manual modification, and only the analysis results obtained after executing the analysis code are shared (Figure 1). In principle, there is no individual patient data in the shared results, and the possibility of re-identification of patients and leakage of personal information are fundamentally blocked. Researchers can only send the analysis code to multiple institutions and get the summarized analysis results. Thus, during analysis, researchers cannot see any of the individual patient data at any time, and no individual patient data can be leaked from the institutions.
The OMOP was initiated in 2008 to establish a medical big data network for active medical product safety surveillance based on public–private partnership among the U.S. Food and Drug Administration, academia, data owners, and pharmaceutical industry.1) OMOP’s experiments confirm the feasibility of a DRN for active drug safety, wherein data owners have full control over their data.2) OMOP proposed a medical data model, the OMOP CDM, to enable standardized analysis based on standardization of data structure and semantics across data partners. Following the OMOP project in 2013, the Observational Health Data Sciences and Informatics (OHDSI, pronounced “Odyssey”) initiative,3) a multi-stakeholder, interdisciplinary, international collaborative, was established as a successor to OMOP. As of 2022, OHDSI has attracted 3,266 collaborators from 80 countries 21 time zones and 6 continents. OHDSI collaborators have 928 million unique records in OMOP CDM format from 453 data sources (374 EHRs, 34 registries, and 30 administrative claims) from 41 countries and covers 12% of the world’s population.4) The mission of OHDSI is “to improve health by empowering a community to collaboratively generate the evidence that promotes better health decisions and better care.” For this mission, OHDSI generates three categories of evidence: 1) characterization; 2) population-level estimation; and 3) patient-level prediction. Researchers can use most of characterization, population-level estimation, and patient-level prediction functions through a GUI tool called ATLAS. However, for complex and advanced analyses, advanced skills are required for various open-source R packages provided by the OHDSI method library. Fortunately, various learning opportunities are given. Hundreds of YouTube videos on OMOP CDM in various languages are available and can be easily found at: http://dash.ohdsi.org/youtube_dashboard/.

FeederNet: AN OBSERVATIONAL MEDICAL OUTCOMES PARTNERSHIP COMMON DATA MODEL DATA NETWORK IN KOREA

A nationwide DRN in Korea, named “The Federated E-Health Big Data for Evidence Renovation Network (FeederNet),” was launched in 2019. The project was carried out from 2018 to 2020 with a budget of $9.3 million and supported by the Ministry of Trade, Industry & Energy of Korea. The follow-up project to expand the data network has been ongoing from 2019 to 2022 with a budget of $6.2 million. The size of the data network is essential to get a network effect or network externality. As of October 2022, 57 Korean tertiary or secondary general hospitals joined FeederNet, which contains more than 72% of tertiary teaching hospitals in Korea. As a result, data of more than 71 million patients (including duplicates) have been converted into OMOP CDM. Of the 57 hospitals that have joined FeederNet, CDMs of 46 hospitals have been interfaced with the coordinating system (www.feedernet.com); other hospitals are also in the process of connecting or collaborating with the network. Additionally, it aims to support collaborative research using the OMOP CDM data network. To distribute analytical codes to each hospital and collect their results, a communication between the central coordinating center and hospital’s CDM analytical server is mandatory. The FeederNet central is a portal that harmonizes distributed joint research and manages the resources of the platform. Its features include membership, member/authority management, research project creation/management, ATLAS, which is a CDM analytical tool, analytical results report/visualization, DB resource monitoring, and dashboard for the status of analysis. The FeederNet node is a client module that executes analytical codes from the central node to each hospital’s CDM database. Figure 2 shows the FeederNet portal.
Figure 2

FeederNet main page: www.feedernet.com.

CDM = common data model.
kcj-52-853-g002
In 2019, the “Research Free Zone (RFZ)” was launched to promote inter-institutional joint research activities between researchers in the network. The RFZ has 2 mandatory contract clauses: 1) the same authority granted to in-hospital researchers is equally granted to researchers from other institutions in the RFZ; and 2) a single IRB granted to a researcher is effective to all hospitals in the RFZ. Currently, 24 hospitals have joined the RFZ, and about 90% of analyses were conducted using the CDM databases in RFZ.
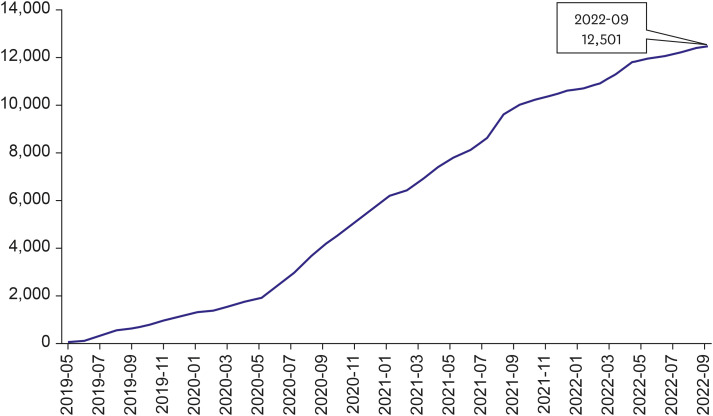
From the launch of FeederNet on May 2019 until September 2022, 12,501 analyses have been performed. Additionally, approximately 400 analyses/month have been conducted since June 2020, and more than 4,700 analyses were performed in 2021 (Figure 3).
Figure 3

Cumulative number of analyses using FeederNet.

kcj-52-853-g003
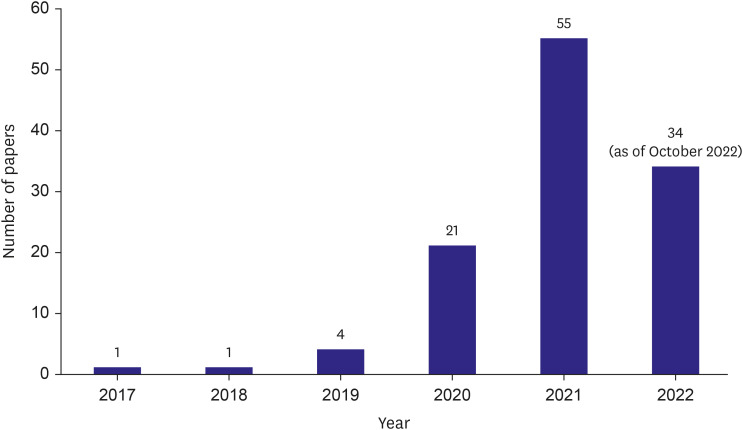
Publications by Korean researchers that have used the OMOP CDM have increased every year. The authors searched a list of studies from Google Scholar using the keyword “OMOP CDM” and selected studies that were published in scientific peer-reviewed journals wherein the first author is a Korean researcher. Subsequently, we found 116 papers; 4, 21 and 55 papers were published in 2019, 2020, and 2021, respectively, which shows a promising increasing trend (Figure 4). The OHDSI provides a searching and browsing tool for OHDSI publications and education materials, named “OHDSI Community Dashboard,” which is available at: http://dash.ohdsi.org/.
Figure 4

Number of published peer-reviewed scientific papers authored by Korean researchers.

kcj-52-853-g004

STANDARDIZATION, DATA QUALITY AND RISK OF RE-IDENTIFICATION OF COMMON DATA MODEL DATABASE

Data standards can ultimately be reduced to structure and semantics.5) In many cases, the importance of semantics, or ontology is underestimated.
Currently, the Korean Standard Classification of Diseases (KCD) 7 and Electronic Data Interchange (EDI) vocabulary systems have been incorporated into the OMOP vocabulary system. In the previous study, it was found that the integration of the EDI vocabulary into the OMOP vocabulary facilitates the standardization of EDI vocabulary per se.6)
Most standardized data in the DRN originated from systems, including health insurance claim data, EHR, and pharmacy dispensing data. The term “extract, transform, and load (ETL)” is often used to refer to data conversion from one source to another data format such as OMOP CDM. In Korea, Ajou University was the first hospital to develop an OMOP CDM database based on EHR, with the detailed process for data conversion and standardization having been published.7) The term “vocabulary mapping” is used to refer to the translation of medical terminology from the original source data into the OMOP standard vocabulary.
Most concerns about data quality in the DRN are focused on data conversion errors in ETL and semantic errors in vocabulary mapping when standardizing semantics into the medical vocabulary. Furthermore, there is a third type of error (source data error), which already exists in the source data. Although source data may have their own data quality screening policy, few of their processes and results of data quality screening are made public. Ironically, more attention has focused on data conversion and semantic errors due to the lack of availability in the results for data quality from the source data.
As a DRN, OHDSI has given the responsibility of ensuring the quality of source data to the individual data owners. Recently, Blacketer et al. developed the R package, named “Data Quality Dashboard (DQD)”, to evaluate the data quality of an OMOP CDM database according to Kahn’s data quality framework. Kahn’s framework is defined by three categories (conformance, completeness, and plausibility) and 2 data quality assessment contexts (verification and validation). Currently, OHDSI recommends using DQD to evaluate the data quality of CDM data.8)

CHARACTERIZATION

OHDSI provides a useful GUI tool called ATLAS. One of the main functions of ATLAS is the characterization of CDM data. Characterizing a population using descriptive statistics is an important first step in generating hypotheses about determinants of health and disease. The ATLAS provides four functions on characterization: database-level characterization, cohort characterization, treatment pathways, and incidence rates. Database-level characterization provides aggregated summary statistics to understand the data profile of the entire database. Cohort characterization describes aggregate summary statistics of the cohort of interest. Treatment pathway describes the sequence of interventions a person received over a period. Incidence measures the outcome rate of an outcome in a population during the time at risk.7)
An internationally collaborative study of OHDSI characterized diversity in treatment pathways of type 2 diabetes mellitus, hypertension, and depression across 11 data sources from EHRs and administrative claims data on 250 million patients from four countries, including Japan, South Korea, UK, and USA. The characterization study stated that the world is moving toward more consistent therapy over time across diseases and locations, but significant heterogeneity remains between sources.9)
Kostka et al.10) conducted a large-scale descriptive characterization study of 4.5 million coronavirus disease 2019 (COVID-19) cases using a federated network of CDM data partners in the USA, Europe (the Netherlands, Spain, the United Kingdom, Germany, France, and Italy), and Asia (South Korea and China). They noted similarities between the USA and Europe, but South Korea differed, with more women hospitalized than men. Common comorbidities included type 2 diabetes, hypertension, chronic kidney disease, and heart disease, and common presenting symptoms were dyspnea, cough, and fever. By characterizing baseline variability in patients and geography, they could provide critical context that might otherwise be misconstrued as data quality issues.
Brat et al.11) formed an international consortium (“4CE”) of 96 hospitals across 5 countries to address critical clinical and epidemiological questions about COVID-19. They utilized the “Informatics for Integrating Biology and the Bedside (i2b2)” or OMOP platforms to map a CDM. They focused on temporal changes in key laboratory test values and found hospital-level differences as well as country-level variation in the consortium. They proposed a framework to capture the trajectory of COVID-19 disease in patients and their response to interventions.

POPULATION-LEVEL ESTIMATION

A population-level effect estimate represents an estimate of the average causal effect of exposure to a particular health outcome. The first OHDSI study of population-level estimation for hypertension reported comparable effectiveness among three popular first-line dual combinations of antihypertensive medications in 5 databases across Korea and USA.12) Suchard et al.13) compared the comparative effectiveness and safety of first-line antihypertensive drug classes, including thiazide or thiazide-like diuretics, angiotensin-converting enzyme inhibitors, angiotensin receptor blockers, dihydropyridine calcium channel blockers, and non-dihydropyridine calcium channel blockers. The authors performed a systematic large-scale study under a new-user cohort design to estimate the relative risks of three primary outcomes (acute myocardial infarction, hospitalization for heart failure, and stroke), 6 secondary outcomes, and 46 safety outcomes comparing all first-line classes across a global network of 6 administrative claims and 3 EHR databases containing data of 4.9 million patients in OMOP CDM format. They generated 22,000 calibrated and propensity score-adjusted hazard ratios comparing all classes and outcomes across databases. In this study, researchers proposed the creation of a research framework, named “large-scale evidence generation across a network of databases (LEGEND)”.13) The LEGEND was initiated to avoid the shortcomings of observational studies, including residual confounding, P hacking, and publication bias. To establish a new paradigm for producing trustworthy evidence through observational studies, the LEGEND specified 10 criteria14):
  • 1. LEGEND will generate evidence at a large-scale.

  • 2. Dissemination of the evidence will not depend on the estimated effects.

  • 3. LEGEND will generate evidence using prespecified analysis design.

  • 4. LEGEND will generate evidence by consistently applying a systematic process across all research questions.

  • 5. LEGEND will generate evidence using best practice.

  • 6. LEGEND will include empirical evaluation through the use of control questions.

  • 7. LEGEND will generate evidence using open-source software that is freely available to all.

  • 8. LEGEND will not be used to evaluate new methods.

  • 9. LEGEND will generate evidence across a network of multiple databases.

  • 10. LEGEND will maintain data confidentiality; patient-level data will not be shared between sites in the network.

You et al.15) leveraged the LEGEND principles to assess the comparative effectiveness of acute myocardial infarction, stroke, and hospitalization for heart failure and safety of beta-blockers as first-line treatment for hypertension across three databases (2 administrative claim databases and 1 EHR-based database from 2001 to 2018) in the USA. The study found that many patients received first-line beta-blocker monotherapy for hypertension, and that the effectiveness and safety of atenolol versus third-generation beta-blockers were not significantly different. However, patients on third-generation beta-blockers had a higher risk of stroke than those on angiotensin-converting enzyme inhibitors and thiazide diuretics.
You et al.16) also assessed the association of ticagrelor versus clopidogrel with ischemic and hemorrhagic events in patients undergoing percutaneous coronary intervention (PCI) for acute coronary syndrome in clinical practice using two USA-based EHR databases and one nationwide South Korean database in OMOP CDM format. The primary endpoint was net adverse clinical events (NACE) at 12 months, and secondary endpoints included NACE or mortality, all-cause mortality, ischemic events, hemorrhagic events, individual components of the primary outcome, and dyspnea at 12 months. The study found that among patients with acute coronary syndrome who underwent PCI as routine clinical practice, the risk of NACE at 12 months was not significantly different between ticagrelor and clopidogrel. They tried to overcome the weakness of an observational study by adopting the LEGEND principles, including pre-specification of a statistical analytic plan, use of an active comparator, new-user cohort design, use of three large databases from the USA and Korea, creation of large-scale propensity score model, enrollment of 96 negative controls (falsification endpoint), and conduction of a large set of sensitivity analyses (144 analyses for one outcome).

PATIENT-LEVEL PREDICTION

Patient-level prediction is an essential package of ATLAS for building and validating machine learning models to predict diagnostic or prognostic outcomes, such as disease onset and progression, treatment choice, treatment response, treatment strategy, and treatment adherence, using clinical data in the OMOP CDM.17) The patient-level prediction package supports various machine learning algorithms, including regularized logistic regression, random forest, gradient boosting machines, decision tree, naive Bayes, K-nearest neighbor, neural network and deep learning (convolutional neural networks, recurrent neural network and deep nets), and custom algorithms. Compared to population-level estimation, the literature on predictive models using OMOP CDM is rare but is expected to increase in the future.
Although DRNs showed feasibility in epidemiologic studies, it is difficult to utilize its advantages in developing a patient-level prediction model using machine learning algorithms because the classical machine learning algorithm requires data centralization. Recently, a novel paradigm, named federated learning (FL), has recently been introduced and used in various medical research.18)19) However, one of the major obstacles of FL is the absence of a standardized data pipeline. Currently, local research collaborators had to create feature extraction codes and conduct the extraction themselves, which makes the data-driven approach impossible and causes data quality instability and poor transparency. It is well-known that even a few numbers of improper data can greatly harm the overall model performance, especially in FL.20) OMOP CDM can be a solution for standardizing the feature extraction process while assuring feature quality.21) ATLAS can improve code production, and a pre-established OMOP CDM network, such as FeederNet, can solve the problem of network connection, which is another major problem of FL.20)
A risk prediction model for COVID-19 was developed as an effort to screen high-risk populations for COVID-19 infection by using EHR data from 7,262 patients who were evaluated and/or tested for COVID-19 between January and June 2020.22) Moreover, a prediction model of major depressive disorder to bipolar disorder conversion was developed using five US databases and externally validated using nine clinical databases within the OHDSI network. The model’s area under the curve (AUC) varied across the 5 USA training databases (0.633–0.745) and across the nine external databases from USA, Korea, Germany, France, Belgium, and Japan (0.570–0.785).23) Furthermore, a fall risk prediction model using nursing notes, fall risk assessment sheets, patient acuity assessment sheets, and clinical observation sheets was developed. For the study, the authors converted 6,277 nursing statements, 747,049,486 clinical observation sheets, 1,554,775 fall risk scores, and 5,685,011 patient acuity scores into OMOP CDM. Although the AUC varied (0.692–0.726), it was better than the Hendrich II Fall Risk Model. It is notable that the authors standardized and utilized relatively unstructured nursing records.24)

AGGREGATE DATA META-ANALYSIS VERSUS INDIVIDUAL PARTICIPANT DATA META-ANALYSIS (POOLED ANALYSIS)

In the DRN, most studies are conducted without pooling patient-level data in the research network. Rather, analysis results without patient-level data from the identical study protocol and analysis code are pooled for meta-analysis.
Meta-analysis using individual patient-level data or individual participant data (IPD) meta-analysis (pooled analysis) requires obtaining individual patient data from published and unpublished studies, which is preferred over aggregate data meta-analysis.25) The reasons for this preference include potentials to address consistent inclusion and exclusion criteria, missing data, presence of results from unpublished studies, standardized statistical analysis, and uniform model assumptions across studies. However, pooled analysis takes longer to complete, costs significantly more, and faces more challenges in obtaining data than aggregate data meta-analyses.26) Most of the advantages of pooled analysis are also guaranteed in a DRN study without pooling patient-level data because sharing an end-to-end analytical study package in a DRN study also ensures consistent inclusion and exclusion criteria across the sites, addresses missing data, and includes results from unpublished studies. A meta-analysis in the DRN study can be equivalent to the 2-stage IPD meta-analysis, which derives aggregate data in each study separately then combines these in a traditional meta-analysis model. A previous empirical study showed that the results from 1- and 2-stage approaches were similar.27)
Nonetheless, the 2-stage method misleads the results when the number of outcomes is too small. Additionally, the two-stage method assumes that study treatment effect estimates have a normal sampling distribution and that their variances are known. Since this assumption is based on the central limit theorem, this method depends on the combination of the total number of participants, number of participants in target and comparator groups, and number of events/non-events in each group in each result. Therefore, these assumptions are unlikely to be appropriate when some or many of the included results are small (<30 participants), and it is even more unreliable for binary and time-to-event outcomes as the study-specific estimates and their variance are derived from the number of outcomes (non-outcomes) derives and not just the total participants.28) Therefore, Schuemie et al.29) proposed a non-normal approximation meta-analysis to yield a closer likelihood to the true value (from a one-stage pooled analysis) for Cox regression.

FUTURE PERSPECTIVES

Unstructured medical data, such as radiology images, bio-signals, and medical notes (free text), are essential for in-depth CDM analysis research. During the FeederNet project, they developed seven CDM extension data models for unstructured or semi-structured medical data, including genomics, radiology, lifelog data, vital signs, national emergency registry, geographic data, and medical notes. Conversion of free text in clinical notes or clinical reports into structured data will be necessary. Transferred learning, such as BERT or GPT-3, is a promising artificial intelligence tool for natural language processing to handle free text.
Despite the suite of diagnostics, the innate limitation for unconfoundedness cannot be ignored in an observational study. Furthermore, there are several questions that cannot be answered by an observational study because of a lack of equipoise in clinical practice. Pragmatic clinical trials based on nationwide CDM networks may provide an alternative. A pragmatic clinical trial (PCT) can inform a clinical or policy decision by providing evidence for adopting the intervention into real world clinical practice.30) To enable a PCT on the CDM network, data generated during treatment needs to be directly reflected in the CDM. Although the CDM does not update the EHR or claim data in real-time, it periodically provides updates. However, since many of the organizations connected to FeederNet update data daily, weekly, or monthly, the CDMs in Korea can be used for a PCT in the future.

CONCLUSION

Although the growing OMOP CDM network enables researchers to access data from tens or hundreds of millions of people across the world beyond current regulations, it should be noted that OMOP CDM itself is one of the proposed data standardization frames. Data standardization in healthcare is a daunting challenge that inevitably entails a trade-off between interoperability and data loss. Constant contribution and open collaboration may induce the evolution of this novel paradigm. Furthermore, rather than becoming obsessed with using this invaluable data network to publish in high-impact journals, researchers should constantly strive to generate reliable and transparent evidence and ways to contribute to the network.

Notes

Funding: This work was supported by the Bio Industrial Strategic Technology Development Program (20003883, 20005021) funded By the Ministry of Trade, Industry & Energy (MOTIE, Korea), and grants from the Korea Health Technology R&D Project through the Korea Health Industry Development Institute, funded by the Ministry of Health & Welfare, Republic of Korea (grant number: HR16C0001, HG22C0024).

Conflict of Interest: RW Park owns stock in Evidnet. SC You reports being CTO of PHI Digital Healthcare. The other authors declare no conflicts of financial interest in the subject matter or materials discussed in this manuscript.

Data Sharing Statement: The data generated in this study is available from the corresponding author upon reasonable request.

Author Contributions:

  • Conceptualization: You SC, Lee S, Choi B, Park RW.

  • Data curation: You SC, Park RW.

  • Formal analysis: You SC, Lee S, Choi B, Park RW.

  • Funding acquisition: Park RW.

  • Investigation: You SC, Park RW.

  • Methodology: You SC, Park RW.

  • Project administration: Park RW.

  • Resources: You SC, Park RW.

  • Supervision: Park RW.

  • Visualization: Lee S.

  • Writing - original draft: You SC, Lee S, Choi B, Park RW.

References

1. Stang PE, Ryan PB, Racoosin JA, et al. Advancing the science for active surveillance: rationale and design for the Observational Medical Outcomes Partnership. Ann Intern Med. 2010; 153:600–606. PMID: 21041580.
2. Overhage JM, Ryan PB, Reich CG, Hartzema AG, Stang PE. Validation of a common data model for active safety surveillance research. J Am Med Inform Assoc. 2012; 19:54–60. PMID: 22037893.
3. Hripcsak G, Duke JD, Shah NH, et al. Observational Health Data Sciences and Informatics (OHDSI): opportunities for observational researchers. Stud Health Technol Inform. 2015; 216:574–578. PMID: 26262116.
4. Hripcsak G. OHDSI 2022 state of the community [Internet]. place unknown: Observational Health Data Sciences and Informatics;2022. cited 2022 October 23. Available from: https://www.ohdsi.org/wp-content/uploads/2022/10/OHDSI2022-state-of-community-Hripcsak-FDA-Titans.pdf.
5. Haendel MA, Chute CG, Robinson PN. Classification, ontology, and precision medicine. N Engl J Med. 2018; 379:1452–1462. PMID: 30304648.
6. Seong Y, You SC, Ostropolets A, et al. Incorporation of Korean electronic data interchange vocabulary into observational medical outcomes partnership vocabulary. Healthc Inform Res. 2021; 27:29–38. PMID: 33611874.
7. Yoon D, Ahn EK, Park MY, et al. Conversion and data quality assessment of electronic health record data at a Korean tertiary teaching hospital to a common data model for distributed network research. Healthc Inform Res. 2016; 22:54–58. PMID: 26893951.
8. Blacketer C, Defalco FJ, Ryan PB, Rijnbeek PR. Increasing trust in real-world evidence through evaluation of observational data quality. J Am Med Inform Assoc. 2021; 28:2251–2257. PMID: 34313749.
9. Hripcsak G, Ryan PB, Duke JD, et al. Characterizing treatment pathways at scale using the OHDSI network. Proc Natl Acad Sci U S A. 2016; 113:7329–7336. PMID: 27274072.
10. Kostka K, Duarte-Salles T, Prats-Uribe A, et al. Unraveling COVID-19: a large-scale characterization of 4.5 million COVID-19 cases using CHARYBDIS. Clin Epidemiol. 2022; 14:369–384. PMID: 35345821.
11. Brat GA, Weber GM, Gehlenborg N, et al. International electronic health record-derived COVID-19 clinical course profiles: the 4CE consortium. NPJ Digit Med. 2020; 3:109. PMID: 32864472.
12. You SC, Jung S, Swerdel JN, et al. Comparison of first-line dual combination treatments in hypertension: real-world evidence from multinational heterogeneous cohorts. Korean Circ J. 2020; 50:52–68. PMID: 31642211.
13. Suchard MA, Schuemie MJ, Krumholz HM, et al. Comprehensive comparative effectiveness and safety of first-line antihypertensive drug classes: a systematic, multinational, large-scale analysis. Lancet. 2019; 394:1816–1826. PMID: 31668726.
14. Schuemie MJ, Ryan PB, Pratt N, et al. Principles of Large-scale Evidence Generation and Evaluation across a Network of Databases (LEGEND). J Am Med Inform Assoc. 2020; 27:1331–1337. PMID: 32909033.
15. Chan You S, Krumholz HM, Suchard MA, et al. Comprehensive comparative effectiveness and safety of first-line β-blocker monotherapy in hypertensive patients: a large-scale multicenter observational study. Hypertension. 2021; 77:1528–1538. PMID: 33775125.
16. You SC, Rho Y, Bikdeli B, et al. Association of ticagrelor vs clopidogrel with net adverse clinical events in patients with acute coronary syndrome undergoing percutaneous coronary intervention. JAMA. 2020; 324:1640–1650. PMID: 33107944.
17. Reps JM, Schuemie MJ, Suchard MA, Ryan PB, Rijnbeek PR. Design and implementation of a standardized framework to generate and evaluate patient-level prediction models using observational healthcare data. J Am Med Inform Assoc. 2018; 25:969–975. PMID: 29718407.
18. Rieke N, Hancox J, Li W, et al. The future of digital health with federated learning. NPJ Digit Med. 2020; 3:119. PMID: 33015372.
19. Dayan I, Roth HR, Zhong A, et al. Federated learning for predicting clinical outcomes in patients with COVID-19. Nat Med. 2021; 27:1735–1743. PMID: 34526699.
20. Mamidi TK, Tran-Nguyen TK, Melvin RL, Worthey EA. Development of an individualized risk prediction model for COVID-19 using electronic health record data. Front Big Data. 2021; 4:675882. PMID: 34151259.
21. Tong J, Luo C, Islam MN, et al. Distributed learning for heterogeneous clinical data with application to integrating COVID-19 data across 230 sites. NPJ Digit Med. 2022; 5:76. PMID: 35701668.
22. Williams RD, Markus AF, Yang C, et al. Seek COVER: using a disease proxy to rapidly develop and validate a personalized risk calculator for COVID-19 outcomes in an international network. BMC Med Res Methodol. 2022; 22:35. PMID: 35094685.
23. Nestsiarovich A, Reps JM, Matheny ME, et al. Predictors of diagnostic transition from major depressive disorder to bipolar disorder: a retrospective observational network study. Transl Psychiatry. 2021; 11:642. PMID: 34930903.
24. Jung H, Yoo S, Kim S, et al. Patient-Level fall risk prediction using the observational medical outcomes partnership’s common data model: pilot feasibility study. JMIR Med Inform. 2022; 10:e35104. PMID: 35275076.
25. Riley RD, Lambert PC, Abo-Zaid G. Meta-analysis of individual participant data: rationale, conduct, and reporting. BMJ. 2010; 340:c221. PMID: 20139215.
26. Cooper H, Patall EA. The relative benefits of meta-analysis conducted with individual participant data versus aggregated data. Psychol Methods. 2009; 14:165–176. PMID: 19485627.
27. Selmer R, Haglund B, Furu K, et al. Individual-based versus aggregate meta-analysis in multi-database studies of pregnancy outcomes: the Nordic example of selective serotonin reuptake inhibitors and venlafaxine in pregnancy. Pharmacoepidemiol Drug Saf. 2016; 25:1160–1169. PMID: 27193296.
28. La Gamba F, Corrao G, Romio S, et al. Combining evidence from multiple electronic health care databases: performances of one-stage and two-stage meta-analysis in matched case-control studies. Pharmacoepidemiol Drug Saf. 2017; 26:1213–1219. PMID: 28799196.
29. Schuemie MJ, Chen Y, Madigan D, Suchard MA. Combining cox regressions across a heterogeneous distributed research network facing small and zero counts. Stat Methods Med Res. 2022; 31:438–450. PMID: 34841975.
30. Marquis-Gravel G, Roe MT, Robertson HR, et al. Rationale and design of the Aspirin Dosing-A Patient-Centric Trial Assessing Benefits and Long-term Effectiveness (ADAPTABLE) trial. JAMA Cardiol. 2020; 5:598–607. PMID: 32186653.
TOOLS
Similar articles