Journal List > J Korean Med Sci > v.37(50) > 1516080814

Gim, Lee, Kim, Baek, and Yoo: Demographic and Genome Wide Association Analyses According to Muscle Mass Using Data of the Korean Genome and Epidemiology Study

Abstract

Background

Sarcopenia is commonly found in the elderly due to a decline in muscle mass. Many researchers have performed genome-wide association studies (GWAS) to find genetic risk factors of sarcopenia. Although many studies have discovered sarcopenia associated single nucleotide polymorphisms (SNPs), most of them are studies targeting Caucasians. The purpose of this study was to evaluate genetic correlation according to muscle mass in middle aged Koreans using data of the Korean Genome and Epidemiology Study (KOGES), a large population-based genomic cohort study.

Methods

Baseline participants were 10,030 subjects aged 40 to 69 years who were from Ansan or Anseong in Gyeonggi-do, South Korea. Among them, 9,351 subjects with laboratory data available were included in this study. To identify sarcopenia associated variants, those in the top 30% and bottom 30% of muscle mass index (MMI) were compared. A total of 7,452 people with an MMI of 30-70% were excluded. A total of 1,004 people were also excluded due to missing data. Finally, 895 people were selected for this study. The Korea Biobank Array generated 500,568 SNPs for this dataset.

Results

When subjects were divided into top 30% and bottom 30% of MMI, the top 30% had 169 men and 308 women and the bottom 30% had 220 men and 198 women. In men, age, body mass index (BMI), waist and hip were significantly (P < 0.005) different between top 30% and bottom 30% MMI groups. In women, age, BMI, waist, hip, and hypertension history were significantly different between the two MMI groups. There were 13 significant SNPs in men and 14 significant SNPs in women. Genes associated with variants in men based on the single-nucleotide polymorphism database (dbSNP) were LRP1B containing rs11679458 and RGS6 containing rs11848300. A gene associated with variants in women was Pi4K2A, which contained rs1189312 as a variant. In addition, rs11189312 was associated with expression quantitative trait loci (eQTL) of ZFYVE27 in skeletal muscles and other SNPs of ZFYVE27 (rs10882883, rs17108378, rs35077384) known to be associated with spastic paraplegia. The eQTL analysis revealed that rs11189312 was a variant associated with SNPs of ZFYVE27.

Conclusions

In the demographic study, significant results were found in BMI, waist, hip, history of hyperlipidemia, and sedentary life status in male group, and significant results were found in BMI, waist, hip, and hypertension history in female group. Variant rs11189312 was found to be a novel variant affecting ZFYVE27 expressed in skeletal muscles, suggesting that rs11189312 might be related to sarcopenia as a novel discovery of this study. Further study is needed to determine the association between sarcopenia and ZFYVE27 known to be associated with spastic paraplegia.

Graphical Abstract

jkms-37-e346-abf001.jpg

INTRODUCTION

Sarcopenia, a generalized disorder of skeletal muscle, is commonly found in the elderly due to a decline in muscle mass.1 It is known that muscle mass shows decline every year after the age of 30. Such decline is associated with an increased risk of other disorders such as decreased activity, hormonal changes, and digestive disability.2345 Previous research studies have revealed that sarcopenia has multiple contributing factors, including inflammatory pathway, adiposity, and chronic diseases.678 In addition, sarcopenia is heavily influenced by external variables such as diet, exercise, and lifestyle.91011
Recently, scientists are interested in genetic factors that influence skeletal muscle traits for evaluating the heritability of sarcopenia. Several detailed gene-targeted linkage analyses have been performed for insulin like growth factor 1 (IGF-1),12 myostatin (MSTN),13 activin A receptor type 1B (ACVR1B),14 and so on. Variants contributing to the genetic influence on skeletal muscle traits have also been studied. For example, angiotensin-converting enzyme (ACE) has been investigated in many polymorphism studies,151617 although several studies have reported that there are no significant on muscle traits.181920 Alpha-actinin-3 (ACTN3)2122 and vitamin D receptor (VDR)232425 are well known factors associated with muscle strength for possessing multiple polymorphisms.
Many researchers have performed genome-wide association studies (GWAS) to find genetic risk factors of a specific disease. Various single nucleotide polymorphisms (SNPs) have already been found in sarcopenia.2627 SNP is a single base pair mutation in a DNA sequence that can affect gene function and regulation. Although many sarcopenia associated SNPs have been discovered in Caucasians,627 candidate SNPs and related genes in Asians have not been well established yet.
Therefore, the purpose of this study was to evaluate genetic correlation according to muscle mass in middle aged Koreans using data from the Korean Genome and Epidemiology Study (KOGES), a large population-based genomic cohort study.

METHODS

Study subjects

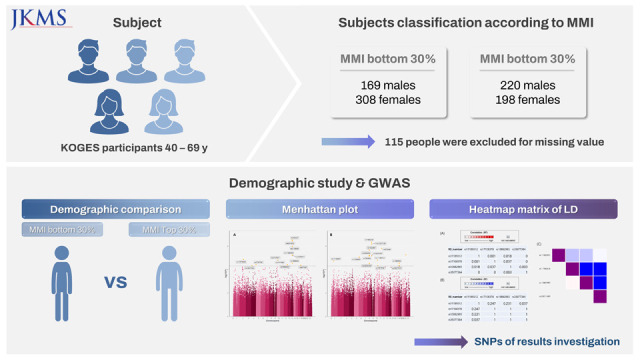
Epidemiological and genomic data sets in this study were from Ansan and Anseong cohorts of the KOGES conducted by National Research Institute of Health, Centers for Disease Control and Prevention, Ministry for Health and Welfare, Republic of Korea. Baseline participants were 10,030 Koreas aged 40 to 69 years who were from Ansan or Anseong of Gyeonggi-do (province), South Korea. Among them, 9,351 subjects with laboratory data available were included in this study.
To identify sarcopenia associated variants, those in the top 30% and bottom 30% of muscle mass index (MMI) were compared. A total of 7,452 people with an MMI of 30–70% were excluded. A total of 1,004 people were also excluded due to missing data. Finally, 895 people were selected for the demographic study. Of these 895 people, 48 were not included in the SNP survey and 67 showed outlier in GWAS analysis. Finally, 780 subjects were included for the GWAS analysis.

Measurements of lifestyle and comorbidities

All participants attended a community clinic for clinical assessments at each follow-up visit. Body mass index (BMI) was calculated as weight in kg divided by the square of the height in meters. Weight was obtained for participants in light clothing and barefoot. Waist and hip circumference were also measured. The remaining survey items consisted of drinking & smoking status, the level of education, and monthly income. We also obtained their history of hypertension, diabetes, gastritis/stomach ulcer, allergy, myocardial infarction, thyroid disorder, congestive heart failure, coronary artery disease, hyperlipidemia, asthma, chronic lung disorder, peripheral vascular disease, kidney disease, various tumors, cerebrovascular disease, head trauma, urinary tract infection, gout, degenerative arthritis, and rheumatoid arthritis.

Study genotypes

Genotyping of the cohort population was performed using Affymetrix Genome-Wide Human SNP array 5.0 (Affymetix Inc., Santa Clara, CA, USA). The Korea Biobank Array generated 500,568 SNPs for this dataset. We used P values for selecting significant SNPs between people in the top 30% and people in the bottom 30% of MMI. We additionally queried alleles, minor allele frequencies (MAF), and associated genes via Single-Nucleotide Polymorphism database (dbSNP) at the National Center for Biotechnology information (www.ncbi.nlm.nih.gov/projects/SNP/). We used ALFA data for MAF containing data of subjects from 12 diverse populations, including Asian, African, European, and others.
We assessed whether candidate variants were related to specific gene expression in other various tissues by expression quantitative trait loci (eQTL) analyses using a database of the genotype-tissue expression (GTEx) project. Among them, genes associated with sarcopenia or muscle-related diseases by eQTL analysis were identified. Other variants known to be polymorphism or disease associated variants of identified genes were found through dbSNP. We then performed an interactive heatmap matrix of pairwise linkage disequilibrium (LD matrix) statistics to find out if variants we found were related to known variants using LD link (https://ldlink.nci.nih.gov/).

Statistical analysis

Continuous data are reported as mean ± standard deviation. Categorical data are presented as number (%). To find any significant differences in baseline characteristics and clinical factors between people in the top 30% and people in the bottom 30% of MMI, an unpaired t-test was performed for continuous variables showing normal distribution. Otherwise, Wilcoxon’s rank-sum test was performed. Difference in proportion between people in the top 30% and people in the bottom 30% of MMI was tested using χ2 test for categorical variables. If the assumption of χ2 test did not meet, Fisher’s exact test was performed. PLINK and R software 4.1.0 (R Core Team, R Foundation for Statistical Computing, Vienna, Austria, 2020) were used to conduct statistical analysis (version 1.9). The significance level was set at P < 0.05. The PLINK software was used to filter out SNPs that were irrelevant. Genotyping call rate (0.05) was used as the SNP filtering parameter to exclude missing genotypes of SNPs. Significant SNPs between people in the top 30% and people in the bottom 30% of MMI are presented by a Manhattaplot using qqman package version 0.1.8 of R software.

Ethics statement

This study was approved by the Institutional Review Board (IRB) of Gyeongsang National University (approval number: GNUIRB-2019-04-010-013). All study subjects provided written informed consent.

RESULTS

General characteristics for demographic study

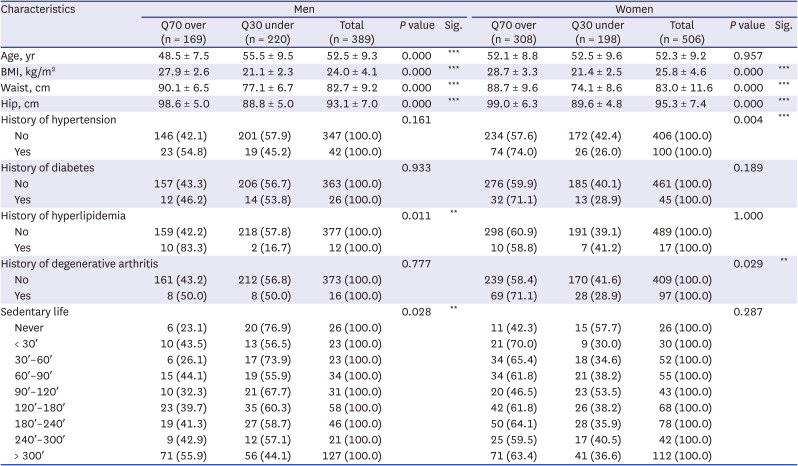
When subjects were divided into the top 30% and bottom 30% of MMI, top 30% people had 169 men and 308 women and bottom 30% people had 220 men and 198 women. In men, statistically significant differences in age, BMI, waist, hip, history of hyperlipidemia, and sedentary life status were observed between top 30% and bottom 30% of MMI groups. Particularly, age, BMI, waist and hip showed significant differences between the two groups with P value less than 0.005. In women, age, BMI, waist, hip, and hypertension history also showed significant differences between top 30% and bottom 30% of MMI groups (Table 1). Results for all demographics are presented in Supplementary Table 1.
Table 1

Demographic study containing significant results

jkms-37-e346-i001
Characteristics Men Women
Q70 over (n = 169) Q30 under (n = 220) Total (n = 389) P value Sig. Q70 over (n = 308) Q30 under (n = 198) Total (n = 506) P value Sig.
Age, yr 48.5 ± 7.5 55.5 ± 9.5 52.5 ± 9.3 0.000 *** 52.1 ± 8.8 52.5 ± 9.6 52.3 ± 9.2 0.957
BMI, kg/m2 27.9 ± 2.6 21.1 ± 2.3 24.0 ± 4.1 0.000 *** 28.7 ± 3.3 21.4 ± 2.5 25.8 ± 4.6 0.000 ***
Waist, cm 90.1 ± 6.5 77.1 ± 6.7 82.7 ± 9.2 0.000 *** 88.7 ± 9.6 74.1 ± 8.6 83.0 ± 11.6 0.000 ***
Hip, cm 98.6 ± 5.0 88.8 ± 5.0 93.1 ± 7.0 0.000 *** 99.0 ± 6.3 89.6 ± 4.8 95.3 ± 7.4 0.000 ***
History of hypertension 0.161 0.004 ***
No 146 (42.1) 201 (57.9) 347 (100.0) 234 (57.6) 172 (42.4) 406 (100.0)
Yes 23 (54.8) 19 (45.2) 42 (100.0) 74 (74.0) 26 (26.0) 100 (100.0)
History of diabetes 0.933 0.189
No 157 (43.3) 206 (56.7) 363 (100.0) 276 (59.9) 185 (40.1) 461 (100.0)
Yes 12 (46.2) 14 (53.8) 26 (100.0) 32 (71.1) 13 (28.9) 45 (100.0)
History of hyperlipidemia 0.011 ** 1.000
No 159 (42.2) 218 (57.8) 377 (100.0) 298 (60.9) 191 (39.1) 489 (100.0)
Yes 10 (83.3) 2 (16.7) 12 (100.0) 10 (58.8) 7 (41.2) 17 (100.0)
History of degenerative arthritis 0.777 0.029 **
No 161 (43.2) 212 (56.8) 373 (100.0) 239 (58.4) 170 (41.6) 409 (100.0)
Yes 8 (50.0) 8 (50.0) 16 (100.0) 69 (71.1) 28 (28.9) 97 (100.0)
Sedentary life 0.028 ** 0.287
Never 6 (23.1) 20 (76.9) 26 (100.0) 11 (42.3) 15 (57.7) 26 (100.0)
< 30′ 10 (43.5) 13 (56.5) 23 (100.0) 21 (70.0) 9 (30.0) 30 (100.0)
30′–60′ 6 (26.1) 17 (73.9) 23 (100.0) 34 (65.4) 18 (34.6) 52 (100.0)
60′–90′ 15 (44.1) 19 (55.9) 34 (100.0) 34 (61.8) 21 (38.2) 55 (100.0)
90′–120′ 10 (32.3) 21 (67.7) 31 (100.0) 20 (46.5) 23 (53.5) 43 (100.0)
120′–180′ 23 (39.7) 35 (60.3) 58 (100.0) 42 (61.8) 26 (38.2) 68 (100.0)
180′–240′ 19 (41.3) 27 (58.7) 46 (100.0) 50 (64.1) 28 (35.9) 78 (100.0)
240′–300′ 9 (42.9) 12 (57.1) 21 (100.0) 25 (59.5) 17 (40.5) 42 (100.0)
> 300′ 71 (55.9) 56 (44.1) 127 (100.0) 71 (63.4) 41 (36.6) 112 (100.0)
Continuous data are reported as mean ± standard deviation and categorical data are presented as number (%).
BMI = body mass index.
**P < 0.01, ***P < 0.001.

GWAS study

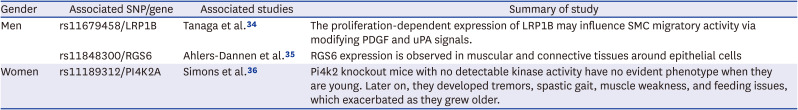
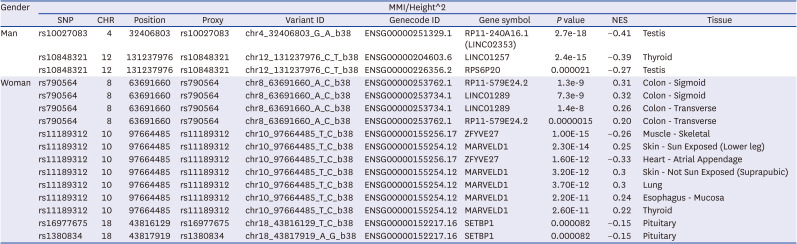
GWAS results are presented with a Manhattan plot (Fig. 1). There were 13 significant SNPs in the male group and 14 significant SNPs in the female group. QQ plots also showed GWAS results against expected association results between people in the top 30% and people in the bottom 30% of MMI (Fig. 2). All results of significant SNPs containing related genes are shown in Table 2. All results of SNPs of the present study are represented in Supplementary Table 2. Genes associated with variants in the male group identified using the dbSNP were LRP1B containing rs11679458 and RGS6 containing rs11848300. Pi4K2A was a gene associated with variants in the female group. It also contained rs1189312 as a variant. Published studies about identified genes are presented in Table 3.
Fig. 1

Manhattan plot of each group classified by gender. (A) Manhattan plot in the men group, (B) Manhattan plot in the women group.
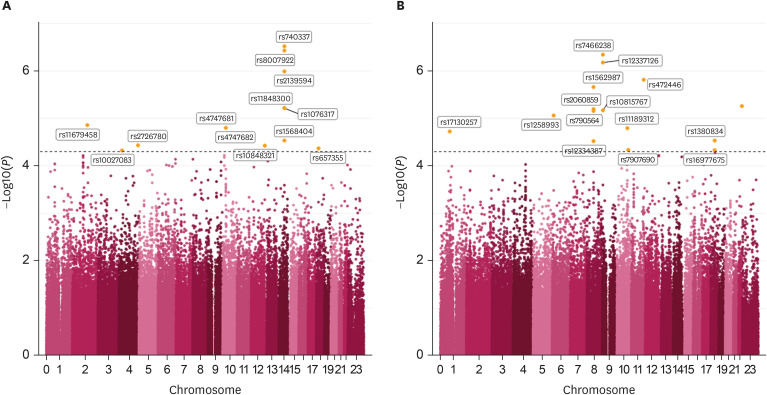
jkms-37-e346-g001
Fig. 2

Q-Q plot of each group classified by gender. (A) Q-Q plot in the men group. (B) Q-Q plot in the women group.

Q-Q = Quantile-Quantile.
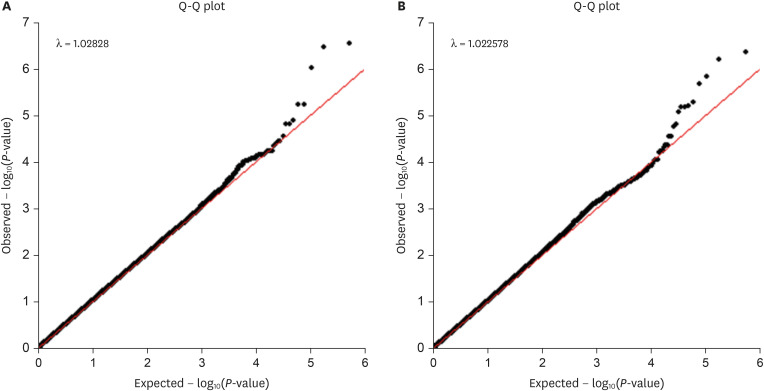
jkms-37-e346-g002
Table 2

SNPs results of GWAS data containing related genes
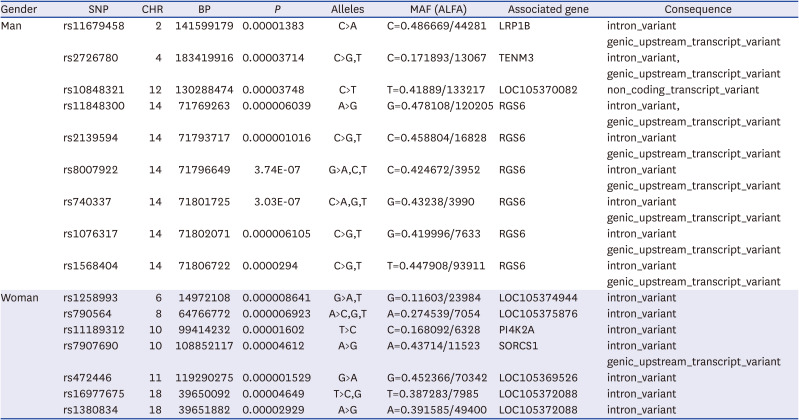
jkms-37-e346-i002
Gender SNP CHR BP P Alleles MAF (ALFA) Associated gene Consequence
Man rs11679458 2 141599179 0.00001383 C>A C=0.486669/44281 LRP1B intron_variant
genic_upstream_transcript_variant
rs2726780 4 183419916 0.00003714 C>G,T C=0.171893/13067 TENM3 intron_variant,
genic_upstream_transcript_variant
rs10848321 12 130288474 0.00003748 C>T T=0.41889/133217 LOC105370082 non_coding_transcript_variant
rs11848300 14 71769263 0.000006039 A>G G=0.478108/120205 RGS6 intron_variant,
genic_upstream_transcript_variant
rs2139594 14 71793717 0.000001016 C>G,T C=0.458804/16828 RGS6 intron_variant
genic_upstream_transcript_variant
rs8007922 14 71796649 3.74E-07 G>A,C,T C=0.424672/3952 RGS6 intron_variant
genic_upstream_transcript_variant
rs740337 14 71801725 3.03E-07 C>A,G,T G=0.43238/3990 RGS6 intron_variant
genic_upstream_transcript_variant
rs1076317 14 71802071 0.000006105 C>G,T G=0.419996/7633 RGS6 intron_variant
genic_upstream_transcript_variant
rs1568404 14 71806722 0.0000294 C>G,T T=0.447908/93911 RGS6 intron_variant
genic_upstream_transcript_variant
Woman rs1258993 6 14972108 0.000008641 G>A,T G=0.11603/23984 LOC105374944 intron_variant
rs790564 8 64766772 0.000006923 A>C,G,T A=0.274539/7054 LOC105375876 intron_variant
rs11189312 10 99414232 0.00001602 T>C C=0.168092/6328 PI4K2A intron_variant
rs7907690 10 108852117 0.00004612 A>G A=0.43714/11523 SORCS1 intron_variant
genic_upstream_transcript_variant
rs472446 11 119290275 0.000001529 G>A G=0.452366/70342 LOC105369526 intron_variant
rs16977675 18 39650092 0.00004649 T>C,G T=0.387283/7985 LOC105372088 intron_variant
rs1380834 18 39651882 0.00002929 A>G A=0.391585/49400 LOC105372088 intron_variant
SNPs = single nucleotide polymorphisms, GWAS = genome-wide association studies, CHR = chromosome, MAF = minor allele frequencies.
Table 3

Summary of muscle atrophy related genes

jkms-37-e346-i003
Gender Associated SNP/gene Associated studies Summary of study
Men rs11679458/LRP1B Tanaga et al.34 The proliferation-dependent expression of LRP1B may influence SMC migratory activity via modifying PDGF and uPA signals.
rs11848300/RGS6 Ahlers-Dannen et al.35 RGS6 expression is observed in muscular and connective tissues around epithelial cells
Women rs11189312/PI4K2A Simons et al.36 Pi4k2 knockout mice with no detectable kinase activity have no evident phenotype when they are young. Later on, they developed tremors, spastic gait, muscle weakness, and feeding issues, which exacerbated as they grew older.
SNP = single nucleotide polymorphism, PDGF = platelet-derived growth factor, uPA = urokinase-type plasminogen activator.
We also conducted eQTL analysis to assess whether candidate variants were related to specific gene expression in other various tissues. As a result, rs10027083 and rs10848321 in men and rs790564, rs11189312, rs16977675, and rs1380834 in women were eQTL in each gene. Among them, only rs11189312 in women was eQTL of ZFYVE27 in skeletal muscles. It showed very significant results. Therefore, other variants associated with ZFYVE27 and skeletal muscle related disease were investigated using dbSNP. Finally, a total of three polymorphisms (rs10882883, rs17108378, and rs35077384) were identified, including one disease (spastic paraplegia) related polymorphism. We also conducted LD matrix statistics to determine whether rs11189312 was related to those variants (Fig. 3). The LD heatmap plot was prepared using reference population of East Asian. The result showed that rs11189312 had little relevance to other variants. Rs11189312 had R squared values of 0.001, 0.018, and 0 with D prime values of 0.247, 0.231, and 0.037 against rs17108378, rs10882993, and rs35077384, respectively. All significant results of eQTL analysis in GTEx containing related genes are shown in Table 4. All eQTL analysis results are presented in Supplementary Table 3.
Fig. 3

Interactive heatmap matrix of pairwise linkage disequilibrium statistics in rs11189312 and ZFYVE27 associated SNPs. (A) All pairwise R square statistics. (B) All pairwise D prime statistics. (C) Interactive heat map of associated SNPs.

SNP = single nucleotide polymorphism.
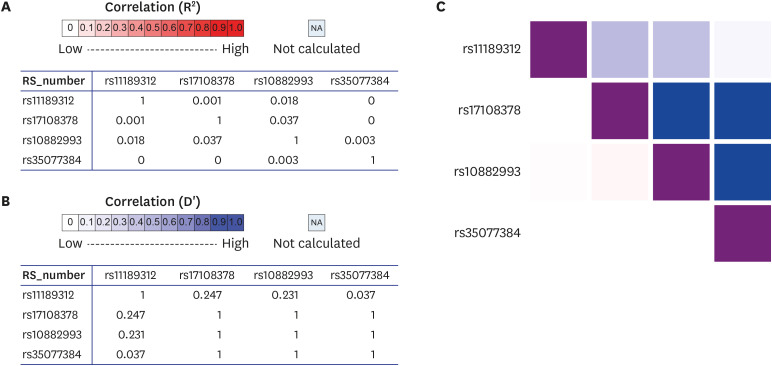
jkms-37-e346-g003
Table 4

eQTL analysis in GTEx containing related genes

jkms-37-e346-i004
Gender MMI/Height^2
SNP CHR Position Proxy Variant ID Genecode ID Gene symbol P value NES Tissue
Man rs10027083 4 32406803 rs10027083 chr4_32406803_G_A_b38 ENSG00000251329.1 RP11-240A16.1 (LINC02353) 2.7e-18 −0.41 Testis
rs10848321 12 131237976 rs10848321 chr12_131237976_C_T_b38 ENSG00000204603.6 LINC01257 2.4e-15 −0.39 Thyroid
rs10848321 12 131237976 rs10848321 chr12_131237976_C_T_b38 ENSG00000226356.2 RPS6P20 0.000021 −0.27 Testis
Woman rs790564 8 63691660 rs790564 chr8_63691660_A_C_b38 ENSG00000253762.1 RP11-579E24.2 1.3e-9 0.31 Colon - Sigmoid
rs790564 8 63691660 rs790564 chr8_63691660_A_C_b38 ENSG00000253734.1 LINC01289 7.3e-9 0.32 Colon - Sigmoid
rs790564 8 63691660 rs790564 chr8_63691660_A_C_b38 ENSG00000253734.1 LINC01289 1.4e-8 0.26 Colon - Transverse
rs790564 8 63691660 rs790564 chr8_63691660_A_C_b38 ENSG00000253762.1 RP11-579E24.2 0.0000015 0.20 Colon - Transverse
rs11189312 10 97664485 rs11189312 chr10_97664485_T_C_b38 ENSG00000155256.17 ZFYVE27 1.00E-15 −0.26 Muscle - Skeletal
rs11189312 10 97664485 rs11189312 chr10_97664485_T_C_b38 ENSG00000155254.12 MARVELD1 2.30E-14 0.25 Skin - Sun Exposed (Lower leg)
rs11189312 10 97664485 rs11189312 chr10_97664485_T_C_b38 ENSG00000155256.17 ZFYVE27 1.60E-12 −0.33 Heart - Atrial Appendage
rs11189312 10 97664485 rs11189312 chr10_97664485_T_C_b38 ENSG00000155254.12 MARVELD1 3.20E-12 0.3 Skin - Not Sun Exposed (Suprapubic)
rs11189312 10 97664485 rs11189312 chr10_97664485_T_C_b38 ENSG00000155254.12 MARVELD1 3.70E-12 0.3 Lung
rs11189312 10 97664485 rs11189312 chr10_97664485_T_C_b38 ENSG00000155254.12 MARVELD1 2.20E-11 0.24 Esophagus - Mucosa
rs11189312 10 97664485 rs11189312 chr10_97664485_T_C_b38 ENSG00000155254.12 MARVELD1 2.60E-11 0.22 Thyroid
rs16977675 18 43816129 rs16977675 chr18_43816129_T_C_b38 ENSG00000152217.16 SETBP1 0.000082 −0.15 Pituitary
rs1380834 18 43817919 rs1380834 chr18_43817919_A_G_b38 ENSG00000152217.16 SETBP1 0.000082 −0.15 Pituitary
eQTL = expression quantitative trait loci, GTEx = geonotype-tissue expression, MMI = muscle mass index, SNP = single nucleotide polymorphism, CHR = chromosome, NES = normalized effect size.

DISCUSSION

In the present study, demographic analysis was conducted based on MMI adjusted by square of height. Age, BMI, waist and hip showed significant results in men. These are obesity-related factors associated with muscle loss.28 In particular, significance was found in people who had a history of asthma disease. As people age, their respiratory muscle mass decreases, their respiratory muscle strength weakens, and their respiratory function deteriorates.29 Several studies have consistently revealed the association between respiratory diseases (such as asthma) and sarcopenia or muscle loss.2930 In addition, the MMI adjustment value tended to be low in people who had a sedentary life. In women, there were significant differences in BMI, waist and hip. However, there was no significant difference in age. In particular, there was a significant difference in people with a history of degenerative arthritis. Muscle wasting as a natural part of aging has recently been proven in individuals with OA.3132 It has been suggested that muscle wasting has a direct impact on joint stability and that loss of mobility can lead to articular cartilage degeneration.33
GWAS was performed to determine the relationship between muscular study and each SNP associated genes. In men, rs11679458 was an intron variant of LRP1B. It has been suggested that proliferation-dependent expression of LRP1B may influence SMC migratory activity by modifying platelet-derived growth factor (PDGF) and urokinase-type plasminogen activator (uPA) signals.34 Rs11848300 is an introgenic variant of RGS6 because its expression is observed in muscular tissues around epithelial cells.35 In women, rs11189312 was an intronic variant of PI4K2A. One study has shown that Pi4k2 is associated with aging-related muscle weakness.36 Pi4k2 knockout mice without detectable kinase activity had no evident phenotype when they were young. However, when they grew older, they developed tremors, spastic gait, muscle weakness, and feeding issues that exacerbated as time went by.36
Sarcopenia is a well-known aging-related disease. Recent studies have suggested that neuromuscular junction (NMJ) degeneration progresses with the onset of sarcopenia during aging.3738 NMJ is a complicated synapse that connects muscle fibers to motor neurons. Its damage and morphological change gradually occur during aging, causing muscle paralysis or weakness.39 Spastin is an ATPase-containing domain that can interact with microtubules.40 According to one study, knockdown of spastin localized at the NMJ of Drosophila results in synaptic undergrowth.41 In vitro studies have shown that spastin can regulate stabilization of microtubules to maintain activity.4243 In addition, previous research studies have shown that mutation of spastin could result in hereditary spastic paraplegia, a neurological disorder with progressive spasticity and weakness of leg muscle.444546 Therefore, patients with genetic factors that can induce mutation in spastin could be congenitally vulnerable to muscle loss and growth.
SNP rs11189312 has not been reported in association studies. However, our study revealed that rs11189312 could affect ZFYVE27 gene. ZFYVE27, also known as SPG33, belongs to the FYVE-finger family of proteins responsible for regulating endocytic membrane trafficking.474849 According to one study, ZFYVE27 can interact with endogenous spastin whose mutation is the most common cause for hereditary spastic paraplegia.47 In our study, eQTL analyses using GTEx showed rs11189312 in skeletal muscle for ZFYVE27 with a P value of 1.00E-15. As rs10882993, rs17108378, and rs35077384 were reported SNPs of ZFYVE27 in dbSNP database, we conducted LD matrix statistics to identify whether rs11189312 was associated with those reported SNPs. Our results only showed a slight correlation. Therefore, rs11189312 could be a novel variant affecting ZFYVE27 expressed mainly in skeletal muscles. This indicates that rs11189312 could lead to muscle disability or damage by affecting ZFYVE27 function. It might also be directly associated with sarcopenia because people in the bottom 30% of MMI showed more significant results than those in the top 30% of MMI in the present study.
In the present study, people in the bottom 30% of MMI group were vulnerable to muscle loss. Thus, nutrition and exercise should be paid attention to. Since GWAS analysis focuses on identification of SNPs as biomarkers for specific diseases, early screening of high-risk groups for sarcopenia and clinical treatment will be required.50 In addition, results of present study including SNPs and genes can be used in the development of new drugs. Therefore, genetic results from a GWAS study could lead to clinical significance through research and development of biomarkers.
In conclusion, the present nation-wide study in Korea had the largest size reported for identifying sarcopenia associated factors. Demographic study and GWAS were performed by dividing participants into a group with a high muscle mass and a group with a low muscle mass based on MMI adjusted by square of height. Particularly, rs11189312 might be associated with sarcopenia. It was a novel discovery in our study. Based on our variant results, further study is needed to determine the association between sarcopenia and ZFYVE27 which might play an important role in spastin.
The present study has some limitations. First, there was no restriction on compositions of participants due to cohort research. Second, sarcopenia screening was not conducted using tests such as handgrip test. Third, a further study of newly identified variants is needed for evaluating their genetic influence on the onset of sarcopenia.

Notes

Funding: This study was conducted with support from the Rural Development Administration (PJ014155052019).

Disclosure: The authors have no potential conflicts of interest to disclose.

Author Contributions:

  • Conceptualization: Yoo JI.

  • Data curation: Kim SC, Yoo JI.

  • Formal analysis: Gim JA, Lee S, Kim SC.

  • Funding acquisition: Yoo JI.

  • Investigation: Lee S, Kim SC, Baek \\xe2\\x80\\xaaW.

  • Methodology: Gim JA, Lee S, Yoo JI.

  • Project administration: Yoo JI.

  • Resources: Yoo JI.

  • Software: Kim SC.

  • Supervision: Yoo JI.

  • Validation: Gim JA, Yoo JI.

  • Visualization: Lee S.

  • Writing - original draft: Lee S.

  • Writing - review & editing: Gim JA, Yoo JI.

References

1. Cruz-Jentoft AJ, Bahat G, Bauer J, Boirie Y, Bruyère O, Cederholm T, et al. Sarcopenia: revised European consensus on definition and diagnosis. Age Ageing. 2019; 48(1):16–31. PMID: 30312372.
2. Bijlsma AY, Meskers CG, Ling CH, Narici M, Kurrle SE, Cameron ID, et al. Defining sarcopenia: the impact of different diagnostic criteria on the prevalence of sarcopenia in a large middle aged cohort. Age (Dordr). 2013; 35(3):871–881. PMID: 22314402.
3. Ryan AS, Ivey FM, Serra MC, Hartstein J, Hafer-Macko CE. Sarcopenia and physical function in middle-aged and older stroke survivors. Arch Phys Med Rehabil. 2017; 98(3):495–499. PMID: 27530769.
4. Walrand S, Guillet C, Salles J, Cano N, Boirie Y. Physiopathological mechanism of sarcopenia. Clin Geriatr Med. 2011; 27(3):365–385. PMID: 21824553.
5. Meng SJ, Yu LJ. Oxidative stress, molecular inflammation and sarcopenia. Int J Mol Sci. 2010; 11(4):1509–1526. PMID: 20480032.
6. Pereira RA, Cordeiro AC, Avesani CM, Carrero JJ, Lindholm B, Amparo FC, et al. Sarcopenia in chronic kidney disease on conservative therapy: prevalence and association with mortality. Nephrol Dial Transplant. 2015; 30(10):1718–1725. PMID: 25999376.
7. Umegaki H. Sarcopenia and diabetes: hyperglycemia is a risk factor for age-associated muscle mass and functional reduction. J Diabetes Investig. 2015; 6(6):623–624.
8. Cesari M, Kritchevsky SB, Baumgartner RN, Atkinson HH, Penninx BW, Lenchik L, et al. Sarcopenia, obesity, and inflammation--results from the Trial of Angiotensin Converting Enzyme Inhibition and Novel Cardiovascular Risk Factors study. Am J Clin Nutr. 2005; 82(2):428–434. PMID: 16087989.
9. Cruz-Jentoft AJ, Baeyens JP, Bauer JM, Boirie Y, Cederholm T, Landi F, et al. Sarcopenia: European consensus on definition and diagnosis: report of the European Working Group on Sarcopenia in Older People. Age Ageing. 2010; 39(4):412–423. PMID: 20392703.
10. Kim TN, Choi KM. Sarcopenia: definition, epidemiology, and pathophysiology. J Bone Metab. 2013; 20(1):1–10. PMID: 24524049.
11. Gensous N, Bacalini MG, Franceschi C, Meskers CG, Maier AB, Garagnani P. Age-related DNA methylation changes: potential impact on skeletal muscle aging in humans. Front Physiol. 2019; 10:996. PMID: 31427991.
12. Sun G, Gagnon J, Chagnon YC, Pérusse L, Després JP, Leon AS, et al. Association and linkage between an insulin-like growth factor-1 gene polymorphism and fat free mass in the HERITAGE Family Study. Int J Obes. 1999; 23(9):929–935.
13. Huygens W, Thomis MA, Peeters MW, Aerssens J, Janssen R, Vlietinck RF, et al. Linkage of myostatin pathway genes with knee strength in humans. Physiol Genomics. 2004; 17(3):264–270. PMID: 15026560.
14. Windelinckx A, De Mars G, Huygens W, Peeters MW, Vincent B, Wijmenga C, et al. Comprehensive fine mapping of chr12q12-14 and follow-up replication identify activin receptor 1B (ACVR1B) as a muscle strength gene. Eur J Hum Genet. 2011; 19(2):208–215. PMID: 21063444.
15. Hopkinson NS, Nickol AH, Payne J, Hawe E, Man WD, Moxham J, et al. Angiotensin converting enzyme genotype and strength in chronic obstructive pulmonary disease. Am J Respir Crit Care Med. 2004; 170(4):395–399. PMID: 15117739.
16. Wagner H, Thaller S, Dahse R, Sust M. Biomechanical muscle properties and angiotensin-converting enzyme gene polymorphism: a model-based study. Eur J Appl Physiol. 2006; 98(5):507–515. PMID: 17006713.
17. Yoshihara A, Tobina T, Yamaga T, Ayabe M, Yoshitake Y, Kimura Y, et al. Physical function is weakly associated with angiotensin-converting enzyme gene I/D polymorphism in elderly Japanese subjects. Gerontology. 2009; 55(4):387–392. PMID: 19478476.
18. Pescatello LS, Kostek MA, Gordish-Dressman H, Thompson PD, Seip RL, Price TB, et al. ACE ID genotype and the muscle strength and size response to unilateral resistance training. Med Sci Sports Exerc. 2006; 38(6):1074–1081. PMID: 16775548.
19. Rodríguez-Romo G, Ruiz JR, Santiago C, Fiuza-Luces C, González-Freire M, Gómez-Gallego F, et al. Does the ACE I/D polymorphism, alone or in combination with the ACTN3 R577X polymorphism, influence muscle power phenotypes in young, non-athletic adults? Eur J Appl Physiol. 2010; 110(6):1099–1106. PMID: 20734058.
20. Bustamante-Ara N, Santiago C, Verde Z, Yvert T, Gómez-Gallego F, Rodríguez-Romo G, et al. ACE and ACTN3 genes and muscle phenotypes in nonagenarians. Int J Sports Med. 2010; 31(4):221–224. PMID: 20148371.
21. Yang N, MacArthur DG, Gulbin JP, Hahn AG, Beggs AH, Easteal S, et al. ACTN3 genotype is associated with human elite athletic performance. Am J Hum Genet. 2003; 73(3):627–631. PMID: 12879365.
22. Roth SM, Walsh S, Liu D, Metter EJ, Ferrucci L, Hurley BF. The ACTN3 R577X nonsense allele is under-represented in elite-level strength athletes. Eur J Hum Genet. 2008; 16(3):391–394. PMID: 18043716.
23. Geusens P, Vandevyver C, Vanhoof J, Cassiman JJ, Boonen S, Raus J. Quadriceps and grip strength are related to vitamin D receptor genotype in elderly nonobese women. J Bone Miner Res. 1997; 12(12):2082–2088. PMID: 9421241.
24. Wang P, Ma LH, Wang HY, Zhang W, Tian Q, Cao DN, et al. Association between polymorphisms of vitamin D receptor gene ApaI, BsmI and TaqI and muscular strength in young Chinese women. Int J Sports Med. 2006; 27(3):182–186. PMID: 16541372.
25. Bahat G, Saka B, Erten N, Ozbek U, Coskunpinar E, Yildiz S, et al. BsmI polymorphism in the vitamin D receptor gene is associated with leg extensor muscle strength in elderly men. Aging Clin Exp Res. 2010; 22(3):198–205. PMID: 20634643.
26. Ran S, He X, Jiang ZX, Liu Y, Zhang YX, Zhang L, et al. Whole-exome sequencing and genome-wide association studies identify novel sarcopenia risk genes in Han Chinese. Mol Genet Genomic Med. 2020; 8(8):e1267. PMID: 32478482.
27. Singh AN, Gasman B. Disentangling the genetics of sarcopenia: prioritization of NUDT3 and KLF5 as genes for lean mass & HLA-DQB1-AS1 for hand grip strength with the associated enhancing SNPs & a scoring system. BMC Med Genet. 2020; 21(1):40. PMID: 32093658.
28. Wannamethee SG, Atkins JL. Muscle loss and obesity: the health implications of sarcopenia and sarcopenic obesity. Proc Nutr Soc. 2015; 74(4):405–412. PMID: 25913270.
29. Nagano A, Wakabayashi H, Maeda K, Kokura Y, Miyazaki S, Mori T, et al. Respiratory sarcopenia and sarcopenic respiratory disability: concepts, diagnosis, and treatment. J Nutr Health Aging. 2021; 25(4):507–515. PMID: 33786569.
30. Benz IG, Trajanoska K, Schoufour J, Lahousse L, Roos ED, Terzikhan N, et al. Sarcopenia in elderly population with chronic respiratory diseases: a population-based study. Eur Respir J. 2018; 52(Suppl 62):PA1174.
31. Narici MV, Maffulli N. Sarcopenia: characteristics, mechanisms and functional significance. Br Med Bull. 2010; 95(1):139–159. PMID: 20200012.
32. Larsson L, Degens H, Li M, Salviati L, Lee YI, Thompson W, et al. Sarcopenia: aging-related loss of muscle mass and function. Physiol Rev. 2019; 99(1):427–511. PMID: 30427277.
33. Shorter E, Sannicandro AJ, Poulet B, Goljanek-Whysall K. Skeletal muscle wasting and its relationship with osteoarthritis: a mini-review of mechanisms and current interventions. Curr Rheumatol Rep. 2019; 21(8):40. PMID: 31203463.
34. Tanaga K, Bujo H, Zhu Y, Kanaki T, Hirayama S, Takahashi K, et al. LRP1B attenuates the migration of smooth muscle cells by reducing membrane localization of urokinase and PDGF receptors. Arterioscler Thromb Vasc Biol. 2004; 24(8):1422–1428. PMID: 15166012.
35. Ahlers-Dannen KE, Yang J, Spicer MM, Maity B, Stewart A, Koland JG, et al. Protein profiling of RGS6, a pleiotropic gene implicated in numerous neuropsychiatric disorders, reveals multi-isoformic expression and a novel brain-specific isoform. eNeuro. 2022; 9(1):ENEURO.0379-21.2021.
36. Simons JP, Al-Shawi R, Minogue S, Waugh MG, Wiedemann C, Evangelou S, et al. Loss of phosphatidylinositol 4-kinase 2α activity causes late onset degeneration of spinal cord axons. Proc Natl Acad Sci U S A. 2009; 106(28):11535–11539. PMID: 19581584.
37. Deschenes MR, Roby MA, Eason MK, Harris MB. Remodeling of the neuromuscular junction precedes sarcopenia related alterations in myofibers. Exp Gerontol. 2010; 45(5):389–393. PMID: 20226849.
38. Tamaki T, Hirata M, Uchiyama Y. Qualitative alteration of peripheral motor system begins prior to appearance of typical sarcopenia syndrome in middle-aged rats. Front Aging Neurosci. 2014; 6:296. PMID: 25400579.
39. Tintignac LA, Brenner HR, Rüegg MA. Mechanisms regulating neuromuscular junction development and function and causes of muscle wasting. Physiol Rev. 2015; 95(3):809–852. PMID: 26109340.
40. Qiu J. A new role for spastin. Nat Rev Neurosci. 2004; 5(9):673.
41. Andrews HK, Zhang YQ, Trotta N, Broadie K. Drosophila sec10 is required for hormone secretion but not general exocytosis or neurotransmission. Traffic. 2002; 3(12):906–921. PMID: 12453153.
42. Vemu A, Szczesna E, Zehr EA, Spector JO, Grigorieff N, Deaconescu AM, et al. Severing enzymes amplify microtubule arrays through lattice GTP-tubulin incorporation. Science. 2018; 361(6404):eaau1504. PMID: 30139843.
43. Kuo YW, Trottier O, Mahamdeh M, Howard J. Spastin is a dual-function enzyme that severs microtubules and promotes their regrowth to increase the number and mass of microtubules. Proc Natl Acad Sci U S A. 2019; 116(12):5533–5541. PMID: 30837315.
44. Park SH, Zhu PP, Parker RL, Blackstone C. Hereditary spastic paraplegia proteins REEP1, spastin, and atlastin-1 coordinate microtubule interactions with the tubular ER network. J Clin Invest. 2010; 120(4):1097–1110. PMID: 20200447.
45. Errico A, Ballabio A, Rugarli EI. Spastin, the protein mutated in autosomal dominant hereditary spastic paraplegia, is involved in microtubule dynamics. Hum Mol Genet. 2002; 11(2):153–163. PMID: 11809724.
46. Sanderson CM, Connell JW, Edwards TL, Bright NA, Duley S, Thompson A, et al. Spastin and atlastin, two proteins mutated in autosomal-dominant hereditary spastic paraplegia, are binding partners. Hum Mol Genet. 2006; 15(2):307–318. PMID: 16339213.
47. Mannan AU, Krawen P, Sauter SM, Boehm J, Chronowska A, Paulus W, et al. ZFYVE27 (SPG33), a novel spastin-binding protein, is mutated in hereditary spastic paraplegia. Am J Hum Genet. 2006; 79(2):351–357. PMID: 16826525.
48. Stenmark H, Aasland R, Driscoll PC. The phosphatidylinositol 3-phosphate-binding FYVE finger. FEBS Lett. 2002; 513(1):77–84. PMID: 11911884.
49. Stenmark H, Aasland R. FYVE-finger proteins--effectors of an inositol lipid. J Cell Sci. 1999; 112(Pt 23):4175–4183. PMID: 10564636.
50. Jung Y, Huang JZ, Hu J. Biomarker detection in association studies: modeling SNPs simultaneously via logistic ANOVA. J Am Stat Assoc. 2014; 109(508):1355–1367. PMID: 25642005.

SUPPLEMENTARY MATERIALS

Supplementary Table 1

Results for all demographics study
jkms-37-e346-s001.doc

Supplementary Table 2

All SNPs results of GWAS data
jkms-37-e346-s002.doc

Supplementary Table 3

All results of eQTL analysis in GTEx
jkms-37-e346-s003.doc
TOOLS
Similar articles