

 PDF
PDF Citation
 Print
Print


Fluid therapy is commonly performed for hospital-admitted patients. In pediatric patients, patients in shock state, and with kidney diseases, it is important to inject the correct amount of fluid.123 Insufficient amounts of fluids can cause hypovolemia, which can lead to tissue hypo-perfusion and organ dysfunction. Conversely, hypervolemia due to fluid overload can cause poor patient prognosis such as pulmonary edema, intestinal obstruction, and electrolyte imbalance. Therefore, clinicians spend a lot of effort in learning how to determine the amount of fluid needed for patients.4
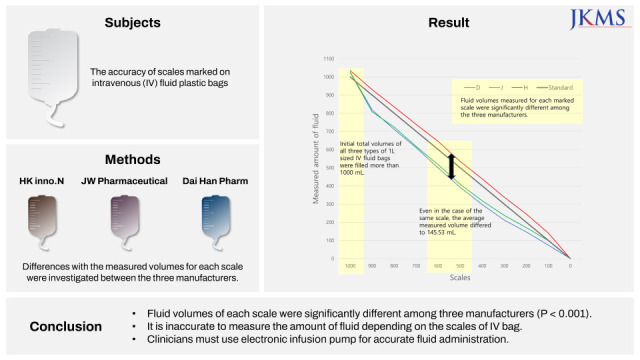
However, ensuring that fluids are being injected exactly as intended is often overlooked. It has been reported that in clinical situations, fluids are usually not infused at the exact flow rate prescribed by clinicians.5 Actually, electronic infusion pumps are often insufficient and cumbersome to use. Thus, health providers often check the infusion volume in a simple way by tracking fluid levels marked on intravenous (IV) fluid bags or marked with tape strips.6 However, a previous study has revealed that the total amount of 1 L fluid is not exactly 1 L; an average of 51 mL extra fluid was contained in 1 L fluid plastic bags.7 Furthermore, whether measuring the amount of fluid injected depending on scales marked on IV fluid bags is a reliable method remains unclear.
Therefore, we investigated whether scales marked on 1 L IV fluid plastic bags produced by domestic manufacturers matched with actual volume and how much difference existed among manufacturers. Results of this study suggested that the accuracy of marked scales must be ensured so that they can be used with confidence.
Total 30 IV fluid plastic bags made by three manufacturers were used in this experiment. Selected manufacturers were HK inno.N (Eumseong, Korea), JW Pharmaceutical (Dangjin, Korea), and Dai Han Pharm (Ansan, Korea). Ten 1L sized fluid bags were prepared for each manufacturer, and labeled as H, J, or D, respectively. Since there was no identical type of fluid produced by all three manufacturers, three different crystalloids (Hartmann-D Solution, 0.9% normal saline, and 5% glucose injection, respectively) were used. As a result of inquiries through an official letter, 1 L IV fluid plastic bags of each manufacturer were produced in the same size and shape with the same materials regardless of the type of crystalloids.
Fluid volumes were indirectly measured based on their weights. The weight of each fluid was gauged with the same electronic scale (SW-1 Series; CAS Corporation, East Rutherford, NJ, USA). Conversion of weight into volume was calculated by the relative density. Relative density (g/mL) was calculated by dividing the weight (g) of 50 mL fluid at 20°C, 1,023 hPa, which of H, J, and D were 1.0060, 0.9948, and 0.9972 g/mL, respectively.
The total amount of fluid contained in the 1 L sized IV fluid bag and the actual volume of 9 scales (900, 800, 700, 600, 500, 400, 300, 200 and 100 mL) were checked. A 1 L-sized IV fluid bag was hung on a pole and fluid except air was taken out using a syringe to match the marked scale on the bag with the air-fluid level. When the fluid bags were moved and weighed, they were carefully handled. The weight was measured three times. Measuring was all done by the same researcher in a random sequence with a standardized method of reading.8 The air-fluid border was not tilted and viewed from the eye level. The lowest point of air-fluid border was matched with the marked scale indicating the remaining volume.
Actual measured volumes of fluids were calculated as mean ± standard deviation (SD). To compare between marked scales and measured volumes, non-parametric Mann-Whitney U test of variance was performed using IBM® SPSS® Statistics version 25 (IBM Corp., Armonk, NY, USA). The statistical difference of volumes between three manufacturers was analyzed by Kruskal–Wallis one-way analysis of variance. Post-hoc Dunn’s test was done via multiple comparison method.
Table 1 shows the mean and SD of calculated volumes of crystalloids of three manufacturers and those of each marked scale. Initial total volumes of the three fluids were filled more than 1,000 mL (Table 1). With the exception of 1,000 mL, measured volumes of fluid bags made by J and D were less than all scales, while measured volumes of H were more than scales. In summary, J and D usually underfilled fluid bags, whereas H always overfilled.
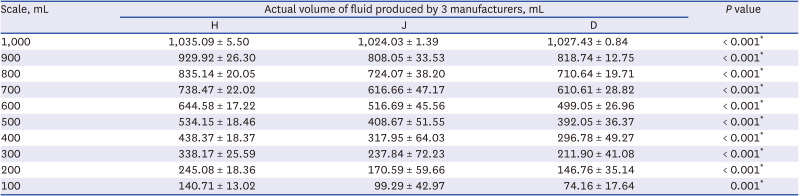
Table 1
Measured fluid volume of each scale
Technical statistics (mean ± standard deviation) of fluid volumes measured when the air-fluid border coincides with each scale calculated by weight and relative density. Because the 1,000 mL scale was not marked on 1 L fluid bag, the initial total amount of 1 L fluid was indicated as 1,000 mL. Statistical difference of measured volumes among the three manufacturers were determined by performing Kruskal–Wallis one-way analysis.
H = fluid produced by HK inno.N, J = fluid produced by JW Pharmaceutical, D = fluid produced by Dai Han Pharm.
*P < 0.05 compared among three types of fluid.
![]()
For J and D, the maximal difference between the marked scale and the measured volume was approximately 200 mL. For H, the maximal difference was about 70 mL. The mean difference was the smallest in H, whereas the largest was in D (37.97 vs. 71.19 mL), meaning that scales marked on bags produced by H had the highest accuracy. Actual measured volumes of fluids at all scales showed significant differences among the three manufacturers (P < 0.001) and the average measured volume differed from 3.40 to 145.53 mL (Table 1, Fig. 1).
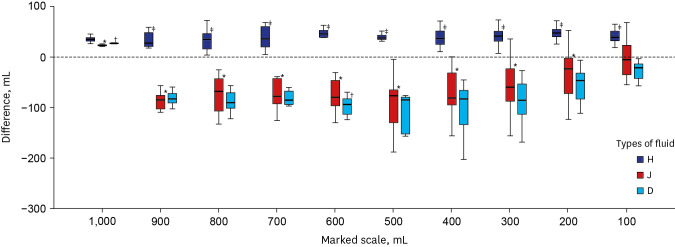 | Fig. 1Differences between measured volume and marked scale for each scale. Difference values (y-axis) were obtained by subtracting the marked scale from the measured volume. The initial total amount of 1 L fluid was indicated as 1,000 mL because the 1,000 mL scale was not marked on 1 L fluid bag.H = fluid produced by HK inno.N, J = fluid produced by JW Pharmaceutical, D = fluid produced by Dai Han Pharm.
*P < 0.05 compared between H and J; †P < 0.05 compared between J and D; ‡P < 0.05 compared between D and H.
|
This study confirmed that measuring the amount of fluid according to scales marked on IV fluid plastic bags was inaccurate as the difference between the scale and the actual volume could be up to 200 mL.
In general, the flow rate of fluid is controlled by simple regulation clamps or by calculating the number of drops falling per reference time. The most widely used method is using an intravenous infusion flow regulator.9 However, it has been reported that it is not reasonable to control the accurate flow rate in all these methods.1011 On the other hand, in order to confirm whether the fluid is injected at an accurate flow rate, a method of checking the air-fluid level inside the plastic bag is generally used. As our findings show, checking marked scales to ensure that correct amount of fluid has been administered cannot guarantee accuracy.
The medicine mixed with the fluid must be injected at the correct rate and volume. Previous research results have indicated that 1 L-sized fluid contains more than 1 L.7 If so, expected and actual concentrations of medicine mixed in fluid would differ. In neonates, reducing the variability of flow rate is important because a change in the infusion rate of a drug can affect total infusion amount and concentration of the drug.12 Elderly and severe shock patients also need to be controlled.13 Thus, it is better to use electronic infusion pump devices to precisely adjust the infusion rate.514
Results of this study confirmed that the volume of air contained in the bag had an important role in evaluating the coincidence between the scale and the amount of fluid. When producing fluid in factories, some amount of air is injected along with 1,000 mL of fluid. The amount of air injected varies from company to company. Officially, manufacturer H adjusted the largest amount of air contained in the plastic bag to be 65–100 mL and J adjusted it to be 15–17 mL. D does not control the quantity of air volume. Since H had the highest concordance between the air-fluid level and calculated volume, it will be helpful to study whether higher amount of air could lead to higher accuracy of the fluid scale.
Our study had some limitations. First, since IV fluid plastic bags cannot be covered to check the level of fluid, this experiment was not double-blinded. However, this limitation could be slightly offset because 30 bags were measured in random order as mentioned in the Method. Second, three manufacturers did not produce the same type of crystalloid. Thus, we tested three types of crystalloids. Since all fluids were crystalloids with similar viscosity and since the volume of fluid was compensated with density, there was no measurement bias depending on fluid type. Also, our research was limited to fluids produced in South Korea.
In conclusion, results of this study confirmed that commercially available 1 L crystalloids had discrepancy in the indicated scale and actual fluid amount and that such discrepancy was different for each product. Therefore, it is unavoidably inaccurate to evaluate the infusion amount with the scales marked on fluid bags. In order to overcome this inaccuracy, manufacturers must strive to match the actual volume to the marked scale. The air volume in the fluid bag is related to the accuracy of the fluid volume check, so air volume control should also be considered. Finally, for high-qualitative fluid management in clinical situations, it is recommended to use validated instruments such as electronic infusion devices.
 XML Download