

 PDF
PDF Citation
 Print
Print


INTRODUCTION
Hypertension is a major risk factor for development of cardio-cerebrovascular diseases such as stroke and ischemic heart disease,1 and high systolic blood pressure (SBP) substantially contributes to the global burden of disease and mortality.2 As reported in a recent study examining the prevalence and treatment of hypertension in 200 countries, the number of hypertensive patients doubled over the past 30 years from 1990 to 2019.3 In South Korea, due to aging of the population, the number of people with hypertension has shown a steady increase to over 11 million.4 In the United States, insignificant change was observed in the prevalence of hypertension from 1999 to 2016, while the control rate increased from 1999 to 2010 and remained unchanged until 2016.5
The prevalence of hypertension is continuously increasing in most countries, and lifestyle plays a critical role in this trend.6 Modifiable risk factors such as sedentary lifestyle, drinking, and smoking are important in the prevention and management of hypertension.7 In addition, both short and long sleep duration showed an association with increased risk of hypertension.89 Physical activity (PA) and smoking cessation were associated with better prognosis among patients with resistant hypertension.10 Making lifestyle changes to lower blood pressure, such as eating habits and exercise is less likely for people practicing unhealthy lifestyle habits.11 A previous study on cancer survivors reported that individuals with a longer duration of illness tended to quit smoking and increase PA compared to those with a shorter duration of illness.12
Considering that maintenance of a healthy lifestyle is crucial in the prevention, management, and prognosis of hypertension, adopting a healthy lifestyle is important for individuals with hypertension. The aim of this study was to compare ecological and lifestyle factors between hypertensive and normal individuals, and to examine the prevalence of lifestyle characteristics according to the duration of hypertension among individuals with hypertension. This study will provide baseline findings that are relevant in the development of lifestyle interventions for management and better prognosis in hypertensive patients.
Go to : 
METHODS
Data collection and participants
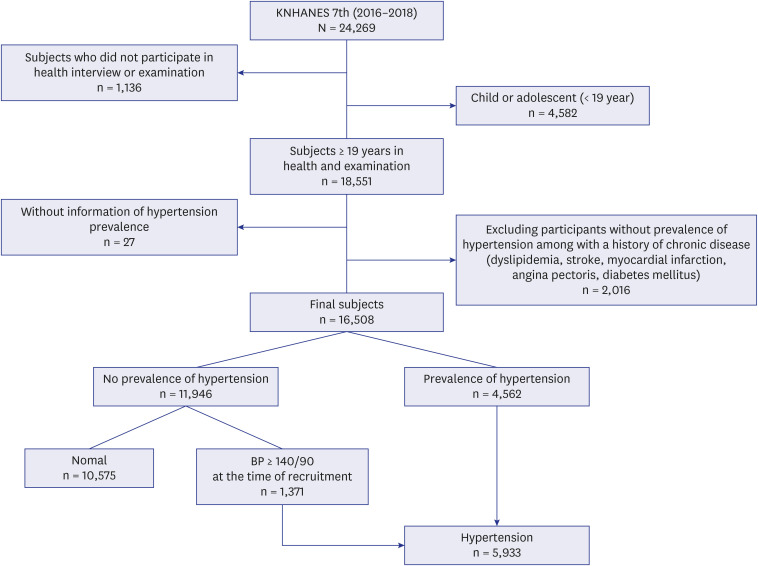
This study used data from the 2016–2018 Korea National Health and Nutrition Examination Survey (KNHANES VII) conducted by the Korea Center for Disease Control and Prevention. The target population of KNHANES comprises non-institutionalized Korean citizens residing in Korea. The sampling plan follows a multi-stage clustered probability design. Among 24,269 respondents who participated in the 2016–2018 KNHANES, 4,582 individuals aged 20 years and below, and 1,136 individuals who did not participate in the health interview and health examination survey were excluded leaving 18,551 adults. Individuals aged younger than 20 years were excluded because they were not interviewed for prevalent hypertension. Furthermore, 27 participants who declined to respond to questions regarding hypertension; and 2,016 participants with no history of hypertension but with previous history of other illness such as hyperlipidemia, stroke, myocardial infarction, angina pectoris, or diabetes were excluded yielding a final analytical sample of 16,508 participants. The final sample comprised 5,933 participants who were classified as the hypertension group: including 4,562 who received a diagnosis of hypertension, and 1,371 participants with SBP ≥ 140 mmHg or diastolic blood pressure (DBP) ≥ 90 mmHg at the time of recruitment. In addition, 10,575 were classified in the normal group (Fig. 1).
Outcome variable
The outcome variables were lifestyle behaviors: smoking status, drinking status, PA, and sleep duration. Smoking status was ascertained by asking the following questions: “How many cigarettes have you smoked in your entire life?” and “Do you currently smoke cigarettes?”. Participants were then classified as non-smokers or current smokers. ‘Non-smokers’ were those who never smoked or those who smoked before but currently not smoking while ‘current smokers’ were those who reported smoking daily or occasionally.
Drinking status was evaluated by asking participants whether they had ever taken alcohol and how often they drank alcohol in the previous year. Participants who never drank or had not had a drink in the previous year were categorized as ‘non-drinkers’; and those who ever drank alcohol and had drank in the previous year were classified as ‘current drinker.’
PA was assessed using the WHO Global Physical Activity Questionnaire (GPAQ)13 and PA was evaluated based on the metabolic equivalent of task (METS). The METS was calculated for each of the three PA domains: work-, transportation-, and recreation-related activities according to the GPAQ analysis guidelines. The METS for each domain were summed to compute total PA (MET-min/week) which was used to classify participants into ‘low PA,’ ‘moderate PA,’ and ‘high PA’ groups.13
Moderate PA was defined as: 1) vigorous PA for at least 20 minutes per day at least three days a week or 2) moderate PA for at least 30 minutes per day at least five days a week or 3) moderate or high intensity activity or combination of transportation 600 MET/week. High PA was defined as: 1) achieving at least 1,500 MET/week through vigorous PA at least three days a week or 2) achieving at least 3,000 MET/week in any combination of, moderate or high intensity activities at least seven days per week. Low PA was defined as not engaging in high PA and moderate PA.
The average daily sleep duration was calculated based on two questions: “What time do you usually go to bed and wake up in the morning on weekdays?” and “What is your usual bed-time and wake-up time on weekends?”. Calculation of the average daily sleep duration was calculated using the following formula:
Mean Daily Sleep Duration (hours) = Daily Weekday Sleep Hours × 5 + Daily Weekend Sleep Hours × 2)/7
Based on the average sleep duration, sleep hours were divided into three groups, less than six hours, 6–8 hours, and more than eight hours. The average sleep duration of 6–8 hours was considered adequate.
Exposure variable
The main exposure variable was the duration of hypertension. Hypertension was defined as having been diagnosed with hypertension by a physician or self-reported hypertension or currently taking any medication for blood pressure control or SBP ≥ 140 mmHg or DBP ≥ 90 mmHg at the time of participant recruitment. The duration of hypertension was computed as the difference between age at diagnosis of hypertension and age at recruitment.
Sociodemographic and health-related characteristics
Participant characteristics were age (divided into 10-year age groups); marital status (married, or unmarried including widowed, divorced, or separated status); educational level (≤ 6, 7–9, 10–12, and ≥ 13 years); income level (low, lower-middle, upper-middle, and high) based on the distribution of the average monthly household income by quartiles; occupation was classified into three groups: white collar, blue collar, and others. ‘White collar’ comprised professional, managerial, or administrative, desk work; ‘blue-collar’ comprised manual labor including service and sales, agriculture, forestry and fishing, craft, plant and machine operation and assembly and simple labor, and ‘others’ included the unemployed and housewives. Residential areas were categorized as urban areas including Seoul and five major Korean metropolitan cities and rural areas including the “eup” and “myeon” districts. The types of health insurance included the employee insured and self-employed insured, and medical aid from government. The health-related factors were body mass index (BMI), family history of hypertension (yes/no), subjective health status (good, fair and bad), Charlson Comorbidity Index (CCI), and antihypertension medication status (yes/no). BMI (kg/m2) was defined as weight in kg divided by squared height in meters. Participants with a family history of hypertension were those who reported having a parent, brother or sister who had ever been diagnosed with hypertension. The CCI scores were computed as described by Gang and colleagues14 and were divided into ‘0,’ ‘1,’ ‘≥ 2.’
A categorical variable was given according to its mode and a continuous variable according to the mean value for each variable with a missing rate of 5% or less. The CCI values of 2, 3, 4, and 5 points with frequency less than 5% were divided according to the sum of 2–5 points.
Statistical analysis
The sampling weights, strata and cluster components were applied in the analysis to account for the complex survey design of the KNHANES15 and to obtain sample estimates that are representative of the South Korean population. Descriptive statistics were calculated using χ2 test for categorical variables and independent t-test continuous variables. Adjusted odds ratios (ORs) and 95% confidence interval (CI) for the prevalence of lifestyle behaviors were estimated using logistic regression models. Multivariable logistic regression was performed to identify variables related to the outcome and statistically significant variables were modelled as confounders. Logistic regression was used to examine the prevalence of current smoking and drinking according to quartiles of the duration of hypertension after adjusting for all confounding variables. In addition, the prevalence of moderate or high PA and sleep duration according to the duration of hypertension was estimated using adjusted multinomial logistic regression.
The duration of hypertension was modeled as a categorical variable (quartiles of the years lived with hypertension) and as a continuous variable (years lived with hypertension divided by the interquartile range [IQR] of years lived with hypertension [12-year]). For the former, < 1 year was used as the reference category while for the latter, a value of 0 was assigned to normal individuals and was used as the reference category and the ORs represented the risk of lifestyle behaviors per IQR (12-year) increment in the years lived with hypertension. First, the analyses were performed in both normal individuals and individuals with hypertension, and was subsequently restricted to individuals with hypertension. All models were adjusted for age (10-year categories), marital status, education year, household income, occupation, residential area, health insurance, BMI (continuous), family history of hypertension (yes, no), subjective health status (good, fair, bad), CCI (0, 1, ≥ 2 points), and antihypertension medication status (yes, no). SAS software, version 9.4 (SAS Institute Inc., Cary, NC, USA) was used for all statistical analyses and P values < 0.05 were considered statistically significant.
Ethics statement
This study was approved by the Institutional Review Board (IRB) of Kangwon National University Hospital (IRB No. KNUH-2021-12-018). This study was conducted according to the guidelines of the Declaration of Helsinki.
Go to :
RESULTS
The characteristics of participants according to smoking and drinking is shown in Table 1. Current smokers were more likely to be men, employed, on medical aids and report worse subject health. However, they were less educated, young, and had a low comorbidity index. BMI was inversely related to smoking (Table 1). Current drinkers were more likely to be men, more educated, have high income, and employed. In addition, current drinking was less frequent among the old, rural residents and those with a high CCI score.
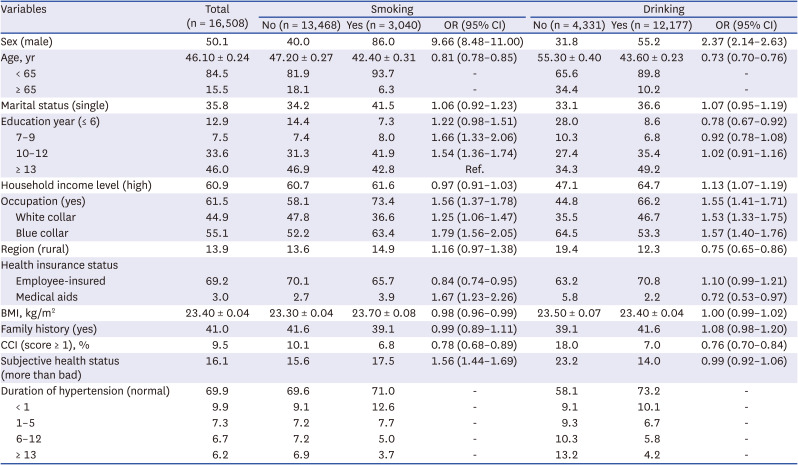
Table 1
General characteristics of the study participants in smoking and drinking
Values are percentage or mean ± standard error.
Base groups: Smoking (no), Drinking (no).
Education year: ≤ 6, 7–9, 10–12, ≥ 13 (ref.); Household income level: Low (ref.), Lower middle, Upper middle, High (Low + Lower middle = Low, Upper middle + High = High); Occupation: No (ref.), Yes, White collar, Blue collar; Region: Urban (ref.), Rural; Health insurance status: Self-employed (ref.), Employee-insured, Medical aids; CCI: 0 (ref.), 1, 2–5; Subjective health status: Good (ref.), Normal, Bad.
OR = odds ratio, CI = confidence interval, BMI = body mass index, CCI = Charlson Comorbidity Index.
![]()
Table 2 shows the distribution of participant characteristics according to PA and sleep duration. The male, single, participants with higher income, the employed, employee insured, and those with a high BMI were more likely to engage in moderate or high physical exercise (Table 2). However, active participants were young, urban residents, and reported good subjective health. Regarding sleeping duration, men, and the highly educated were less likely to sleep for < 6 hours or > 8 hours compared to 6–8 hours a day, but old age, being single, high household income, employee-insurance enrollment, high BMI and having a family history of hypertension were inversely related to sleeping for > 8 hours per day. However, the employed, and those with high BMI were more likely to sleep for < 6 hours a day. Moreover, rural dwellers were more likely to sleep for > 8 hours a day.
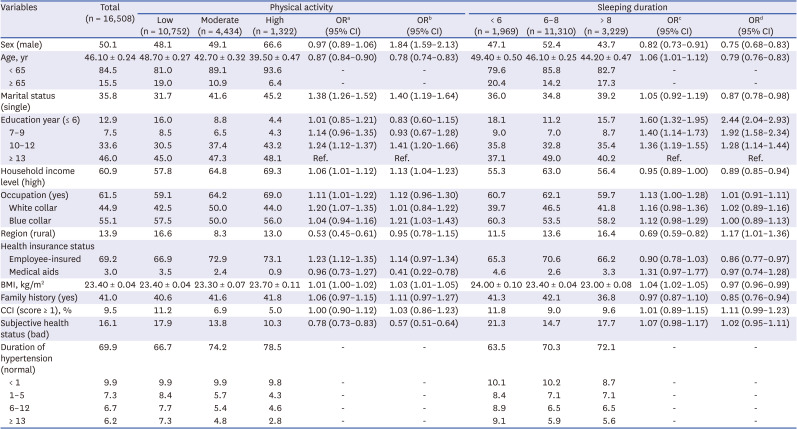
Table 2
General characteristics of the study participants in physical activity and sleeping duration
Values are percentage or mean ± standard error.
Education year: ≤ 6, 7–9, 10–12, ≥ 13 (ref.); Household income level: Low (ref.), Lower middle, Upper middle, High (Low + Lower middle = Low, Upper middle + High = High); Occupation: No (ref.), Yes, White collar, Blue collar; Region: Urban (ref.), Rural; Health insurance status: Self-employed (ref.), Employee-insured, Medical aids; CCI: 0 (ref.), 1, 2–5; Subjective health status: Good (ref.), Normal, Bad.
OR = odds ratio, CI = confidence interval, BMI = body mass index, CCI = Charlson Comorbidity Index.
aLow vs. Moderate; bLow vs. High; c< 6. vs. 6–8; d> 8. vs. 6–8.
![]()
The results of the association between lifestyle behaviors and the duration of hypertension shown in Table 3. Compared to normal individuals, an increasing duration of hypertension significantly decreased the odds of smoking in men (OR, 0.81; 95% CI, 0.68–0.98). In addition, compared to normal individuals, increased duration of hypertension significantly reduced the odds of drinking in men and women (men: OR, 0.83; 95% CI, 0.70–0.98; women: OR, 0.85; 95% CI, 0.73–0.98).
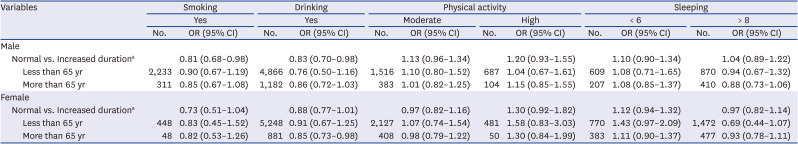
Table 3
ORs of lifestyle variables according to duration of hypertension stratified by sex and age
Values are number (interquartile range).
Adjusted for age, marital status, education, household income, occupation, region, health insurance status, body mass index, Charlson Comorbidity Index, family history, subjective health status, medication status.
OR = odds ratio, CI = confidence interval.
aNormal: assigned value of 0 and used as the reference category; Increased duration: represented the risk of lifestyle behaviors per interquartile range (12-year) increment in lived with hypertension.
![]()
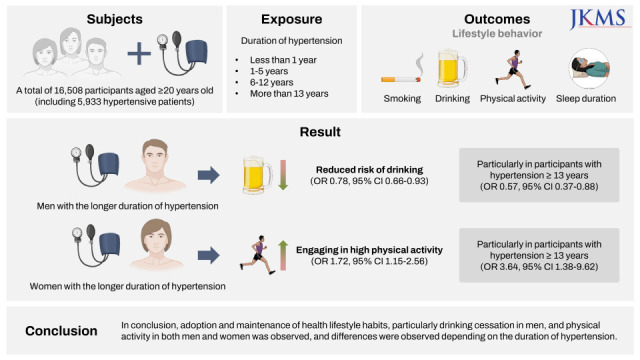
The results of the association between lifestyle behaviors and the duration of hypertension among patients diagnosed with hypertension are shown in Table 4. The increase in the duration of hypertension was associated with lower odds of drinking in men (OR, 0.78; 95% CI, 0.66–0.93), and this observation remained when men with hypertension for ≥ 13 years were compared to those with hypertension for < 1 year (OR, 0.57; 95% CI, 0.37–0.88). On the other hand, increased duration of hypertension increased the odds of engaging in high PA in women (OR, 1.72; 95% CI, 1.15–2.56), particularly in men with hypertension for 6–12 years (OR, 1.66; 95% CI, 1.03–2.69) and women with hypertension for ≥ 13 years (OR, 3.64; 95% CI, 1.38–9.62). Moreover, there was no difference in the odds of sleep duration according to duration of hypertension (Table 4).
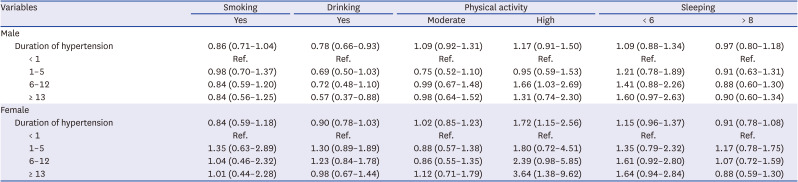
Table 4
Odds ratios of lifestyle characteristics according to the duration of hypertension among participants with hypertension
Adjusted for age, marital status, education, household income, occupation, region, health insurance status, body mass index, Charlson Comorbidity Index, family history, subjective health status, medication status.
![]()
Go to :
DISCUSSION
This study was conducted to determine the relationship between the diagnosis and duration with hypertension, and lifestyle behaviors using data from the KNHANES. Significant differences were observed in the distribution of age, education level, occupation, family history of hypertension, CCI, region of residence, and subjective health according to smoking, drinking, PA, and sleep duration. When individuals with hypertension were compared to normal individuals, the relationship between hypertension duration and lifestyle behaviors varied according to gender. The increased duration of hypertension was linked to a decreased risk of current smoking in men, and current drinking in both men and women. When the analysis was restricted to individuals with hypertension, the results showed that the risk of current drinking decreased, particularly in men that suffered from hypertension for ≥ 13 years compared to those with hypertension for < 1 year. Moreover, a high level of PA was observed in both men and women with longer duration of hypertension.
The findings of this study indicate that in men with longer duration of hypertension were less likely to smoke compared to healthy individuals. In a previous study, individuals diagnosed with hypertension were approximately 1.3 times more likely to be ex-smokers compared to those who were undiagnosed.16 A Canadian study reported that a diagnosis of hypertension led to smoking cessation and one in five Canadian adults had quit smoking.17 It appears that hypertensive patients seem to change their lifestyle in accordance to the clinical guidelines for management of hypertension that strongly advise smoking cessation.18 However, in the analysis restricted to hypertensive patients, the duration of hypertension did not influence smoking cessation. In a recent American study, patients diagnosed with hypertension comprised 32.4% of former smokers and 18.5% of current smokers, indicating that former smokers were at a higher proportion compared to current smokers.16 The lack of association in this study indicates that hypertensive patients had quit smoking at the time of diagnosis, and the results of this study support findings from previous studies. In addition, hypertensive patients with longer duration of hypertension are at greater risk of being a former smoker,16 confirming the outcomes of this study. In South Korea, 93.1% of hypertensive patients were receiving antihypertensive treatment.19 According to Neutel and colleagues,17 patients taking antihypertensive medication were more likely to quit smoking (persons not taking antihypertensive drugs: relative risk reduction = 9.5%, persons taking antihypertensive drugs: relative risk reduction = 24.6%). In this study, 78.9% of patients were currently non-smokers (data not shown), in line with previous findings.
In a Nigerian study of hypertensive patients, the majority of patients quit drinking after recognizing the negative effects of hypertension,20 which agrees with our findings, particularly in women. Furthermore, a previous study of Bedfordshire on patients with risk of cardiovascular disease in the UK, there was greater emphasis on caution for alcohol drinking in men compared with women.21 According to a study of data from the Korean Community Health Survey, males taking antihypertensive medications consumed more alcohol than females.22 Men with a longer duration of hypertension were less likely to drink, than those without hypertension. In particular, a reduced risk of drinking was observed from men with hypertension for ≥ 13 years compared to those with hypertension for < 1 year, but not in women. In a US study no difference was found in drinking by duration,15 but in our study a relatively lower risk of drinking was observed only in men who had hypertension for ≥ 13 years.
Findings from a previous study suggested that PA reduced SBP by 5–17 mmHg and DBP by 2–10 mmHg.23 For this reason, the guidelines for control of BP recommend that hypertensive patients participate in PA.2425 Despite these guidelines, according to a study reported by Valderrama et al.,26 of all 24.4% of hypertensive patients who were advised to participate in exercise, only 62.3% followed recommendations. The American College of Sports Medicine recommends that individuals with hypertension engage in exercise at mild-to-moderate levels compared to healthy individuals.27 This study shows that males and females with hypertension comply with PA. Efforts to advise patients with hypertension and cancer to engage in more physical activities have been made by physicians and health professionals.28 In this study, results of comparison of patients diagnosed with hypertension showed that in both men and women with longer duration of hypertension had a high level of PA. Among the subjects of this study, 3% of women were involved in a high level of PA. Because analysis of only 3% of subjects was performed, the OR of high PA was high, however further research is needed.
This study did not reveal a significant difference in the prevalence of sub-optimal sleep duration according to the duration of hypertension. Although decreased sleep duration has been shown to increase the risk of hypertension,2930 guidelines for the prevention and management of hypertension do not include advice on sleep duration.182425 Therefore, the lack of association in this study could be due to the fact that guidelines for hypertensive patients do not include advice on sleep duration.
Some limitations of this study should be noted. First, because of the cross-sectional design, the causal relationship between duration of hypertension and lifestyle behavior change cannot be clarified. Temporal relationships between the duration of hypertension and current lifestyle behaviors can only be inferred. In addition, the lifestyle behaviors were assessed once in this study, which precludes examination of habitual lifestyle patterns. Therefore, the ORs should be interpreted with caution. Secondly, because information regarding duration of hypertension and lifestyle was self-reported, there may be measurement and recall bias. Third, although records on past history of smoking and drinking were available, the subjects were divided into two groups for precise determination of the continuity of smoking and drinking habits after the diagnosis of hypertension. Fourth, diet is also an important factor in the management of hypertension. However, considering the complexity of dietary modification, various elements such as dietary patterns, foods, nutrients and supplements should be considered and analyzed. Thus, dietary modification was not considered in this analysis. Further studies are needed to separately investigate the influence of hypertension diagnosis on dietary modification in the Korean population.
Despite these limitations, this study benefited from several strengths. The study used the KNHANES data, which increases the representation of the general characteristics of Koreans with hypertension. In addition, possible confounding variables that could influence the relationship between lifestyle habits and duration of hypertension were considered in the analysis. The results of this study provided information on the distributions of lifestyle behaviors in hypertensive patients, and highlight the need for continuous monitoring of hypertensive patients.
In conclusion, with increase in the duration since hypertension diagnosis, a low likelihood of smoking was observed in hypertensive men, but a low likelihood of drinking was observed in men and women, comparing hypertensive to normal individuals. Among hypertensive individuals, increased duration with the disease was linked to increased likelihood of being physically active, particularly in men with hypertension for 6–12 years and women with hypertension for 13 years and longer, suggesting that early lifestyle modification is not common in this population. This study provides baseline findings to motivate further research and strategies to encourage early initiation recommended lifestyle modifications in hypertensive individuals.
Go to :
 XML Download