

 PDF
PDF Citation
 Print
Print


2022-0825 Original Article
INTRODUCTION
In line with the increasing popularity of social media during the past decade, various medical journals have attempted novel methods to captivate their audience and promote the contents of their articles. As an extension of such effort, graphical abstracts (GAs), which visually summarize the main content of an article, have recently emerged among various academic journals, effectively sharing their knowledge through a single infographic on social media platforms such as Twitter or Facebook. From 2011 to 2015, an increase of 350% in GA usage had been reported in social science journals, a trend that has been carried out across journals of all disciplines.12 In the field of medicine, GAs were first utilized by Annals of Surgery in 2016. Although GAs are effective in elucidating a complex concept for readers novice to the medical field, they certainly have several drawbacks. Concerns have been raised in some studies that GAs are not effective in disseminating scientific results and may only interfere with the understanding of articles. An analysis targeting GAs of high-quality journals (JAMA, BMJ and NEJM) published in 2018 demonstrated that GAs are not effective in disseminating scientific research.3 On the other hand, in a case-control crossover study conducted by Annals of Surgery in 2016, GAs were associated with higher levels of dissemination.4 Furthermore, even after the acceptance of their papers, authors must spend additional time and cost in producing GAs, despite the inconclusive effect of GAs on disseminating medical research.
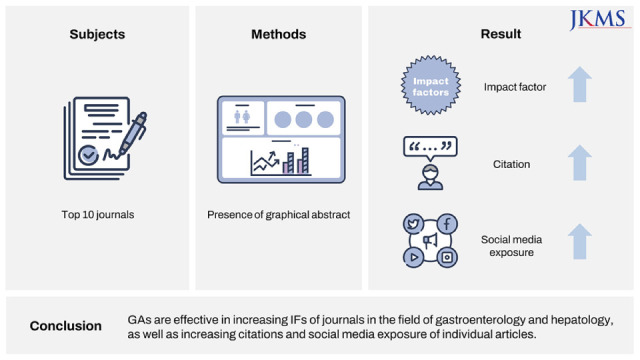
Most of the currently available studies are limited, due to the relatively small number of articles involved in the analyses. Additionally, there has been a lack of representation of various medical specialties, since no study has ever focused on the effect of GAs in the field of internal medicine, especially in gastroenterology & hepatology. Therefore, to analyze the effectiveness of GAs, we investigated the effect of GAs on journals or individual articles in the top ten journals in the field of gastroenterology & hepatology.
METHODS
Study design
This was a retrospective cohort study which included all full-text original articles. Inclusion criteria were as follows: 1) top ten journals consisting of original articles in the field of gastroenterology & hepatology based on the impact factor announced in 2021, and 2) original articles published in these ten journals from January 2019 to December 2021. Out of the ten journals, Nature Reviews Gastroenterology & Hepatology did not consist of original articles, so Endoscopy, which ranked 11th, was included in our analysis. The original article included all prospective and retrospective studies, case-control studies, cohort studies, and randomized control studies. Articles that met any of the following conditions were excluded: 1) review article except systematic review or meta-analysis, 2) editorials, or 3) case report or case series, or 4) research in which Web of Science value cannot be confirmed.
Data collection
First, we confirmed the presence of GA in each journal or individual article through the journal’s website. The collected data were further analyzed by corresponding frequently cited studies on recently issued topics with randomized controlled trials or meta-analyses.
Outcome
In order to assess the level of dissemination, we analyzed the increase of impact factors over three years for journals, and publication citations and social media exposure for individual articles. As the evaluation tools, well-known currently available article-level metrics were used.5 The level of citations was determined by Web of science, PlumX citation index and Dimension recorded citation counts. The degree of social media exposure was evaluated by PlumX social media, Altmetric Attention Score and Altmetric twitter to Altmetric.com. The above indicators were investigated from March 1 to March 30, 2022.
Statistical analysis
Frequencies and percentages were used for descriptive statistics. Significant differences between groups were investigated using the χ2 test for categorical variables and Student’s t-test or Mann-Whitney U test for continuous variables. The change in impact factors in journals were analyzed by the general linear model, and the extent of publication citations and social media exposure in individual articles was analyzed by multiple linear regression model. All the statistical analyses were performed using SPSS software ver. 22.0 (IBM, Armonk, NY, USA). Statistical significance was set at a P value of less than 0.05 (P < 0.05).
RESULTS
Baseline characteristics
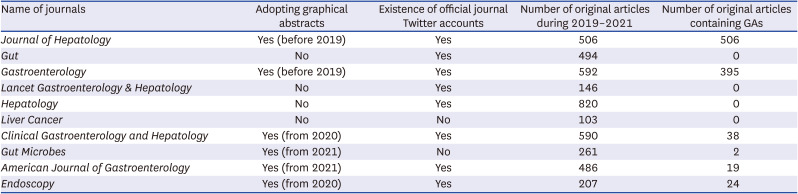
From 2019 to 2021, a total of 4,205 original articles of the top ten journals in the gastroenterology & hepatology category were published (Table 1); five journals (50%) have adopted GAs, while the remaining five journals did not. GAs have been used for three years in the Journal of Hepatology and Gastroenterology, for two years in Clinical Gastroenterology and Hepatology and Endoscopy, and for one year in the American Journal of Gastroenterology. Eight out of ten journals (80%) had an official Twitter account, and two journals did not have a Twitter account. Among the 4,205 articles, 984 (23.4%) contained GAs, while the remaining 3,221 articles (76.6%) did not. Articles with topics and study designs expected to have a relatively high citation level were further categorized: 87 (2.1%) articles were related to coronavirus disease 2019 (COVID-19), 297 (7.1%) were randomized controlled trials (RCTs), and 175 (4.2%) were meta-analyses.
Table 1
Demographics of the top ten journals in the field of gastroenterology and hepatology
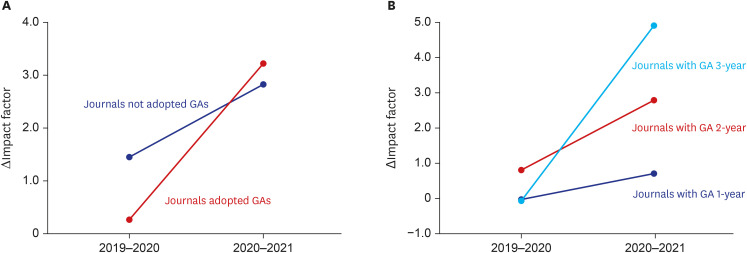
Effect of GAs on journal impact factor
First, we analyzed the effect of GAs on the impact factor of journals. After a comparison of annual changes of the impact factor in each journal, from 2019 to 2020 and from 2020 to 2021, journals that have adopted GAs revealed significant increase in their impact factors (P = 0.014, Fig. 1A). An analysis on the duration of GA incorporation demonstrated that the longer journals have utilized GAs, the higher their impact factors were, despite the lack of statistical significance (P = 0.239, Fig. 1B).
Effect of GAs on individual articles
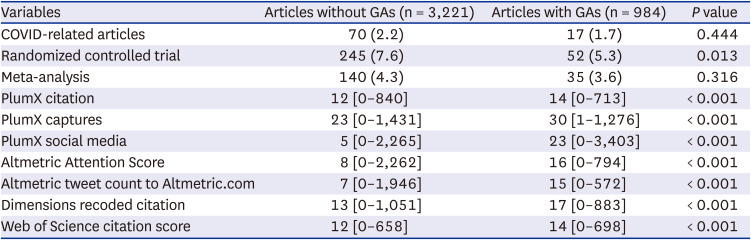
Next, we analyzed the impact of GAs on the extent of citations and social media exposure in individual articles. There was no significant difference between articles with or without GAs in the proportion of COVID-related issues or meta-analysis, thus ensuring no confounding discrepancy in citations or social media exposure (Table 2). Articles with GAs had significantly higher Web of Science citation counts (median 14 vs. 12, P < 0.001), more social media exposure assessed by PlumX (median 23 vs. 5, P < 0.001), and more Altmetric tweet counts to Altmetric.com (median 15 vs. 7, P < 0.001) than those of articles without GAs.
Table 2
Characteristics of articles according to the presence of graphic abstracts
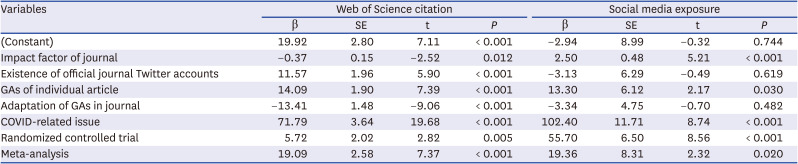
Multiple regression analysis also confirmed the effect of GAs on increasing Web of Science citations and exposure to social media in individual articles (Table 3). The inclusion of GAs was significantly effective in increasing the number of Web of Science citations (β = 14.09, standard error [SE] = 1.90, P < 0.001) and social media exposure (β = 13.30, SE = 6.12, P = 0.030) after adjusting journal impact factors, topics and study designs (COVID-19-related issues, RCTs or meta-analyses).
Table 3
Multiple linear regression analysis affecting citations (Web of Science) and exposure to social media
DISCUSSION
Social media platforms play an important role in clinical practice and research area. To grab the reader’s attention on social media, the use of infographics are increasing. GAs are kind of infographics with the purpose of post-publication promotion of research.67
Ever since GAs were introduced by Annals of Surgery in 2016, GAs have been increasingly highlighted as an essential element in medical journals.4 Though GAs were considered to be effective in increasing journal impact factors or article citations, some reports have suggested controversial results in their effectiveness.89 Previous studies on GAs have been limited, since most studies only focused on Twitter to assess the level of social media exposure, despite various social media platforms available including Instagram and Facebook.2810 Moreover, the results of previous studies were based on only one or two journals.411 In the present study based on the top ten journals in the fields of gastroenterology, we found that GAs are effective in increasing the impact factor of journals and the citations of individual articles. To the best of our knowledge, this study is the first to demonstrate the effectiveness of GAs in both journals and individual articles. In particular, we assumed before our analysis that the importance of GAs would not be as high in gastroenterology as in general surgery, but our assumption was wrong. Although countless other factors besides GAs affect the impact factor, it is expected to play a more significant role in the future, as more and more medical journals start to adopt GAs.1213
First, in our study, GAs are expected to bring positive effect on increasing impact factors, especially with prolonged duration of GA usage. Despite the adoption of GA formats in about half of gastroenterology journals, GAs have only been applied to parts of an article, not the entire journal. Though the effect of GAs on journals is not as significant as that on individual articles, its positive correlation with the duration of GA usage indicates that GAs increase impact factors in the long run. Since the most top-tier journals, such as the New England Journal of Medicine, the Lancet and the Journal of the American Medical Association, have adopted GAs, there is a high possibility that such trend will spread throughout other medical journals.
Currently, there are only five publications available that analyze the effect of GAs on individual articles. Out of the five studies, three demonstrated that GAs had no significant effect on increasing citations and Twitter dissemination,31114 whereas the other two reported GAs to be effective.415 While the effect of GAs on the level of citation remains inconclusive, the hypothesis for the inability of GAs in increasing citations may be proposed as follows. First, because the subject of a study is more significant than GAs in determining researchers’ choices to select, read and cite an article, GAs may not significantly affect the number of citations. Secondly, it is likely that GAs were only effective at increasing simple re-twitts or clicks directing to journal homepages. Because Gas were first created mainly as sharable contents for social media,4 there is a possibility that most readers were only exposed to GAs, not the actual articles, thus resulting in minor impact on citations in the early days of their creation. Lastly, because GAs are often utilized in articles corresponded by junior staff rather than senior staff with high reputation, manuscripts corresponded by junior staff are less likely to receive citations than those by reputable senior staff.
On the other hand, the effectiveness of GAs in increasing citations, especially in recent years, may be explained by the following reasons. First, as the number of journals and articles that have adopted GAs has increased recently, more readers may have become more familiar with GAs. Since articles of vast interest currently are more likely to contain GAs than they did in the past, they may visually attract readers’ attention and induce more citations.16 Secondly, while GAs had only been shared through Twitter in the past, GAs began to be disseminated on different social media platforms such as Facebook, leading to more exposure and thus, citations.17 Thus, while GAs seemed to be rather ineffective in the past, GAs are more effective in increasing citations for recent studies.
However, there are two future challenges related to GAs. First of all, though GA production requires a deep understanding of the article, ideas of skillful designs and an editorial team, only a few journals have professional teams for GAs. In addition, despite the numerous versions of GAs required for different article types, only a few journals provide a standard format.18 Therefore, left with a just simple format, most authors must endure the time-consuming process of manually producing GAs with repeating results or figures.1 Secondly, journals must provide authors with more accurate information on the audience of GAs. Every component of GAs —from graphic designs to medical jargon —inevitably differs depending on the audience and their purpose of reading, whether they be the general public full of curiosity or fellow researchers searching for an answer. While the public was the primary target audience when GAs were first created for Twitter, a recent study suggested otherwise, reporting that most readers, in fact, are healthcare professionals who mainly use GAs.15 Therefore, it is necessary to clarify the target audience of GAs, in order to better adjust the components of GAs and further increase exposure and citations.
Our study has several limitations. First, various factors other than GAs play a role in increasing exposure and citations, though correcting the individual effect of every confounding variable is nearly impossible.1920 Second, the increase of citations or social media exposure as the outcome may not serve as an appropriate index to evaluate the effect of GAs. Third, in our study, not all journals included in gastroenterology and hepatology, but only the top 10 journals, and only original articles were analyzed. We selected only top 10 journals for the following two reasons. First of all, it takes a lot of time for data collection, so if we study all journals, the reliability of metrics values may decrease. Theoretically, it would be best to check all metrics in one day, but there was no way to check a large number of articles at once. For data collection, there was only one way to manually check the metrics of individual articles on websites such as Web of Science. In our study, it took about 1 month to search articles in 10 journals. If the number of target journals increases beyond this, the metrics are likely to change in the case of articles searched at the beginning. For the further development of studies with a similar purpose to ours, we think it is necessary in the long term to develop a tool that can investigate the metrics of thousands of papers at once. Second, journals outside the top 10 often did not adopt a GA policy, limiting the view of the impact of GA. About the review article, review articles often do not include GA in most journals, and the review article itself tends to have higher citations compared to the original article. Therefore, it was difficult to determine the exact effect of GA in the review article, so it was excluded from this study.
In conclusion, GAs are effective in increasing the impact factor in Gastroenterology & Hepatology category journals, as well as increasing citations and social media exposure of individual articles. Therefore, authors are advised in general to incorporate GAs when publishing articles in medical journals. Since GA production requires time-consuming efforts and financial expense from authors and editors, we recommend that authors decide on the usage of GAs based on the characteristics of their study designs and articles, rather than blindly following the trend of incorporating GAs.
 XML Download