Abstract
Background
Early recognition of deterioration events is crucial to improve clinical outcomes. For this purpose, we developed a deep-learning-based pediatric early-warning system (pDEWS) and aimed to validate its clinical performance.
Methods
This is a retrospective multicenter cohort study including five tertiary-care academic children’s hospitals. All pediatric patients younger than 19 years admitted to the general ward from January 2019 to December 2019 were included. Using patient electronic medical records, we evaluated the clinical performance of the pDEWS for identifying deterioration events defined as in-hospital cardiac arrest (IHCA) and unexpected general ward-to-pediatric intensive care unit transfer (UIT) within 24 hours before event occurrence. We also compared pDEWS performance to those of the modified pediatric early-warning score (PEWS) and prediction models using logistic regression (LR) and random forest (RF).
Results
The study population consisted of 28,758 patients with 34 cases of IHCA and 291 cases of UIT. pDEWS showed better performance for predicting deterioration events with a larger area under the receiver operating characteristic curve, fewer false alarms, a lower mean alarm count per day, and a smaller number of cases needed to examine than the modified PEWS, LR, or RF models regardless of site, event occurrence time, age group, or sex.
Many healthcare centers worldwide continue to develop and introduce various early-warning scoring systems to identify patients in critical condition in advance of onset to perform prompt intervention to improve patient safety and clinical outcome [1-5]. For afferent limbs, such systems widely range from simple and easy bedside calculations to more sophisticated complex scoring systems that include laboratory test results, a combination of patient clinical characteristics and medical histories, and therapeutic interventions [6-9]. Furthermore, due to recent revolutionary progress in artificial intelligence (AI) and machine learning, these algorithms can be implemented for more precise and earlier prediction of critical events [10-13]. However, most research has focused on adult populations and has rarely been externally validated or widely implemented in real clinical practice.
Previously, we developed a deep-learning-based early-warning system (DEWS) for predicting in-hospital cardiac arrest (IHCA) in an adult population [14] and demonstrated its excellent clinical performance. After fine-tuning and setting up the DEWS, we implemented electronic medical records (EMR) to monitor the risk of deterioration among adult patients in general wards, presenting better performance that conventional methods. The DEWS was successfully implemented in rapid response systems (RRTs) [15] and was validated by a multicenter study including adult patients [16]. Subsequently, further upgrades for learning and additional training using pediatric data led to development of a deep-learning-based pediatric early-warning system (pDEWS) that can predict pediatric IHCA and unexpected general ward-to-pediatric intensive care unit (PICU) transfer (UIT), which were validated in a single-center study [17]. In this study, we aimed to validate the clinical performance of pDEWS externally for predicting deterioration events in a larger multicenter cohort and compared it to several conventional predicting models.
This was a retrospective multicenter observational cohort study of five tertiary-care academic children’s hospitals. The requirement for informed consent was waived due to the retrospective nature of the study. External validation of the clinical performance of previously developed pDEWS for identifying deterioration events defined as either UIT or IHCA within 24 hours before event occurrence was performed [17]. This study was approved by the Institutional Review Board of each participating hospital (Seoul National University Children's Hospital: 2003-229-1115; Severance Hospital: 4-2019-1304; Kyungpook National University Children's Hospital: 2020-02-002; Pusan National University Yangsan Hospital: 05-2020-005; Samsung Medical Center, 2020-03-148-0020, respectively).
The pDEWS architecture includes an embedding layer, three bi-directional long short-term memory (LSTM) layers for modeling the sequential characteristics of EMR data as an encoder, and three fully connected (FC) layers as a classifier. Before the LSTM encoder, we embedded the input data, consisting of respiratory rate (RR), heart rate (HR), systolic blood pressure (SBP), diastolic blood pressure (DBP), body temperature (BT), age, and a time feature through the FC embedding layer. To reflect the vital sign trend for each patient, 20 consecutive series of vital signs were used as inputs to the LSTM layer [18]. We used the last time step LSTM output to pass to the FC layer. Batch normalization and dropout were used on each FC layer in the classifier to regularize and stabilize the pDEWS model [19]. By adding a softmax layer at the end, the pDEWS model output a score between 0 and 1. We optimized the parameters of the pDEWS model by minimizing the cross-entropy loss function with the Adam optimizer [20]. The hyperparameters were tuned with the best performance from 10% of the derivation data. To resolve the class imbalance problem, we over-sampled the event data allowing duplication during the training process. We trained our model for 1000 epochs and selected the model with the highest area under the receiver operating characteristic curve (AUROC) score in the validation data. We also applied a transfer learning technique [21] to encourage our pDEWS model to obtain additional knowledge from other data by initializing the pDEWS model’s connection weights from the DEWS model, which was developed to predict adult patient IHCA.
Pediatric patients (<19 years old) admitted to the general wards of five university affiliate tertiary care medical centers in the Republic of Korea over a 12-month period between January 2019 and December 2019 were included. From EMRs and the medical database, we collected patient data including age, sex, event occurrence, exact time and location of event occurrences, and length of hospital stay and extracted five basic vital signs—RR, HR, SBP, DBP, and BT—during hospitalization for pDEWS and other early-warning system calculation.
We excluded patients with data recorded <30 minutes after admission, no vital signs at 24 hours prior to the deterioration event, incorrect demographics, and do-not-resuscitate orders. Patient information was anonymized and de-identified prior to analysis. Outlier values outside the normal range of each vital sign or non-numeric values were excluded from the initially collected data and treated as missing values (Supplementary Table 1). Missing values were replaced with the most recent previous values. Based on these data, we also calculated the modified pediatric early-warning score (PEWS) to include only vital sign parameters (HR, RR, SBP, oxygen saturation, and temperature).
The primary outcome of interest was deterioration event, defined as a composite of IHCA and UIT. UIT was defined as “PICU admission due to acutely deteriorating clinical conditions,” excluding routine scheduled post-surgical treatment or PICU admission for scheduled procedures. Secondary outcomes were numbers of each type of deterioration event, IHCA and UIT. We also performed subgroup analyses by hospital, age groups, event occurrence time, and sex.
For validation, we performed extensive statistical analysis using scikit-learn (Scikit-learn 0.23.1; community-driven project sponsored by BCG GAMMA) and pandas (Pandas 1.0.5; community-driven project sponsored by NumFOCUS). We evaluated deterioration prediction performance by calculating the AUROC and the area under the precision-recall curve (AUPRC) [22,23]. AUROC is one of the most generally used metrics and shows the area of sensitivity versus the false-positive rate. Compared with AUROC, AUPRC describes class imbalance data by measuring the area under the plot of precision versus sensitivity. Additionally, we calculated F-1 score [2x(precisionxrecall)/(precision+recall)], the net reclassification index (NRI), positive predictive value [PPV=true positive/(true positive+false positive)], negative predictive value [NPV=true negative/(true negative+false negative)], mean alarm count per day (MACPD) per 1,000 beds, and patient number needed to examine (NNE) [23,24]. The NRI is used to compare improvement in prediction performance. To compare the clinical prediction of deterioration events within 24 hours prior to occurrence, we trained random forest (RF) models with various hyperparameter sets and logistic regression (LR) models with an L2 regularization penalty and 1e-4 tolerance for stopping criteria to obtain comparable performance to that of our pDEWS model. Then, we evaluated the clinical performance of pDEWS by comparing to modified PEWS, RF, and LR. In addition to predictive performance, we evaluated the alarm rate with comparison to MACPD at a set sensitivity level and the cumulative prediction percentage of deterioration events at the same time point within 24 hours of the event.
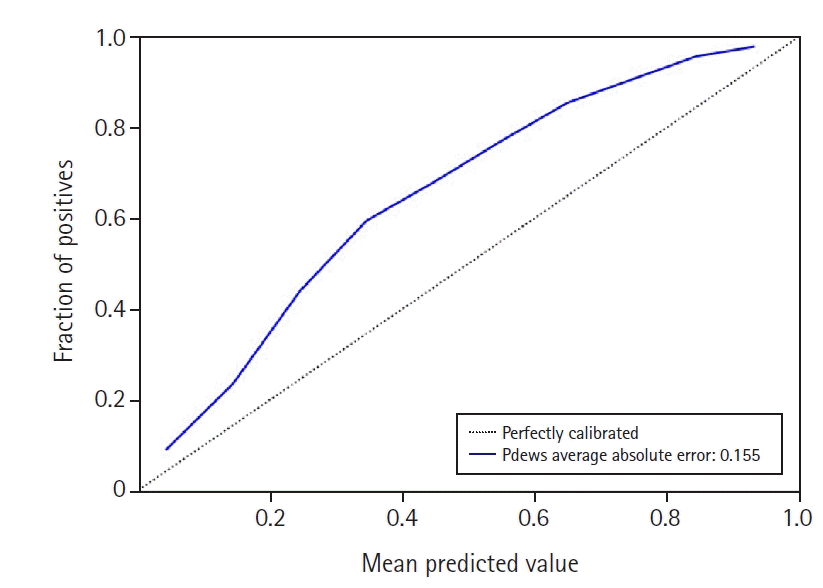
Additionally, we calibrated pDEWS to reflect the real probability of deterioration events because a predictive model should infer proper output probabilities without being extreme. We visualized pDEWS model calibration performance by comparing it with the ideal calibration line. We also performed feature importance analysis to interpret which characteristics of vital signs influence pDEWS model decision and calculated the importance of each feature and time-step by applying Shapley Additive Explanations (SHAP) values [25].
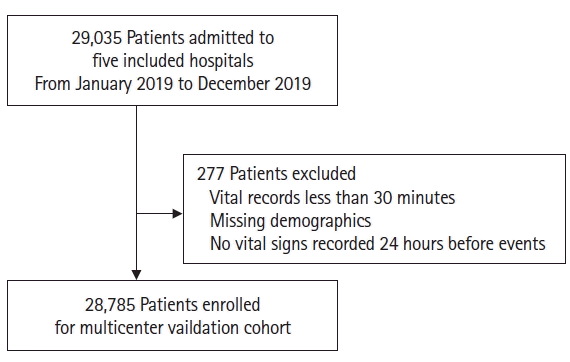
Among the 29,035 patients admitted to five hospitals over a 12-month duration, 277 were excluded (Figure 1). Among the remaining 28,758 patients, 16,167 were male (56.2%). The median hospital stay was 3.35 days (2.25–6.13 days) (Table 1). A total of 996,874 vital sign sets was evaluated to validate the pDEWS. There were 34 cases of IHCA, 291 cases of UIT, and 325 related vital sign sets.
The pDEWS yielded an AUROC of 0.892 (95% confidence interval [CI], 0.888–0.895) for predicting deterioration events, which was larger than those of modified PEWS, LR, and RF models (Figure 2). The pDEWS AUPRC for predicting critical events was 0.093 (95% CI, 0.089–0.098), which was larger than the modified PEWS (0.029; 95% CI, 0.028–0.031), LR (0.045; 95% CI, 0.042–0.049), and RF (0.042; 95% CI, 0.040–0.044) models. We evaluated sensitivity, specificity, positive likelihood ratio (PLR), negative likelihood ratio (NLR), PPV, NPV, F-score, NNE, and MACPD for each cutoff value for predicting critical events (Table 2). Given that the cutoff value of the pDEWS was 90, it showed an acceptable F-1 score, corresponding to the most acceptable PPV and NPV for clinical integration, MACPD, and NNE.
In a paired comparison to the modified PEWS, the LR, and RF models at the same specificity, pDEWS showed superior performance with the highest sensitivity, PLR, PPV, and F-1 score and the lowest NLR and NNE (Supplementary Table 2). The pDEWS provided much lower MACPD and NNE for these deterioration events under the same sensitivity than did the modified PEWS, LR, and RF models (Figure 3). It markedly reduced false alarms in detecting these deterioration events by 56%, 37%, and 66%, respectively, at the cutoff value of the modified PEWS≥5 compared with modified PEWS, LR, and RF models (Figure 3). The cumulative percentage of deteriorating patients for these deterioration events was larger in the pDEWS than the modified PEWS or the LR or RF prediction models at the same cutoff level (Figure 4). The pDEWS showed markedly larger values than other methods for the true alarm count at 12 hours before the occurrence and for the total period.
For prediction of each type of deterioration event by pDEWS, the AUROC for IHCA was 0.865 (95% CI, 0.847–0.883) and for UIT was 0.897 (95% CI, 0.893-0.901) (Figure 5). For AUPRC, IHCA was 0.006 (95% CI, 0.005–0.008), and UIT was 0.100 (95% CI, 0.096–0.106).
The five participating hospitals had different characteristics in that hospital B had a higher proportion of UIT (1.8%), and hospital A had a higher proportion of IHCA than the other hospitals. In a comparison of AUROCs for predicting deterioration events by individual hospital, the pDEWS yielded a larger AUROC than other prediction models (Figure 6). For comparing patients by age (<3 months, 3 months to <1 year, 1 to <4 years, 4 to <12 years, and 12 to <19 years), the pDEWS AUROC for predicting deterioration events increased with increasing age group (Figure 7A). It also outperformed other models regardless of age group. pDEWS AUROCs were similar between day and night, weekday and weekend, and male and female comparisons. It also consistently showed the best performance for any occurrence time among the compared prediction models (Figure 7B). There was also no difference in predicting power between male and female patients (Figure 7C).
Model calibration identified acceptable results by showing that the fraction of positive examples increased proportionally to pDEWS prediction score (Figure 8). Feature analysis demonstrated the importance of individual factors to the pDEWS at each time-step (Figure 9). We calculated the mean absolute SHAP values using data from validation cohorts. The SHAP values indirectly showed the contribution of each feature, which improved pDEWS reliability.
In this study, the pDEWS showed excellent performance for predicting deterioration events in a multicenter validation cohort. It showed earlier identification of deterioration events with fewer false alarms, MACPD, and NNE than other early-warning prediction models including pDEWS, RF, and LR models. Previously, the pDEWS was validated in a single-center retrospective study [17]. However, it was performed in a different cohort from the same hospital from which patient data were collected for its development. Even though it was composed of different patients split into development and validation cohorts by admission period, its performance for different groups could not be guaranteed and, thus, had limited generalizability. Consistent with this, as many PEWS have been developed and introduced, there have been problems associated with considerable variation in the performance in different settings [5,6,26-28]. Therefore, external validation is required to widely implement this method in clinical practice.
Similar to previous single-center validation studies in pediatric populations, pDEWS also showed good performance in the multicenter cohort. Although the five included hospitals had different settings and characteristics, the pDEWS demonstrated excellent and consistent clinical performance in each hospital, suggesting strong advantages of this method using deep learning methods based on only five basic vital signs. One of the significant obstacles for a multicenter study is disparity in EMR quality, which could vary widely across hospitals. However, vital-sign data are essential for all admitted patients and are usually systematically checked and recorded using the same measurement units regardless of institution, which enables the pDEWS model to be applied without specialized staged modifications across hospitals. Consistent with previous reports, this study showed that complex systems that include many parameters are not necessary for improving performance quality.
The pDEWS also showed consistent performance in several subgroup analyses categorized by sex, age, and event-occurrence time. pDEWS success could be due partially to the advantages of AI, which reduce human error. The performance of prediction deterioration events improved with increasing age group, though this might also be related to the characteristics of AI and deep learning methods, where few event numbers in the younger age group could pose a difficulty for deep learning and model training. Nevertheless, the pDEWS yielded the largest AUROC for predicting deterioration events among the prediction models, highlighting its excellent performance.
The primary goal of the early-warning system (EWS) is to reduce critical events by timely recognition and intervention for deteriorating patients. As EWS are increasingly introduced and used in clinical practice, clinical outcomes have improved and in-hospital critical events have decreased significantly [3,29-31]. These results could be related to the timeliness of EWS recognition [32,33]. As compared with the cumulative prediction percentage of deterioration events at the same time point within 24 hours of the event, pDEWS yielded a larger area than those of other prediction models.
On the other hand, regarding RRT implementation, alarm count is a key point of interest for validating EWS. As previously reported, there is the challenge of increased alarm rates, which is related to not only accuracy and efficacy, but also practicality. A false alarm results in unnecessary activation of RRT, which could lead to RRT exhaustion with alarm fatigue and additional workload [34,35]. Consequently, excessive false alarms and alarm fatigue might result in inappropriate responses and desensitization and reduced or missing responses to clinically significant events, putting the patient at substantial risk of decreased safety and poor quality of care [36,37]. However, the pDEWS has an outstanding feature for controlling the alarm count with smaller MACPD and NNE at the same specificity as other prediction models. Thus, in real clinical practice, implementation of the pDEWS to an EMR system could be automatic by manipulating the input vital sign data. From this information, the pDEWS could predict and detect deterioration events early and accurately, generating alarms for RRT activation. As the pDEWS showed acceptable levels of MACPD and NNE, it could be helpful for more efficient RRT operations with few false alarms, which could reduce physician workload, enable prompt and effective intervention, and consequently decrease critical event occurrence and improve clinical outcomes. Furthermore, pDEWS has the advantage of being adjustable according to site characteristics by controlling the alarm threshold. Collectively speaking, pDEWS has a promising role for improving clinical practice.
In addition to other supporting outcome data for clinical performance of pDEWS, we evaluated and performed calibration of this prediction model, which showed acceptable findings. The previous deep-learning-based model has been criticized for being a “black box” in terms of decision making with nontransparent, unknown, and non-traceable algorithms [38,39]. However, in this study, we performed feature importance analysis, which showed the importance of each factor by time-step. This could partially explain the underlying process of pDEWS.
This study has several advantages. To our knowledge, this is the first evaluation of the clinical performance of an EWS for predicting deterioration events composed of IHCA and UIT in a pediatric multicenter validation cohort. It demonstrated excellent performance using various statistical approaches. This study also included subgroup analysis to consider various clinical situations, which could be helpful for application in real clinical practice. We performed model calibration and feature importance analysis, which were rarely performed in previous studies, and which demonstrated the high quality of this prediction model and partially explained the deep-learning-based algorithm.
Additionally, this study has several limitations. Because the primary outcome was deterioration events composed of IHCA and UIT, all included institutions were tertiary academic children’s hospitals because of the need for a PICU. Therefore, this study could have a selection bias and its generalizability is limited. Because it is a multicenter study, EMR quality, data collection, and the related missing rate could be different across all hospitals, which could affect the results. There was a smaller number of events in the younger age group, which could affect pDEWS performance.
The pDEWS showed excellent clinical performance for predicting deterioration events, including IHCA and UIT, compared with modified PEWS and other prediction models, like RF or LR. The pDEWS offered earlier prediction with fewer false alarms and higher accuracy, which could be promising if implemented in real clinical practice. It may provide more precise and timely identification of deterioration events, which could be helpful for more efficient operation of RRT with decreased workload and improved clinical outcomes.
Notes
AUTHOR CONTRIBUTIONS
Conceptualization: SYS, CKJ, PSJ, JWK. Data curation: SYS, CKJ, LYH, CYH, JJH, KSY, KYH, KYA, CJB, JWK. Formal analysis: SYS, CKJ, LYH. Methodology: SYS, CKJ, LYH, JWK. Project administration: all authors. Visualization: SYS, CKJ, JWK. Writing–original draft: JWK, SYS, CKJ. Writing–review & editing: JWK, SYS, CKJ.
SUPPLEMENTARY MATERIALS
Supplementary materials can be found via https://doi.org/10.4266/acc.2022.00976.
Supplementary Table 1.
Missing rates of variables in the deep-learning-based pediatric early warning system
acc-2022-00976-suppl1.pdf
Supplementary Table 2.
Comparison of performance in the prediction of deterioration events at the same specificity
acc-2022-00976-suppl2.pdf
REFERENCES
1. Agulnik A, Antillon-Klussmann F, Soberanis Vasquez DJ, Arango R, Moran E, Lopez V, et al. Cost-benefit analysis of implementing a pediatric early warning system at a pediatric oncology hospital in a low-middle income country. Cancer. 2019; 125:4052–8.

2. Bonafide CP, Localio AR, Song L, Roberts KE, Nadkarni VM, Priestley M, et al. Cost-benefit analysis of a medical emergency team in a children’s hospital. Pediatrics. 2014; 134:235–41.

3. de Groot JF, Damen N, de Loos E, van de Steeg L, Koopmans L, Rosias P, et al. Implementing paediatric early warning scores systems in the Netherlands: future implications. BMC Pediatr. 2018; 18:128.

4. Sambeeck SJ, Fuijkschot J, Kramer BW, Vos GD. Pediatric Early Warning System Scores: lessons to be Learned. J Pediatr Intensive Care. 2018; 7:27–32.

5. Lambert V, Matthews A, MacDonell R, Fitzsimons J. Paediatric early warning systems for detecting and responding to clinical deterioration in children: a systematic review. BMJ Open. 2017; 7:e014497.

6. Chapman SM, Wray J, Oulton K, Pagel C, Ray S, Peters MJ. ‘The Score Matters’: wide variations in predictive performance of 18 paediatric track and trigger systems. Arch Dis Child. 2017; 102:487–95.

7. Chapman SM, Maconochie IK. Early warning scores in paediatrics: an overview. Arch Dis Child. 2019; 104:395–9.

8. Lockwood JM, Thomas J, Martin S, Wathen B, Juarez-Colunga E, Peters L, et al. AutoPEWS: automating pediatric early warning score calculation improves accuracy without sacrificing predictive ability. Pediatr Qual Saf. 2020; 5:e274.

9. Gorham TJ, Rust S, Rust L, Kuehn S, Yang J, Lin JS, et al. The vitals risk index-retrospective performance analysis of an automated and objective pediatric early warning system. Pediatr Qual Saf. 2020; 5:e271.

10. Zhai H, Brady P, Li Q, Lingren T, Ni Y, Wheeler DS, et al. Developing and evaluating a machine learning based algorithm to predict the need of pediatric intensive care unit transfer for newly hospitalized children. Resuscitation. 2014; 85:1065–71.

11. Pimentel MA, Redfern OC, Malycha J, Meredith P, Prytherch D, Briggs J, et al. Detecting deteriorating patients in the hospital: development and validation of a novel scoring system. Am J Respir Crit Care Med. 2021; 204:44–52.

12. Rubin J, Potes C, Xu-Wilson M, Dong J, Rahman A, Nguyen H, et al. An ensemble boosting model for predicting transfer to the pediatric intensive care unit. Int J Med Inform. 2018; 112:15–20.

13. Kang DY, Cho KJ, Kwon O, Kwon JM, Jeon KH, Park H, et al. Artificial intelligence algorithm to predict the need for critical care in prehospital emergency medical services. Scand J Trauma Resusc Emerg Med. 2020; 28:17.

14. Kwon JM, Lee Y, Lee Y, Lee S, Park J. An algorithm based on deep learning for predicting in-hospital cardiac arrest. J Am Heart Assoc. 2018; 7:e008678.
15. Cho KJ, Kwon O, Kwon JM, Lee Y, Park H, Jeon KH, et al. Detecting patient deterioration using artificial intelligence in a rapid response system. Crit Care Med. 2020; 48:e285–9.

16. Lee YJ, Cho KJ, Kwon O, Park H, Lee Y, Kwon JM, et al. A multicentre validation study of the deep learning-based early warning score for predicting in-hospital cardiac arrest in patients admitted to general wards. Resuscitation. 2021; 163:78–85.
17. Park SJ, Cho KJ, Kwon O, Park H, Lee Y, Shim WH, et al. Development and validation of a deep-learning-based pediatric early warning system: a single-center study. Biomed J. 2022; 45:155–68.

19. Srivastava N, Hinton G, Krizhevsky A, Sutskever I, Salakhutdinov R. Dropout: a simple way to prevent neural networks from overfitting. J Mach Learn Res. 2014; 15:1929–58.
20. Kingma DP, Ba J. Adam: a method for stochastic optimization. arXiv:1412.6980v9 [Preprint]. 2017 [cited 2021 Sep 18]. Available from: https://doi.org/10.48550/arXiv.1412.6980.

21. Torrey L, Shavlik J. Transfer learning. In : Olivas ES, Guerrero JD, Martinez-Sober MM, Jose Rafael, Serrano López AJ, editors. Handbook of research on machine learning applications and trends: algorithms, methods, and techniques. Hershey: IGI Global;2009. p. 242–64.
22. Ozenne B, Subtil F, Maucort-Boulch D. The precision: recall curve overcame the optimism of the receiver operating characteristic curve in rare diseases. J Clin Epidemiol. 2015; 68:855–9.
23. Weng CG, Poon J. A new evaluation measure for imbalanced datasets. In : In : Roddick JF, Li J, Christen P, Kennedy PJ, editors. AusDM '08: proceedings of the 7th Australasian Data Mining Conference; 2008 Nov 27-28; Glenelg, SA, Australia. Darlinghurst, NSW, Australia: Australian Computer Society, Inc.;2008. p. 27–32.
24. Leening MJ, Vedder MM, Witteman JC, Pencina MJ, Steyerberg EW. Net reclassification improvement: computation, interpretation, and controversies: a literature review and clinician’s guide. Ann Intern Med. 2014; 160:122–31.

25. Lundberg SM, Lee SI. A unified approach to interpreting model predictions. In : In : Guyon I, Luxburg UV, Bengio S, Wallach H, Fergus R, Vishwanathan S, editors. Advances in neural information processing systems 30 (NIPS 2017): NeurIPS Proceedings; 2017 Dec 4-8; Long Beach, CA, USA. Curran Associates Inc.;2017.
26. Trubey R, Huang C, Lugg-Widger FV, Hood K, Allen D, Edwards D, et al. Validity and effectiveness of paediatric early warning systems and track and trigger tools for identifying and reducing clinical deterioration in hospitalised children: a systematic review. BMJ Open. 2019; 9:e022105.

27. Kowalski RL, Lee L, Spaeder MC, Moorman JR, Keim-Malpass J. Accuracy and Monitoring of Pediatric Early Warning Score (PEWS) scores prior to emergent pediatric intensive care unit (ICU) transfer: retrospective analysis. JMIR Pediatr Parent. 2021; 4:e25991.

28. Jensen CS, Aagaard H, Olesen HV, Kirkegaard H. Inter-rater reliability of two paediatric early warning score tools. Eur J Emerg Med. 2019; 26:34–40.

29. Kotsakis A, Lobos AT, Parshuram C, Gilleland J, Gaiteiro R, Mohseni-Bod H, et al. Implementation of a multicenter rapid response system in pediatric academic hospitals is effective. Pediatrics. 2011; 128:72–8.

30. McLellan MC, Gauvreau K, Connor JA. Validation of the Children’s Hospital Early Warning System for critical deterioration recognition. J Pediatr Nurs. 2017; 32:52–8.

31. Brown SR, Martinez Garcia D, Agulnik A. Scoping Review of Pediatric Early Warning Systems (PEWS) in resource-limited and humanitarian settings. Front Pediatr. 2019; 6:410.

32. Dean NP, Cheng JJ, Crumbley I, DuVal J, Maldonado E, Ghebremariam E. Improving accuracy and timeliness of nursing documentation of Pediatric Early Warning Scores. Pediatr Qual Saf. 2020; 5:e278.

33. Hyland SL, Faltys M, Hüser M, Lyu X, Gumbsch T, Esteban C, et al. Early prediction of circulatory failure in the intensive care unit using machine learning. Nat Med. 2020; 26:364–73.

34. Nguyen J, Davis K, Guglielmello G, Stawicki SP. Combating alarm fatigue: the quest for more accurate and safer clinical monitoring equipment. In : Stawicki SP, Firstenberg MS, editors. Vignettes in patient safety. London: IntechOpen Limited;2019. p. 93–113.
35. Lyons PG, Edelson DP, Carey KA, Twu NM, Chan PS, Peberdy MA, et al. Characteristics of rapid response calls in the United States: an analysis of the first 402,023 adult cases from the get
with the guidelines resuscitation-medical emergency team registry. Crit Care Med. 2019; 47:1283–9.
36. Ruskin KJ, Hueske-Kraus D. Alarm fatigue: impacts on patient safety. Curr Opin Anaesthesiol. 2015; 28:685–90.
37. Cvach M. Monitor alarm fatigue: an integrative review. Biomed Instrum Technol. 2012; 46:268–77.
38. The Lancet Respiratory Medicine. Opening the black box of machine learning. Lancet Respir Med. 2018; 6:801.
Figure 2.
Areas under the receiver operating characteristic curves (AUROC) for predicting deterioration events. CI: confidence interval; pDEWS: deep-learning-based pediatric early-warning system; PEWS: pediatric early-warning score.
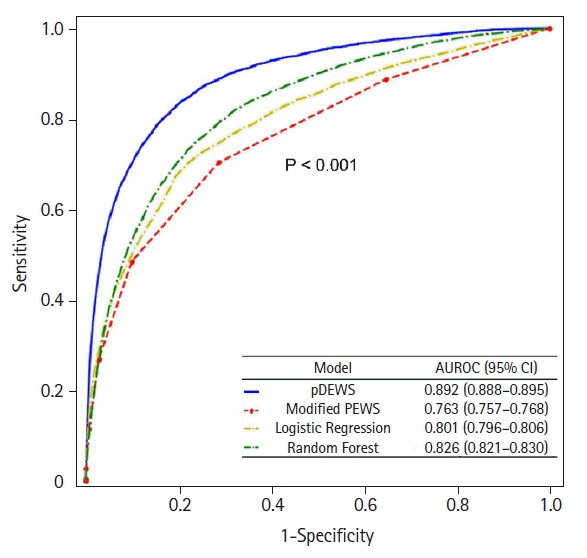
Figure 3.
Comparison of (A) mean alarm count per day at the same sensitivity and (B) sensitivity at the same number needed to examine for deterioration events. MACPD: mean alarm count per day; pDEWS: deep-learning-based pediatric early-warning system; PEWS: pediatric early-warning score.
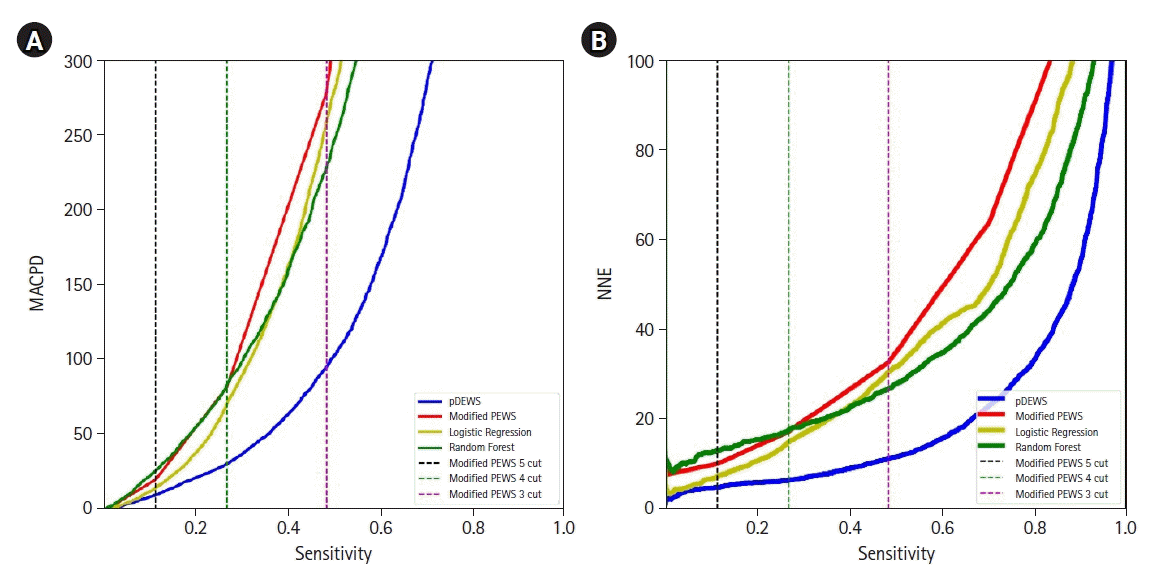
Figure 4.
Cumulative percentages of deteriorating patients. The cutoffs of the models for each figure were set at threshold points with the same specificity as (A) PEWS≥4, (B)PEWS≥5, and (C)PEWS≥6. pDEWS: deep-learning-based pediatric early-warning system; PEWS: modified pediatric early-warning score.
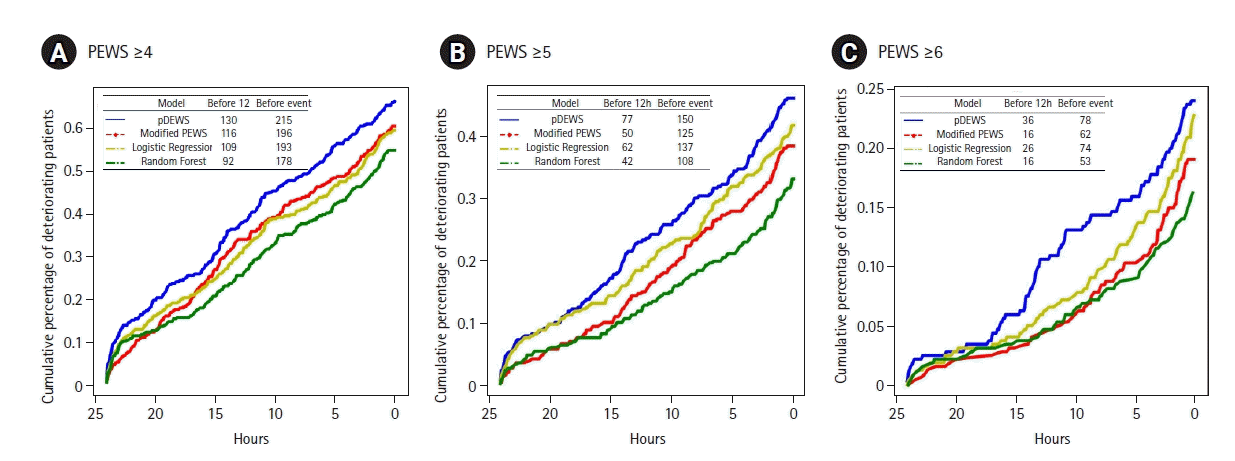
Figure 5.
Areas under the receiver operating characteristic curves (AUROC) for the prediction of (A) =>in-hospital cardiac arrest (IHCA) and (B) unexpected ward-to-pediatric intensive care unit transfer (UIT). CI: confidence interval; pDEWS: deep-learning-based pediatric early-warning system; PEWS: pediatric early-warning score.
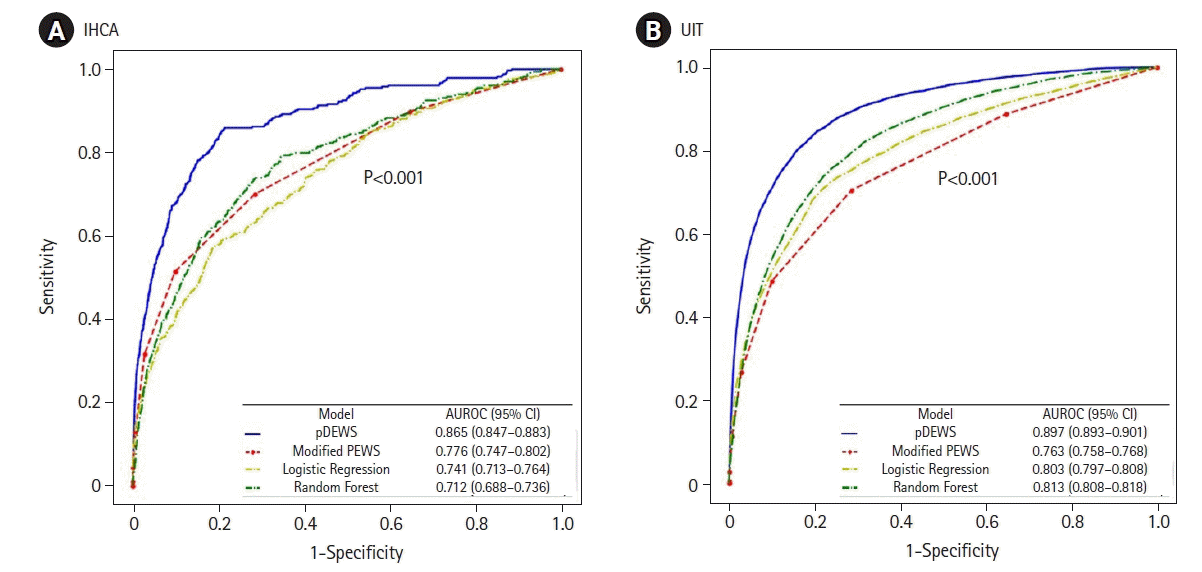
Figure 6.
Areas under the receiver operating characteristic curves (AUROC) for prediction of deterioration events by hospital: (A) hospital A, (B) hospital B, (C) hospital C, (D) hospital D, and (E) hospital E. CI: confidence interval; pDEWS: deep-learning-based pediatric early-warning system; PEWS: pediatric early-warning score.
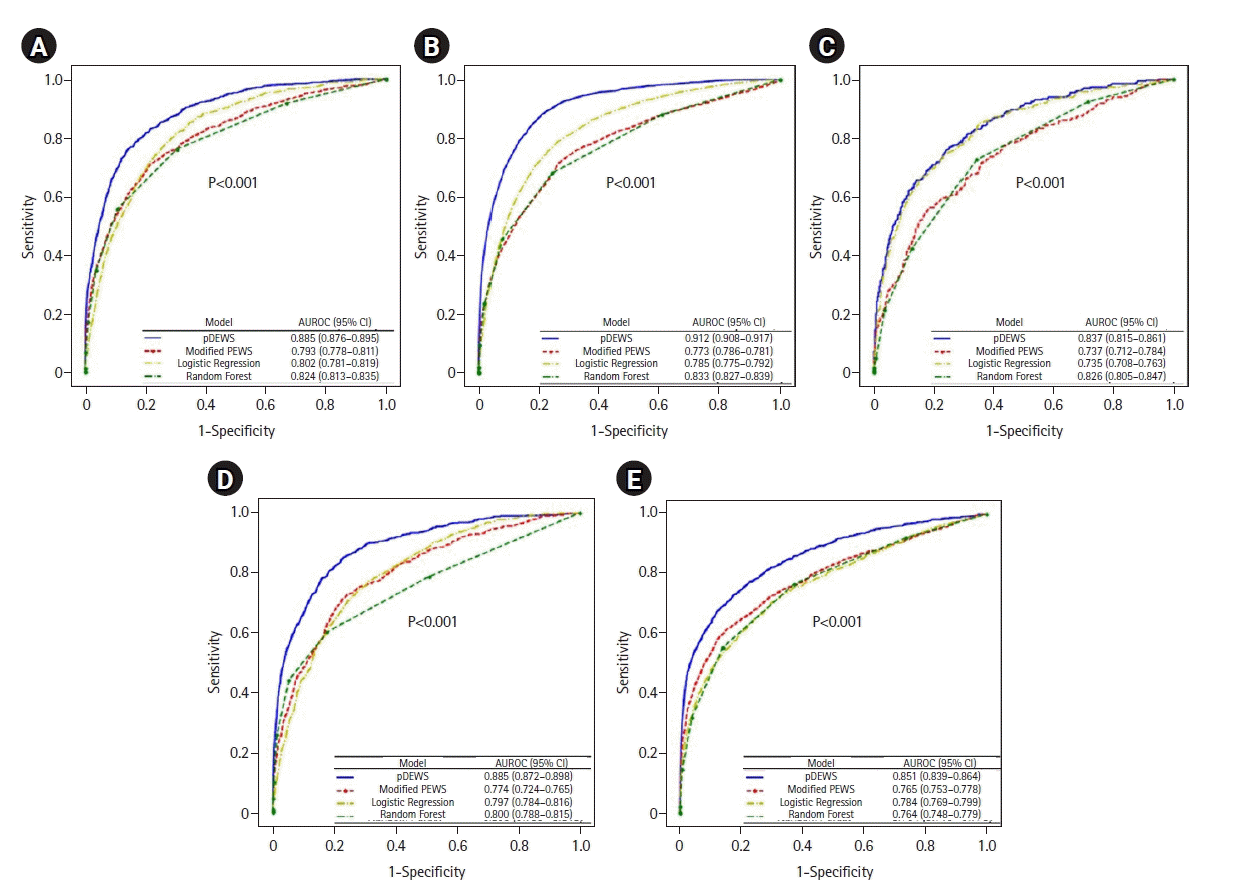
Figure 7.
Areas under the receiver operating characteristic curves (AUROC) for prediction of deterioration events by subgroup analysis: (A) age group, (B) event occurring time, and (C) sex. CI: confidence interval; pDEWS: deep-learning-based pediatric early-warning system; PEWS: pediatric early-warning score.
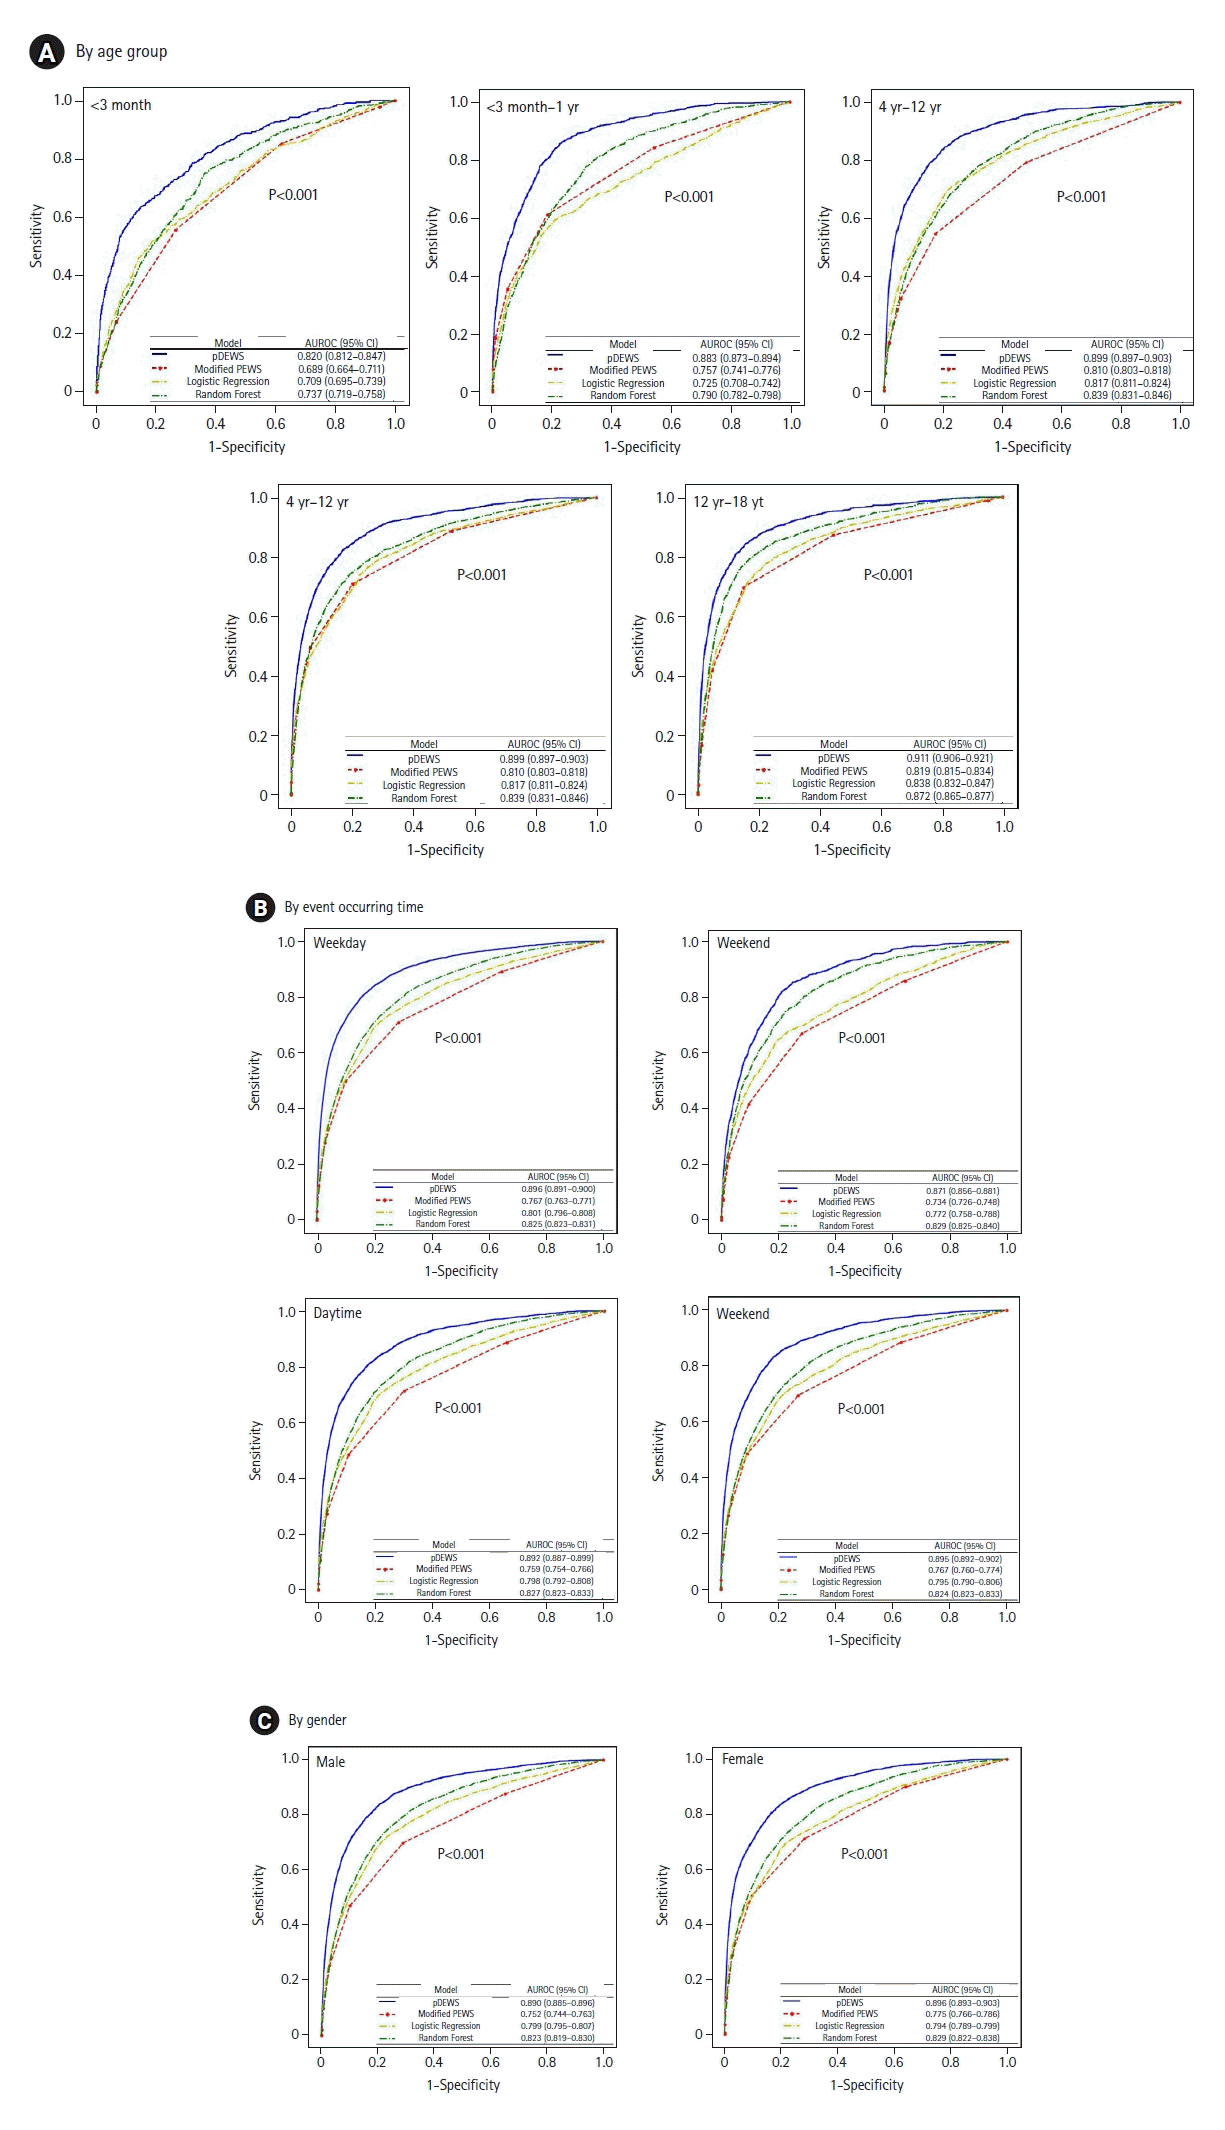
Figure 9.
Deep-learning-based pediatric early-warning system (pDEWS) model feature importance analysis. (A) Sequence-wise feature importance and (B) average feature importance. RR: respiratory rate; HR: heart rate; DBP: diastolic blood pressure; SBP: systolic blood pressure; BT: body temperature.
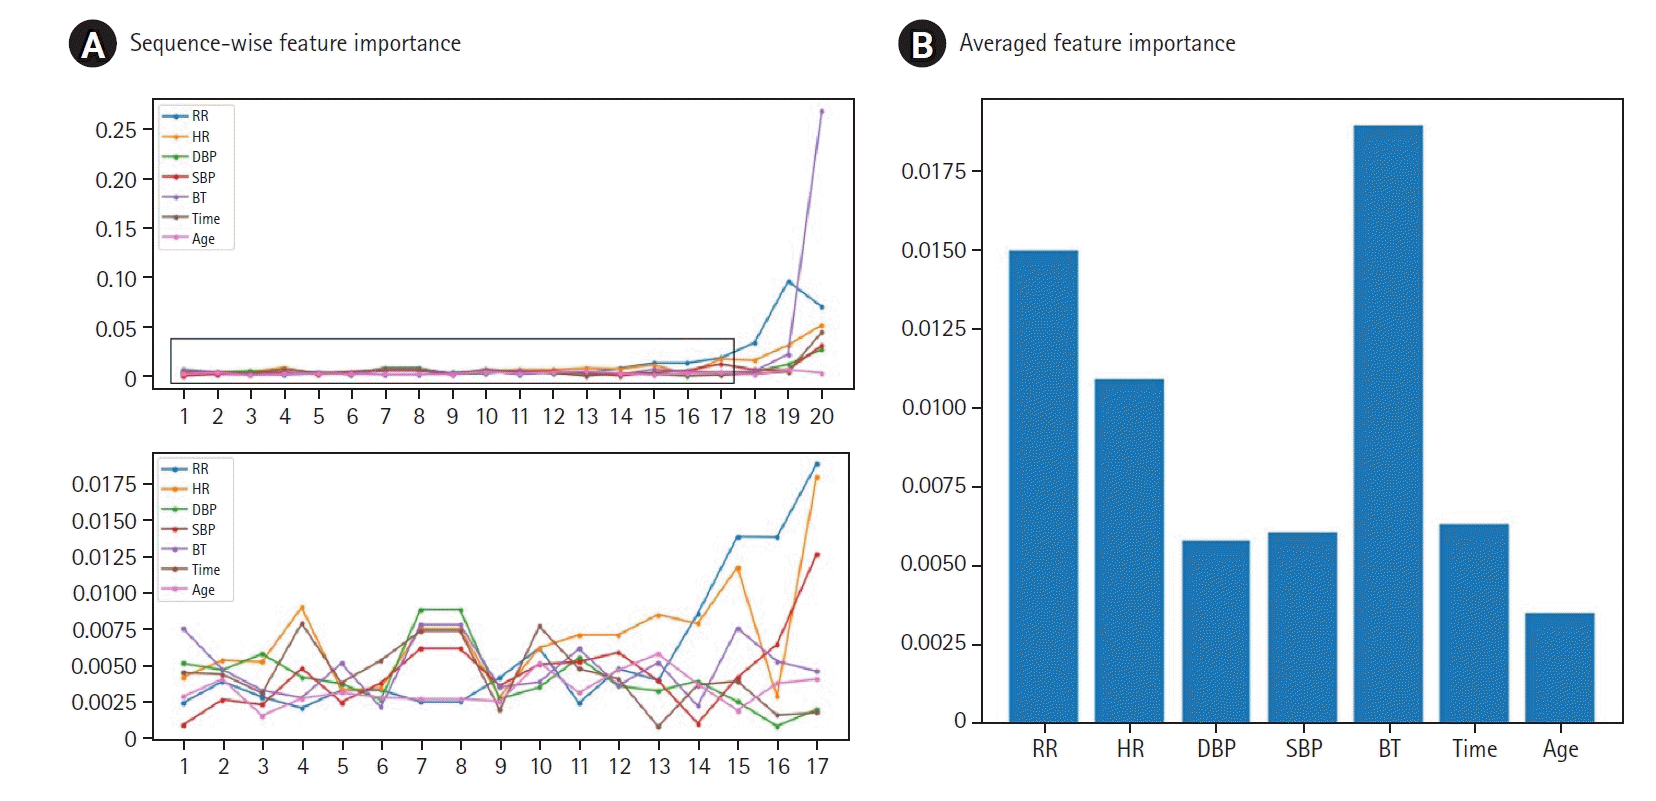
Table 1.
Baseline characteristics of the study population
Table 2.
Performance of the pDEWS for prediction of deterioration events at difference cutoff levels


 PDF
PDF Citation
 Print
Print


 XML Download