Journal List > Acute Crit Care > v.37(4) > 1516080753

Kim, Lee, Choi, Lee, and Lee: Comparison of mNUTRIC-S2 and mNUTRIC scores to assess nutritional risk and predict intensive care unit mortality

Abstract

Background

Nutritional status is associated with mortality. The modified Nutrition Risk in the Critically Ill (mNUTRIC) score is one of the most commonly used nutritional risk assessment tools in intensive care units (ICUs). The purpose of this study was to compare the mortality predictive ability of the mNUTRIC score to that of the mNUTRIC-S2 score, which uses the Simplified Acute Physiology Score (SAPS) II instead of the Acute Physiology and Chronic Health Evaluation (APACHE) II.

Methods

This retrospective cohort analysis included patients admitted to the ICU between January and September 2020. Each patient’s electronic medical records were reviewed. The model discrimination for predicting ICU mortality was assessed by the area under the receiver operating characteristic (ROC) curve, and a Cox regression model was performed to confirm the relationship between the groups and mortality.

Results

In total, 220 patients were enrolled. The ROC curve for predicting ICU mortality was 0.64 for the mNUTRIC score versus 0.67 for the mNUTRIC-S2 score. The difference between the areas was 0.03 (95% confidence interval [CI], –0.01 to 0.06; P=0.09). Patients with mNUTRIC-S2 score ≥5 had a greater risk of ICU mortality (hazard ratio [HR], 3.64; 95% CI, 1.85–7.14; P<0.001); however, no such relationship was observed with mNUTRIC score (HR, 1.69; 95% CI, 0.62–4.62; P=0.31).

Conclusions

The mNUTRIC-S2 score was significantly associated with ICU mortality. A cutoff score of 5 was selected as most appropriate.

INTRODUCTION

Patients with malnutrition are at a high risk of poor clinical outcomes, including increased morbidity, mortality, and prolonged intensive care unit (ICU) stay [1-5]. Furthermore, rapid protein loss in ICU patients is most likely to be associated with proinflammatory conditions and severe catabolism due to increased stress-related cytokines and hormones [6]. Therefore, it is important to evaluate the nutritional status of and provide appropriate nutritional support for ICU patients [7].
Heyland et al. [8] developed the Nutrition Risk in the Critically Ill (NUTRIC) score, which is the first nutritional risk assessment tool for ICU patients and incorporates age, number of comorbidities, days from hospital admission to ICU admission, Acute Physiology and Chronic Health Evaluation (APACHE) II score, Sequential Organ Failure Assessment (SOFA) score, and serum interleukin (IL)-6 level. Because IL-6 level is not routinely measured, Rahman et al. [9] validated the modified NUTRIC (mNUTRIC) score, which includes all variables except IL-6 level.
The APACHE II score, a prognostic index used in ICUs, was published in 1985 using clinical, physiological, and laboratory data shown during the first 24 hours after admission to the ICU [10]. The calibration of a prognostic model typically worsens over time owing to changes in ICU admission and discharge criteria, the advances in support, and changes in the availability and effectiveness of various treatments for specific situations. Therefore, technological and scientific advances in critical care medicine have led physicians to search for better tools than APACHE II to predict outcomes [11]. APACHE II requires clinical, physiological, and laboratory data acquisition during the first 24 hours after admission to the ICU [12]. Moreover, several studies using modern databases havused for the mNUTRIC score (SAPS IIe shown the inadequacy of APACHE II in performance evaluation and benchmarking. [13,14].
In this context, several studies have reported that the Simplified Acute Physiology Score (SAPS) II is superior to APACHE II in predicting mortality [15-18]. Therefore, the purpose of this study was to propose a new mNUTRIC-S2 (S2 as a reference to SAPS II) scoring system to replace the outdated APACHE II with SAPS II and to compare the ICU mortality prediction ability of the mNUTRIC and mNUTRIC-S2 scores. The hypothesis is that the mNUTRIC-S2 score will work as well as the mNUTRIC score in discriminating ICU mortality in critically ill patients.

MATERIALS AND METHODS

This study was approved (No. 1607-138-777) and the requirement for written informed consent was waived by the Institutional Review Board of Seoul National University Hospital. This study was conducted in accordance with the tenets of the Declaration of Helsinki.

Study Design and Participants

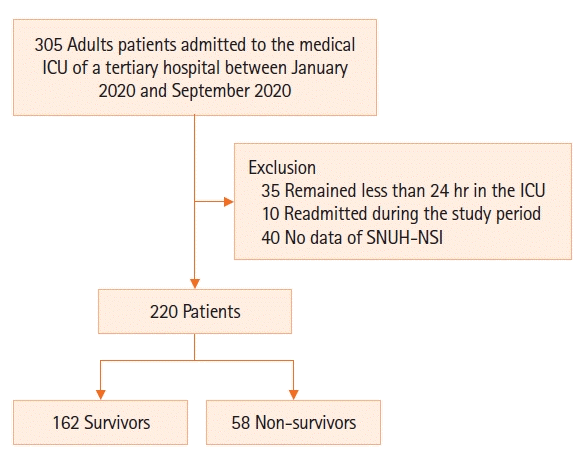
This retrospective cohort analysis included adult patients admitted to the medical ICU of a tertiary hospital between January 2020 and September 2020. Patients who remained in the ICU for less than 24 hours, those readmitted during the study period, and those who did not have data on the Seoul National University Hospital-Nutrition Screening Index (SNUH-NSI) evaluation items due to lack of cooperation were excluded.
We investigated the following data from the patients' electronic medical records: age; sex; body mass index (BMI); comorbidity; hospital length of stay; ICU length of stay; preadmission conditions; ICU admission diagnosis; APACHE II, SOFA, and SAPS II scores at ICU admission; and treatment received in the ICU (mechanical ventilation, ventilation days, prone position, tracheostomy, extracorporeal membrane oxygenation, and renal replacement therapy). Comorbidities were identified based on International Classification of Diseases, 10th revision codes, registered prior to the ICU admission date. ICU fellows recorded ICU admission and discharge records. IL-6 was not routinely measured in our ICU; therefore, we calculated the mNUTRIC score (0–9) from the available data. Information regarding each patient’s lab data was obtained from the patient’s SNUH-NSI sheet.
The nutritional status of each patient was evaluated using the SNUH-NSI, a nutritional search tool developed and used by Seoul National University Hospital, and classified into high-risk, moderate-risk, and low-risk groups for malnutrition. The nutritional evaluation index of the SNUH-NSI consists of 11 items. Indicators included weight change at hospitalization, appetite status, the patient's subjective statement of gastrointestinal disorders, and the most recent (at or within 2 weeks of admission) blood albumin, total blood cholesterol, total lymphocyte count, hemoglobin, C-reactive protein (CRP), diet type, age, and BMI [19]. SNUH-NSI evaluation items and risk stratification are presented in Supplementary Table 1. If the patient was unable to give information regarding his or her state of appetite, weight change, and subjective symptoms, the appointed nutritionist contacted family members for information.

Statistical Analysis

The sample size was based on the similar accuracy of the mNUTRIC and mNUTRIC-S2 scores. Therefore, considering a difference of 0.1 in the area under the curve between the mNUTRIC and mNUTRIC-S2 scores, a correlation of 0.7 positive and 0.5 negative between scores, a type I error of 5%, and a sample power of 80%, approximately 218 patients should be included at a 1/1 sample size ratio. Student t-test and Mann-Whitney U-test were used for continuous variables. Chi-square or Fisher’s exact test was used for categorical variables. A linear regression model was used to detect the SAPS II cutoff point, representing a similar APACHE II cutoff point to that used for the mNUTRIC score (SAPS II equation=14.98+1.58×APACHE II, P<0.001, R2=0.554).
The model’s discrimination for predicting ICU mortality was assessed by the area under the receiver operating characteristic (ROC) curve for both the mNUTRIC and mNUTRIC-S2 scores. Delong’s method was used to calculate the differences between the score areas under the curves. The cutoff value corresponding with the Youden’s index J was demarcated as the optimal value according to the Youden’s index method. Then, using the optimal stratification approach, the value presenting the greater sensitivity and specificity to discriminate mortality was used as the cutoff point of the scores.
Cox progressive and conditional regression models adjusted for covariates were performed by applying stepwise selection with backward elimination to determine ICU mortality between the mNUTRIC and mNUTRIC-S2 scores. The mortality risk estimates were presented as adjusted hazard ratios (aHRs) and their 95% confidence intervals (CIs), and the estimated ICU mortality rates were calculated for the groups using the Kaplan-Meier curve adjusted by Cox regression. Statistical significance was set at P<0.05. The ROC curves of the two scores were compared using MedCalc software (version 20.110; MedCalc Software, Ostend, Belgium). All other statistical analysis was conducted using IBM SPSS version 26.0 (IBM Corp., Armonk, NY, USA).

RESULTS

A total of 220 patients was enrolled in the study (Figure 1). Patient characteristics are shown in Table 1. Among the 220 patients, 162 (72.8%) were ICU survivors, who had significantly lower APACHE II, SOFA, and SAPS II scores than non-ICU survivors. The nutritional statuses of the patients are compared in Table 2. The majority of the patients admitted to the ICU were classified as high-risk according to the mNUTRIC (62.3%) and mNUTRIC-S2 (60.0%) scores. Non-survivors also had significantly higher median mNUTRIC and mNUTRIC-S2 scores. SNUH-NSI evaluation parameters were not different between the two groups. Although the SNUH-NSI is not a nutritional screening tool specifically for ICU patients, most patients admitted to the ICU were also at high risk for malnutrition according to the SNUH-NSI (64.5%). However, no statistical difference was observed between survivors and non-survivors.
The linear regression model between APACHE II and SAPS II yielded the SAPS II equation=14.98+1.58×APACHE II, P<0.001. Therefore, the points used in the mNUTRIC score for APACHE II were replaced according to the formula used to establish the mNUTRIC-S2 score (Table 3). The correlation between mNUTRIC and mNUTRIC-S2 scores was R2=0.83, P<0.001, 95% CI=0.86–0.97 (equation: mNUTRIC-S2 score=0.099+0.961 mNUTRIC score).
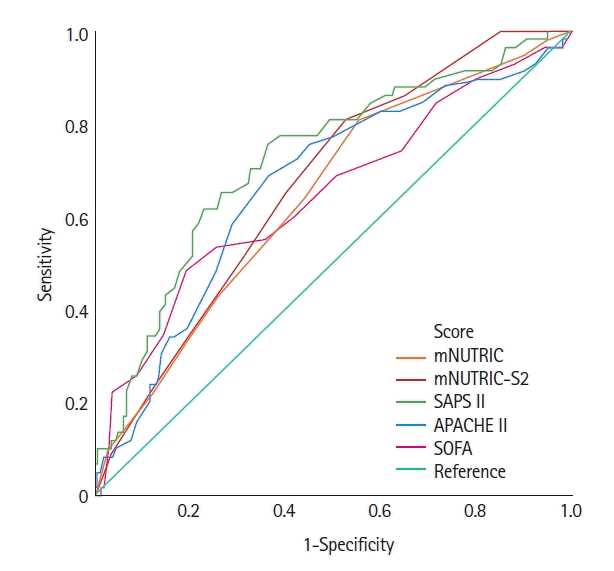
The areas under the ROC curve were similar in terms of the discriminatory power of the scores. The ROC curve for predicting ICU mortality was 0.64 for the mNUTRIC score versus 0.67 for the mNUTRIC-S2 score. The difference between the areas was 0.03 (95% CI, –0.01 to 0.06; P=0.09). A cutoff point of mNUTRIC-S2 score ≥5 resulted in a sensitivity of 81.0% and a specificity of 47.5%; on the other hand, a cutoff point of mNUTRIC score ≥5 resulted in a sensitivity of 81.0% and a specificity of 44.4%. The area under the ROC curve was 0.67 for APACHE II, 0.72 for SAPS II, and 0.65 for SOFA (Figure 2).
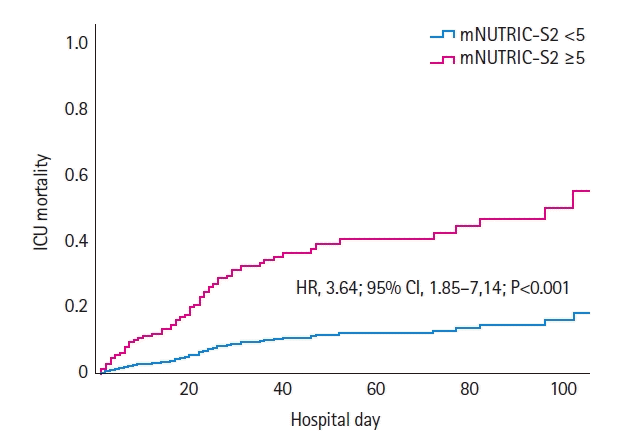
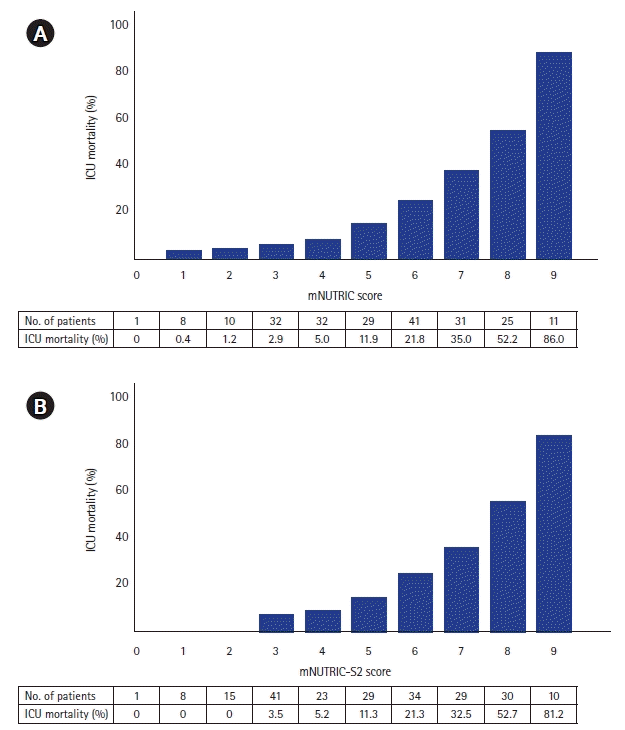
In the Cox regression model for predicting ICU mortality, patients with mNUTRIC-S2 score ≥5 had a greater risk of ICU mortality (HR, 3.64; 95% CI, 1.85–7.14; P<0.001) (Figure 3), whereas no such relationship was observed with the mNUTRIC score (HR, 1.69; 95% CI, 0.62–4.62; P=0.31). Our analysis showed that ICU mortality increased with higher mNUTRIC (Figure 4A) and mNUTRIC-S2 scores (Figure 4B). The ICU mortality for the maximum mNUTRIC score was 86.0% (Figure 4A), and that of the maximum mNUTRIC-S2 score was 81.2% (Figure 4B).

DISCUSSION

This study found that the mNUTRIC-S2 score, which uses SAPS II instead of APACHE II, was significantly associated with ICU mortality. A Cox logistic model recognized this proposed mNUTRIC-S2 score as an independent variable, predicting ICU mortality with a hazard rate multiplied by 3.64 (95% CI, 1.85–7.14; P<0.001) in patients who presented with an mNUTRIC-S2 score ≥5. In comparison, an mNUTRIC score ≥ 5 did not show the same performance (HR, 1.69; 95% CI, 0.62–4.62; P=0.31). Using the mNUTRIC-S2 score, we can easily identify patients more likely to benefit from aggressive nutritional therapy.
Prognostic estimates of predictive models are gradually less accurate as the time between their advancement, update, and application increases. Therefore, predictive models require periodic retesting, which requires re-estimation if accuracy is degraded, and variables with a significant prognosis are checked for inclusion. In this context, we have considered using the more recently updated APACHE IV or SAPS III for the mNUTRIC score. However, APACHE IV is much more complex, making its rapid application in clinical settings difficult. In addition, a previous study comparing the mortality predictive power of SAPS II and SAPS III found that both scores provided unreliable predictions, but unexpectedly, the newer SAPS III overpredicted mortality over the older SAPS II [20]. Consequently, SAPS II was considered appropriate for this study.
Several studies have assessed the nutritional risk in critically ill Korean patients using the NUTRIC and mNUTRIC scores. The mortality prediction of the NUTRIC and mNUTRIC scores was not different in Korean patients with sepsis [21]. Moreover, inadequate caloric supplementation in high mNUTRIC scores has been associated with higher mortality in Korean postoperative [22,23] and septic patients [24]. This study is one of the first to use mNUTRIC and mNUTRIC-S2 scores for nutritional risk assessment in general, non-surgical, and critically ill Korean patients.
In a previous study comparing mortality rates during hospitalization using SNUH-NSI at the time of admission, the mortality rate of patients in the low-risk group for malnutrition was 0.14%, whereas that of patients in the high-risk group was 5.9% [19]. Unlike the mNUTRIC score, the high-risk group for SNUH-NSI in this study showed a higher ICU mortality rate than the moderate- or low-risk groups. This is probably because the SNUH-NSI is a validated nutritional search tool for all inpatients, rather than critically ill patients [19,25,26].
Similar to the proposed mNUTRIC-S2 score of this study, the NUTRIC-SF score (which combines the modified NUTRIC score with a measure of sarcopenia and frailty) [27], the NUTRIC-S score (which uses SAPS III instead of APACHE II) [28], the NUTRIC score, and CRP [29] are other versions of critical nutritional risk assessment tools, in addition to the NUTRIC and mNUTRIC scores. First, the NUTRIC-SF score is better than the mNUTRIC score, the SARC-CALF (a measure of sarcopenia risk combined with calf circumference), and the Clinical Frailty Scale alone in predicting and discriminating 60-day outcomes [27]. Second, the NUTRIC-S score (S as a reference to SAPS III) was recently proposed. This study suggested that the NUTRIC-S score may be superior to the NUTRIC score in predicting mortality [28]. Third, there was a higher agreement between the mNUTRIC and NUTRIC scores with CRP, and combining the NUTRIC score with a subjective global assessment could predict mortality more accurately [29]. More information usually leads to better predictability. However, nutritional risk screening of critically ill patients should be possible even in patients with decreased mentality and hemodynamic instability. Questionnaires regarding previous strength and physical performance and measurement of calf circumference may not be feasible in all patients. Inevitably, the NUTRIC-SF score was only applied to patients without lower limb injury and neuromuscular diseases [27]. In addition, with respect to the NUTRIC-CRP score, there is a limitation regarding the use of CRP. This is because CRP, an acute-phase reactant that is made by the liver and secreted into the bloodstream within a few hours of infection or inflammation, may be low or normal for the first 12 hours [30]. The original study of the NUTRIC score development did not show any benefit of adding CRP instead of IL-6 to the NUTRIC score [8]. Proposal of various versions of the NUTRIC score shows that identifying nutritional risk in ICU patients is not a simple and straightforward practice. In a previous systematic review, the prevalence of nutritional risk in ICU patients was very diverse, probably explained by the different tools used and the heterogeneity of patients assessed [31].
Our study had several limitations. First, it included critically ill patients from a single tertiary hospital, which may limit the generalizability of the results. Second, although it was invented more recently, SAPS II still requires the acquisition of many variables. A less complicated scoring system with higher efficacy and accuracy is required in the clinical field. Moreover, SAPS II does not include traditional nutrition-related variables and does not compensate for the existing limitations of the mNUTRIC score. Third, the measurement of IL-6 was not available in our study population, and we were unable to calculate the NUTRIC score. Fortunately, many studies have shown that the mNUTRIC score is non-inferior to the NUTRIC score [21,32,33]. As this is one of the first studies suggesting the substitution of APACHE II with SAPS II, more multinational studies are required to validate these results and incorporate them into clinical practice. Last, the SNUH-NSI assessment was performed at hospital admission and may not adequately represent the patient’s status at the time of ICU admission. However, SNUH-NSI was not specifically designed for critically ill patients, and it was not our intent to compare it with the mNUTRIC or mNUTRIC-S2 scores.
This study found that the mNUTRIC-S2 score, which uses SAPS II instead of APACHE II, was significantly associated with ICU mortality. Patients with mNUTRIC-S2 score ≥5 had a higher risk of ICU mortality, while no such relationship was observed with the mNUTRIC score. A cutoff point of 5 is suggested with the mNUTRIC-S2 score which is similar to that of the mNUTRIC score. Further studies are needed to assess the mNUTRIC-S2 score in detail and to find an optimal nutritional screening tool for critically ill patients.

KEY MESSAGES

▪ The modified Nutrition Risk in the Critically Ill (mNUTRIC)-S2 score, which uses the Simplified Acute Physiology Score (SAPS) II instead of the Acute Physiology and Chronic Health Evaluation (APACHE) II, was significantly associated with intensive care unit (ICU) mortality.
▪ The suggested cutoff score of 5 was appropriate to screen Korean critically ill patients.
▪ Patients with mNUTRIC-S2 score ≥5 had a higher risk of ICU mortality, which was not observed with mNUTRIC score.

Notes

CONFLICT OF INTEREST

No potential conflict of interest relevant to this article was reported.

FUNDING

None.

ACKNOWLEDGMENTS

None.

AUTHOR CONTRIBUTIONS

Conceptualization: SJK, JL. Data curation: SJK. Formal analysis: SJK, JL. Methodology: SJK, JL. Writing–original draft: SJK, JL. Writing–review and editing: all authors.

SUPPLEMENTARY MATERIALS

Supplementary materials can be found via https://doi.org/10.4266/acc.2022.00612.
Supplementary Table 1.
acc-2022-00612-suppl.pdf

REFERENCES

1. Villet S, Chiolero RL, Bollmann MD, Revelly JP, Cayeux R N MC, Delarue J, et al. Negative impact of hypocaloric feeding and energy balance on clinical outcome in ICU patients. Clin Nutr. 2005; 24:502–9.
crossref
2. Doig GS, Simpson F, Finfer S, Delaney A, Davies AR, Mitchell I, et al. Effect of evidence-based feeding guidelines on mortality of critically ill adults: a cluster randomized controlled trial. JAMA. 2008; 300:2731–41.
crossref
3. Schneider SM, Veyres P, Pivot X, Soummer AM, Jambou P, Filippi J, et al. Malnutrition is an independent factor associated with nosocomial infections. Br J Nutr. 2004; 92:105–11.
crossref
4. Kyle UG, Pirlich M, Schuetz T, Lochs H, Pichard C. Is nutritional depletion by Nutritional Risk Index associated with increased length of hospital stay?: a population-based study. JPEN J Parenter Enteral Nutr. 2004; 28:99–104.
crossref
5. Giner M, Laviano A, Meguid MM, Gleason JR. In 1995 a correlation between malnutrition and poor outcome in critically ill patients still exists. Nutrition. 1996; 12:23–9.
crossref
6. Mukhopadhyay A, Henry J, Ong V, Leong CS, Teh AL, van Dam RM, et al. Association of modified NUTRIC score with 28-day mortality in critically ill patients. Clin Nutr. 2017; 36:1143–8.
crossref
7. McClave SA, Taylor BE, Martindale RG, Warren MM, Johnson DR, Braunschweig C, et al. Guidelines for the provision and assessment of nutrition support therapy in the adult critically ill patient: Society of Critical Care Medicine (SCCM) and American Society for Parenteral and Enteral Nutrition (A.S.P.E.N.). JPEN J Parenter Enteral Nutr. 2016; 40:159–211.
crossref
8. Heyland DK, Dhaliwal R, Jiang X, Day AG. Identifying critically ill patients who benefit the most from nutrition therapy: the development and initial validation of a novel risk assessment tool. Crit Care. 2011; 15:R268.
crossref
9. Rahman A, Hasan RM, Agarwala R, Martin C, Day AG, Heyland DK. Identifying critically-ill patients who will benefit most from nutritional therapy: further validation of the “modified NUTRIC” nutritional risk assessment tool. Clin Nutr. 2016; 35:158–62.
crossref
10. Knaus WA, Draper EA, Wagner DP, Zimmerman JE. APACHE II: a severity of disease classification system. Crit Care Med. 1985; 13:818–29.
11. Moreno RP, Nassar AP Jr. Is APACHE II a useful tool for clinical research? Rev Bras Ter Intensiva. 2017; 29:264–7.
crossref
12. Jeong S. Scoring systems for the patients of intensive care unit. Acute Crit Care. 2018; 33:102–4.
crossref
13. Harrison DA, Lone NI, Haddow C, MacGillivray M, Khan A, Cook B, et al. External validation of the Intensive Care National Audit & Research Centre (ICNARC) risk prediction model in critical care units in Scotland. BMC Anesthesiol. 2014; 14:116.
crossref
14. Brinkman S, Bakhshi-Raiez F, Abu-Hanna A, de Jonge E, Bosman RJ, Peelen L, et al. External validation of Acute Physiology and Chronic Health Evaluation IV in Dutch intensive care units and comparison with Acute Physiology and Chronic Health Evaluation II and Simplified Acute Physiology Score II. J Crit Care. 2011; 26:105.
crossref
15. Sathe PM, Bapat SN. Assessment of performance and utility of mortality prediction models in a single Indian mixed tertiary intensive care unit. Int J Crit Illn Inj Sci. 2014; 4:29–34.
crossref
16. Schellongowski P, Benesch M, Lang T, Traunmüller F, Zauner C, Laczika K, et al. Comparison of three severity scores for critically ill cancer patients. Intensive Care Med. 2004; 30:430–6.
crossref
17. Moreno R, Morais P. Outcome prediction in intensive care: results of a prospective, multicentre, Portuguese study. Intensive Care Med. 1997; 23:177–86.
crossref
18. Castella X, Artigas A, Bion J, Kari A. A comparison of severity of illness scoring systems for intensive care unit patients: results of a multicenter, multinational study. Crit Care Med. 1995; 23:1327–35.
19. Seol E, Ju DL, Lee HJ. Nutritional screening tool for in-hospital patients. J Clin Nutr. 2016; 8:2–10.
crossref
20. Poole D, Rossi C, Latronico N, Rossi G, Finazzi S, Bertolini G, et al. Comparison between SAPS II and SAPS 3 in predicting hospital mortality in a cohort of 103 Italian ICUs: is new always better? Intensive Care Med. 2012; 38:1280–8.
crossref
21. Jeong DH, Hong SB, Lim CM, Koh Y, Seo J, Kim Y, et al. Comparison of accuracy of NUTRIC and modified NUTRIC scores in predicting 28-day mortality in patients with sepsis: a single center retrospective study. Nutrients. 2018; 10:911.
crossref
22. Jung YT, Park JY, Jeon J, Kim MJ, Lee SH, Lee JG. Association of inadequate caloric supplementation with 30-day mortality in critically ill postoperative patients with high modified NUTRIC score. Nutrients. 2018; 10:1589.
crossref
23. Im KM, Kim EY. Identification of ICU patients with high nutritional risk after abdominal surgery using modified NUTRIC score and the association of energy adequacy with 90-day mortality. Nutrients. 2022; 14:946.
crossref
24. Jeong DH, Hong SB, Lim CM, Koh Y, Seo J, Kim Y, et al. Relationship between nutrition intake and 28-day mortality using modified NUTRIC score in patients with sepsis. Nutrients. 2019; 11:1906.
crossref
25. Kim Y, Kim WG, Lee HJ, Park MS, Lee YH, Kong SH, et al. Comparison of the impact of malnutrition by nutritional assessment and screening tools on operative morbidity after gastric cancer surgery. J Korean Soc Parenter Enter Nutr. 2011; 4:7–15.
crossref
26. Kim Y, Kim WG, Lee HJ, Park MS, Lee YH, Cho JJ, et al. Impact of Malnutrition risk determined by Nutrition Screening Index on operative morbidity after gastric cancer surgery. J Korean Surg Soc. 2011; 80:1–9.
crossref
27. Lee ZY, Hasan MS, Day AG, Ng CC, Ong SP, Yap CS, et al. Initial development and validation of a novel nutrition risk, sarcopenia, and frailty assessment tool in mechanically ventilated critically ill patients: the NUTRIC-SF score. JPEN J Parenter Enteral Nutr. 2022; 46:499–507.
crossref
28. Toledo DO, Junior JM, Toloi JM, de Assis T, Serra LM, do Carmo PG, et al. NUTRIC-S proposal: using SAPS 3 for mortality prediction in nutritional risk ICU patients. Clin Nutr Exp. 2020; 31:19–27.
crossref
29. Oliveira ML, Heyland DK, Silva FM, Rabito EI, Rosa M, Tarnowski MD, et al. Complementarity of modified NUTRIC score with or without C-reactive protein and subjective global assessment in predicting mortality in critically ill patients. Rev Bras Ter Intensiva. 2019; 31:490–6.
30. Ugarte H, Silva E, Mercan D, De Mendonça A, Vincent JL. Procalcitonin used as a marker of infection in the intensive care unit. Crit Care Med. 1999; 27:498–504.
crossref
31. Cattani A, Eckert IC, Brito JE, Tartari RF, Silva FM. Nutritional risk in critically ill patients: how it is assessed, its prevalence and prognostic value: a systematic review. Nutr Rev. 2020; 78:1052–68.
crossref
32. Kucuk B, Baltaci Ozen S, Kocabeyoglu GM, Mutlu NM, Cakir E, Ozkocak Turan I. NUTRIC score is not superior to mNUTRIC score in prediction of mortality of COVID-19 patients. Int J Clin Pract. 2022; 2022:1864776.
crossref
33. Zhang P, Bian Y, Tang Z, Wang F. Use of nutrition risk in critically ill (NUTRIC) scoring system for nutrition risk assessment and prognosis prediction in critically ill neurological patients: a prospective observational study. JPEN J Parenter Enteral Nutr. 2021; 45:1032–41.
crossref

Figure 1.
Flowchart of patient group selection. ICU: intensive care unit; SNUH-NSI: Seoul National University Hospital-Nutrition Screening Index.
acc-2022-00612f1.tif
Figure 2.
Comparison of receiver operating characteristic curves among the mNUTRIC, mNUTRIC-S2, SAPS II, APACHE II, and SOFA scores. The area under the ROC curve was 0.67 for APACHE II, 0.72 for SAPS II, and 0.65 for SOFA. mNUTRIC: modified Nutrition Risk in the Critically Ill; mNUTRIC-S2: mNUTRIC score by using Simplified Acute Physiology Score II as one of the variables instead of the Acute Physiology and Chronic Health Evaluation II Score; SAPS: Simplified Acute Physiology Score; APACHE: Acute Physiology and Chronic Health Evaluation; SOFA: Sequential Organ Failure Assessment.
acc-2022-00612f2.tif
Figure 3.
Intensive care unit (ICU) mortality curve when comparing mNUTRIC-S2 score ≥5 and mNUTRIC-S2 score <5. mNUTRIC-S2: modified Nutrition Risk in the Critically Ill score by using Simplified Acute Physiology Score II as one of the variables instead of the Acute Physiology and Chronic Health Evaluation II Score; HR: hazard ratio; CI: confidence interval.
acc-2022-00612f3.tif
Figure 4.
Intensive care unit (ICU) mortality according to mNUTRIC score (A) and mNUTRIC-S2 score (B). mNUTRIC: modified Nutrition Risk in the Critically Ill; mNUTRIC-S2: mNUTRIC score by using Simplified Acute Physiology Score II as one of the variables instead of the Acute Physiology and Chronic Health Evaluation II Score.
acc-2022-00612f4.tif
Table 1.
Characteristics of the study population
Variable ICU mortality
P-value
All patients (n=220) Survivor (n=162) Non-survivor (n=58)
Age (yr) 65.7±14.8 67.0±14.6 61.9±14.9 0.024
Male 136 (61.8) 99 (61.1) 37 (63.8) 0.839
BMI (kg/m2) 23.2±4.4 22.8±4.2 24.2±4.6 0.032
APACHE II score 20.8±9.1 19.5±8.4 24.5±9.8 <0.001
SOFA score 9.1±7.4 8.7±8.2 10.3±4.5 <0.001
SAPS II 48.0±19.7 43.9±17.5 59.4±20.9 <0.001
Hospital to ICU admission day 4.0 (0.0–13.0) 2.0 (0.0–9.0) 9.5 (1.0–21.0) 0.001
Hospital day 29.0 (16.0–62.5) 37.0 (19.0–70.0) 20.0 (7.0–29.0) <0.001
ICU day 5.0 (2.0–11.0) 5.0 (2.0–10.0) 5.0 (2.0–14.0) 0.829
ICU admission diagnosis
 Respiratory disease 134 (60.9) 97 (59.9) 37 (63.8) 0.713
 Cardiovascular disease 49 (22.3) 36 (22.2) 13 (22.4) 1.000
 Neurological disease 3 (1.4) 1 (0.6) 2 (3.4) 0.171
 Sepsis 41 (18.6) 27 (16.7) 14 (24.1) 0.290
 Renal disease 42 (19.1) 27 (16.7) 15 (25.9) 0.182
 Other 42 (19.1) 32 (19.8) 10 (17.2) 0.824
Comorbidity
 Hypertension 75 (34.1) 57 (35.2) 18 (31.0) 0.681
 Diabetes 78 (35.5) 57 (35.2) 21 (36.2) 1.000
 Chronic lung disease 56 (25.5) 48 (29.6) 8 (13.8) 0.028
 Chronic kidney disease 53 (24.1) 40 (24.7) 13 (22.4) 0.866
 Chronic liver disease 24 (10.9) 17 (10.5) 7 (12.1) 0.932
 Solid tumor 71 (32.3) 49 (30.2) 22 (37.9) 0.363
 Hematologic malignancy 38 (17.3) 19 (11.7) 19 (32.8) 0.001
 Immunodeficiency 102 (46.4) 61 (37.7) 41 (70.7) <0.001
 Chronic neurological disease 18 (8.2) 17 (10.5) 1 (1.7) 0.047
Mechanical ventilation 167 (75.9) 110 (67.9) 57 (98.3) <0.001
Ventilation day 3.0 (1.0–7.5) 3.0 (0.0–6.0) 4.0 (2.0–14.0) 0.001
Prone 27 (12.3) 14 (8.6) 13 (22.4) 0.012
Tracheostomy 44 (20.0) 34 (21.0) 10 (17.2) 0.674
ECMO 18 (8.2) 12 (7.4) 6 (10.3) 0.577
RRT 81 (36.8) 46 (28.4) 35 (60.3) <0.001

Values are presented as mean±standard deviation, number (%), or median (interquartile range).

ICU: intensive care unit; BMI: body mass index; APACHE: Acute Physiology and Chronic Health Evaluation; SOFA: Sequential Organ Failure Assessment; SAPS: Simplified Acute Physiology Score; ECMO: extracorporeal membrane oxygenation; RRT: renal replacement therapy.

Table 2.
The mNUTRIC, mNUTRIC-S2 scores, and SNUH-NSI evaluation items of the study population
Variable ICU mortality
P-value
All patients (n=220) Survivor (n=162) Non-survivor (n=58)
mNUTRIC score 5.0 (4.0–7.0) 5.0 (3.0–7.0) 6.0 (5.0–7.0) 0.001
 High risk 137 (62.3) 90 (55.6) 47 (81.0) 0.001
mNUTRIC-S2 score 5.0 (3.0–7.0) 5.0 (3.0–7.0) 6.0 (5.0–8.0) <0.001
 High risk 132 (60.0) 85 (52.5) 47 (81.0) <0.001
Appetite 0.098
 Bad 63 (28.6) 41 (25.3) 22 (37.9)
 Normal/good 157 (71.4) 121 (74.7) 36 (62.1)
Change of weight, yes 43 (19.5) 33 (20.4) 10 (17.2) 0.747
Difficulty in digesting, yes 49 (22.3) 31 (19.1) 18 (31.0) 0.092
Diet type 0.806
 Fluid diet 2 (0.9) 2 (1.2) 0
 Soft blended diet or NPO 130 (59.1) 97 (59.9) 33 (56.9)
 Normal regular diet 88 (40.0) 63 (38.9) 25 (43.1)
Albumin (g/dl) 3.0±0.6 3.1±0.6 2.9±0.7 0.171
Cholesterol (mg/dl) 111.0±50.5 111.4±46.8 109.6±60.1 0.828
Total lymphocyte count (cells/mm3) 736.0 (381.0–1,346.0) 708.0 (412.0–1,307.0) 792.0 (276.5–1,551.5) 0.823
Hemoglobin (g/dl) 10.1 (8.7–12.1) 10.5 (8.8–12.3) 9.8 (8.6–11.1) 0.170
C-reactive protein (mg/dl) 6.5 (2.6–17.0) 7.3 (2.6–16.5) 5.6 (2.7–17.6) 0.937
Status of malnutrition by SNUH-NSI 0.387
 High 142 (64.5) 100 (61.7) 42 (72.4)
 Medium 64 (29.1) 51 (31.5) 13 (22.4)
 Low 14 (6.4) 11 (6.8) 3 (5.2)

Values are presented as median (interquartile range), number (%), or mean±standard deviation.

mNUTRIC: modified Nutrition Risk in the Critically Ill; mNUTRIC-S2: mNUTRIC score by using Simplified Acute Physiology Score II as one of the variables instead of the Acute Physiology and Chronic Health Evaluation II Score; SNUH-NSI: Seoul National University Hospital-Nutrition Screening Index; ICU: intensive care unit; NPO: nothing by mouth.

Table 3.
Correlating the APACHE II cutoff point to the SAPS II cutoff points
NUTRIC scoring APACHE II SAPS II
0 <15 <38.68
1 15–19 38.68–46.58
2 20–27 46.58–59.22
3 ≥28 ≥59.22

SAPS II equation=14.98+1.58×APACHE II, P<0.001 (R2=0.554).

APACHE: Acute Physiology and Chronic Health Evaluation; SAPS: Simplified Acute Physiology Score; NUTRIC: Nutrition Risk in the Critically Ill.

TOOLS
Similar articles