

 PDF
PDF Citation
 Print
Print


Introduction
In forensic anthropology and bioarchaeology, the accurate construction of an unknown individual’s biological profile is essential. Hence, a large number of relevant works focus on methods for the accurate assessment of key parameters, such as sex and age. The developmental stages of the human skeleton have been tightly linked to the age of an individual [1, 2], especially in the earlier ages. As such, methods that assess the long-bone length together with the epiphyseal fusion state have been developed [3, 4], as well as methods that rely on dental evidence [5-7]. Similarly, the macroscopic degeneration of bones has been used to estimate age in adults, with the majority of traditional methods focusing mainly on the pelvic bones [8-10], the sternal end of ribs [11-13], and more advanced methods employing transition analysis on various skeletal age markers [14, 15].
Research has also been carried out regarding the spine and its association with aging. The vertebral column undergoes major morphological changes due to age degeneration and activity strain, which can be used as general indicators of aging [2]. The majority of age-related studies on the spine has focused on the observed morphological changes on the vertebral bodies and, more specifically, on the degree of the formed osteophytes [16-21]. The latter have been strongly associated with aging, as they are the result of the intervertebral disc degeneration and the subsequent osseous changes [22]. Other studies have used specific measurements to examine the effect of age on additional parameters of the vertebral body or other relevant skeletal structures [23-25].
Estimating the age-at-death of unknown skeletal remains based on the degree of osteophyte formation of the vertebral column has been extensively used in bioarchaeological and forensic contexts, especially when other skeletal age markers are missing or severely damaged. However, there is a limited number of studies focusing on age estimation from morphological properties of the vertebral body recorded as continuous variables, since the majority are using categorical scoring techniques based on macroscopic observation. Thus, this study proposes a number of geometrical variables deriving from the vertebral endplates of the 12th thoracic vertebra (T12), which was chosen due to its easily distinguishable morphology and high likelihood of remaining intact. The aim of this study is to examine whether the variables show significant association with age, using samples from two intertemporal European populations, and, if so, how aging affects the morphology of the vertebral endplates. The effects of sexual dimorphism are also evaluated and taken into account. Additionally, the proposed variables are examined for potential applications in forensic and bioarchaelogical contexts.
Materials and Methods
Sample description
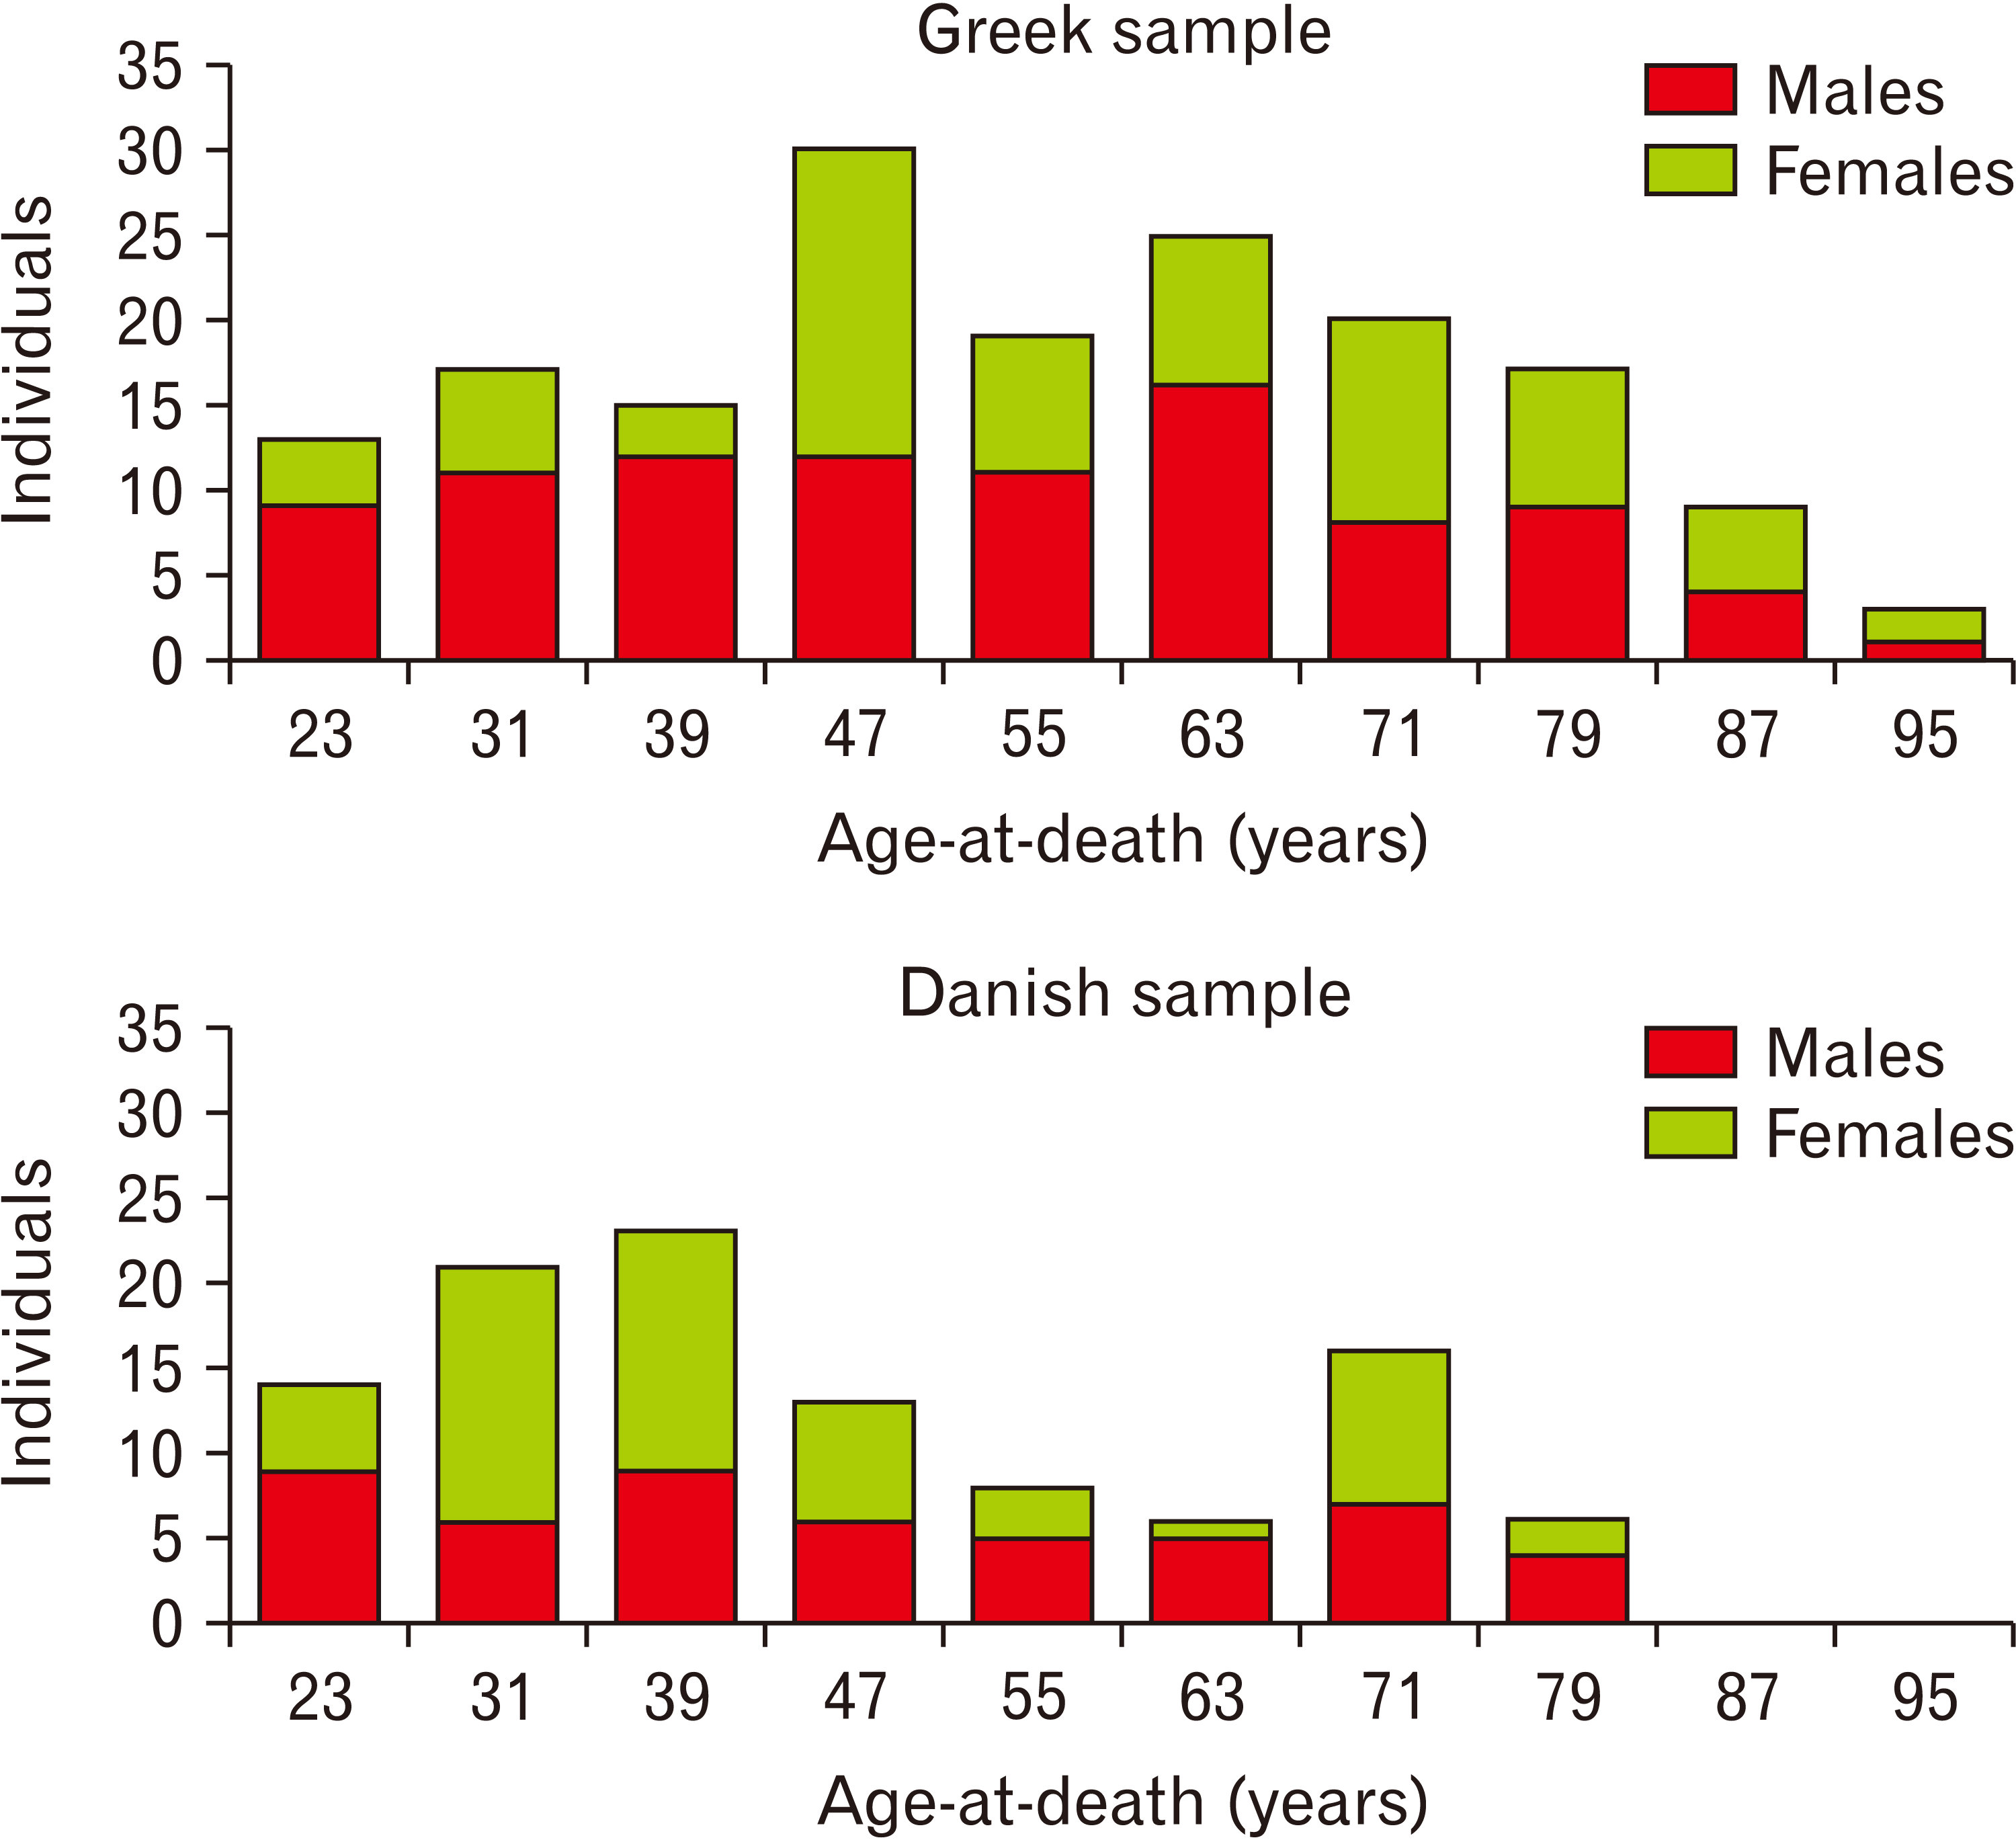
The working sample consists of two European populations: a modern Greek sample and two Danish archaeological assemblages, one unearthed in Aalborg (ÅHM6093 AS 40/14), a medieval urban population (AD 1100–AD 1600) and another from Holmens-Kirke (NM538/2013 AS 4/14), also urban dated back to the 18th century. The Greek sample is part of the Athens collection, which is housed in the Department of Animal and Human Physiology at the National and Kapodistrian University of Athens. It comprises 168 adult individuals (93 males and 75 females) born between 1879 and 1965, whose age-at-death ranges from 18 to 99 years old (mean: 55.7 years; standard deviation: 18.6 years; skewness: 0.02) as documented in their death certificates [26]. The Danish archaeological samples are housed in the Department of Forensic Medicine at the University of Copenhagen and are pooled for the purpose of this study. Pooling aims for adequate sample size and any population differences between the two chronologically distant archaeological assemblages do not pose any constrains in the experimental design (analysis) of this study. In total, they comprise 107 adult individuals (56 males and 51 females) with an estimated age-at-death mean range between 21.5 and 82.5 years old (mean: 46.5 years; standard deviation: 18.5 years; skewness: 0.42). The age estimation of the Danish samples has been previously assessed using standard methods [27]. The distributions regarding the age-at-death of each population sample are shown in Fig. 1. It should be noted that the histogram for the Danish sample is based on the midpoints of the estimated age-at-death range of each individual. The working sample explicitly concerns individuals with no apparent pathological deformities and at least one endplate of the T12 being intact.
Data collection
The intact upper and lower endplates of the T12 vertebrae were photographed with a Canon EOS 100D camera and a Canon EF 40 mm f/2.8 STM fixed focal length lens. All images were shot from a stationary position with the camera perpendicular to the endplates, which were coplanar with the reference scale as shown in Fig. 2. The photographed endplates were imported in Autodesk 2012 software (Autodesk Inc., California, USA) as scaled raster images, and the coordinates of two two-dimensional (2D) polylines were recorded: 1) one polyline of the external boundary (red) outlining the outside edge of the ring of solid epiphyseal rim including any osteophytes and 2) a second polyline of the internal boundary (blue) separating the epiphyseal rim from the more porous central endplate (Fig. 2). Nine morphometric variables describing the morphological variation of the endplate’s top view surface were calculated from the polyline coordinates. These variables are listed in Table 1 along with their definition and abbreviation.
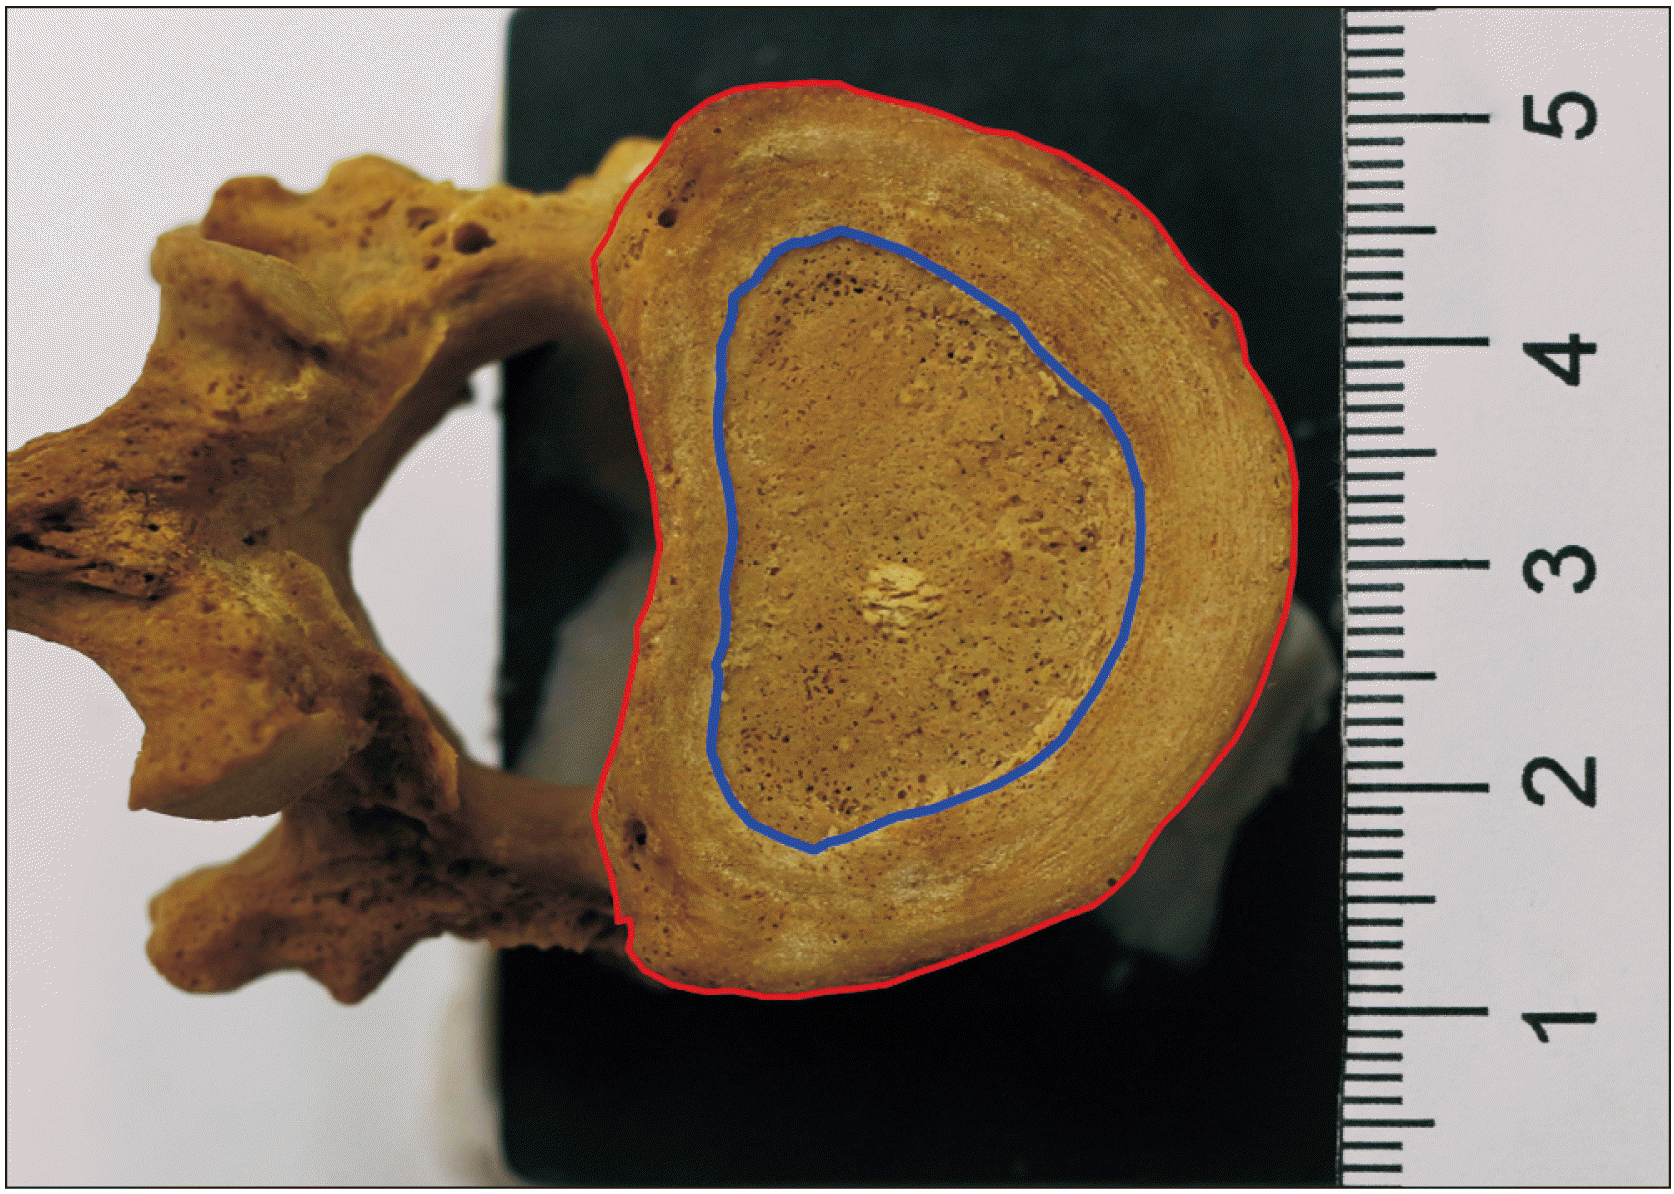
Fig. 2
Polyline tracing of external (red) and internal (blue) endplate boundaries on the endplate’s surface.
![]()
Table 1
List of the morphometric variables evaluated on the lower and upper endplates of T12
| Variable | Abbreviationa | Definition |
|---|---|---|
| Internal area | LiArea/UiArea | The area (in mm2) of the more porous central endplate as circumscribed by the blue outline in Fig. 2. |
| Internal perimeter | LiPer/UiPer | The length (in mm) of the boundary of the more porous central endplate as traced by the blue outline in Fig. 2. |
| External area | LeArea/UeArea | The area (in mm2) of the external boundary of the endplate including any osteophytes as circumscribed by the red outline in Fig. 2. |
| External perimeter | LePer/UePer | The length (in mm) of the external boundary of the endplate including any osteophytes as traced by the red outline in Fig. 2. |
| Internal-external area | LieArea/UieArea | The area (in mm2) of the epiphyseal rim of the endplate as circumscribed by the two outlines in Fig. 2. |
| Internal-external area ratio | LieAreaRatio/UieAreaRatio | The ratio of the area of the epiphyseal rim over the external area of the endplate. |
| Internal area perimeter index | LiArPerIndex/UiArPerIndex | The ratio {x∈R|0<x≤1} of the internal area to the squared internal perimeter multiplied by 4π. It reaches maximum when the circumscribed area is perfectly circular. This is a measure of smoothness of the perimeter of the more porous central endplate (blue outline). |
| External area perimeter index | LeArPerIndex/UeArPerIndex | The ratio {x∈R|0<x≤1} of the external area to the squared external perimeter multiplied by 4π. It reaches maximum when the circumscribed area is perfectly circular. This is a measure of smoothness of the perimeter of the external boundary of the endplate (red outline). |
| Internal-external area perimeter index | LieArPerIndex/UieArPerIndex | The ratio of the area of the epiphyseal rim to the squared external perimeter multiplied by 4π. This is a complementary measure of smoothness of the external boundary of the endplate (red outline). |
![]()
Repeated measurements on both upper and lower endplates of 10 randomly selected vertebrae from the Greek population were performed for evaluating the intra- and inter-observer error by the first author (NG) and the second author (AB).
Data analysis
The intra- and inter-observer errors were evaluated in terms of the relative technical error of measurement (TEM%) for each morphometric variable, as well as its corresponding reliability coefficient R [28]. The expression of sexual dimorphism was also examined for each morphometric variable in both populations. This was done by means of one-way ANOVA or Kruskal-Wallis test according to the assumption of normality, which was tested with Shapiro-Wilk’s test, and effect size estimates ω2 and ε2 were calculated respectively. The correlation between the morphometric variables and age-at-death was explored with generalized additive models (GAMs) separately for males and females due to sexual dimorphism revealed from the previous analysis. All GAMs herein employ a mixed model approach via restricted maximum likelihood (REML) for estimating the smoothing parameter from the available data. Univariate GAMs were developed for every morphometric variable on the Greek population data, initially using the age-at-death as a predictor for the value of individual morphometric variables, hence particular traits of the endplate’s shape, and subsequently using the morphometric variables for predicting age-at-death. Multivariate GAMs were also constructed with selected morphometric variables, separately for the lower and upper endplates. This selection was through trial and error among the best performing univariate GAMs in terms of the higher deviance explained. The best performing multivariate GAMs were finally applied on the Danish population for predicting the age-at-death of each individual, which was cross-validated against the previously assessed age-at-death range estimates.
The statistical analysis including plots and results presented in this work has been implemented in GNU Octave and R programming languages and the entire code base including the raw data (original 2D polyline coordinates and replicates for measurement error) is available at https://doi.org/10.5281/zenodo.5776793. Use the ‘run_analysis.m’ script to reproduce this work from within the GNU Octave environment.
Results
Intra- and inter-observer error results showed the relative TEM is below 1% and the reliability coefficient R is above 0.98 for every variable included in this analysis. This indicates that the measurements extracted from the photographs are very reliable. The shape variables (AreaRatio and ArPerIndex) performed slightly worse than the size variables (perimeter and area), since the former are direct derivatives of the latter and consequently the measurement error accumulates. Detailed values of TEM, TEM%, and R coefficient for intra- and inter-observer repetitive measures per variable are given in supplementary Table 1.
All variables from lower and upper endplates and from each population plotted against age-at-death and colored by sex (blue: males; red: females) are provided in supplementary Figs. 1-4, while variable statistics (mean, standard deviation) per sex are also available in Table 2. The results for sexual dimorphism are summarized in Table 3. All size-related variables, i.e. perimeters and areas, in both populations were found to be sexually dimorphic with male vertebral endplate variables being larger than their female counterparts. It is remarkable, though, that the lower and upper internal ArPerIndex shape variables also exhibited sexual dimorphism in the Danish populations, although this is not true for the Greek population. The two statistically significant cases of LieAreaRatio (P-value: 0.007; ω2: 0.041) and LieArPerIndex (P-value: 0.017; ω2: 0.030) in the Greek sample should not be considered as strong evidence of sexual dimorphism, since their respective effect size is too small and most likely their statistical significance is sample related rather than population representative.
Table 2
Descriptive statistics for each variable for lower and upper endplates
![]()
Table 3
Expression of sexual dimorphism of the lower and upper endplates of T12
![]()
Univariate regression of age-at-death against the morphometric variables of the endplates on the Greek population revealed that the total area of the endplate, the area of the epiphyseal rim, and the amount of shape irregularities of the endplate’s external boundary are mostly affected by age, with the lower and upper endplates as well as males and females following somewhat different patterns. Our results, summarized in Table 4, showed that the morphology of the upper endplate is more correlated with age than the lower endplate, as expressed by the explained deviance and the F-statistic of the respective GAMs. Regarding sex differences, the total area and the perimeter of the endplate (*eArea, *ePer) as well as the shape of the external boundary (*eArPerIndex) are more prominently affected by age in females, whereas the area of the epiphyseal rim and its ratio over the external area, especially on the upper endplate (UieArea, UieAreaRatio), are heavily affected by age in males. All regression models for predicting variables from age-at-death are plotted in supplementary Figs. 5–8. Regressions of selected variables with statistically significant GAMs are shown on Fig. 3 with male and female groups plotted side-by-side. As shown in figure 3, all size-related variables increase with age including the ratio between the endplate’s total area and the central endplate, whereas the external Area-Perimeter Index decreases, manifesting a more irregular shape of the external boundary at older ages. Most notably, the external area and perimeter of both endplates increase continuously in females, whereas in males they remain constant at younger ages before they start increasing after the age of 40. The opposite was observed in the external Area-Perimeter Index, especially of the upper endplate, which appears relatively unaffected by age in young adult females. According to our results, the most consistent pattern observed in both sexes concerned the area of the epiphyseal rim (*ieArea), which gradually increases with age at a similar rate. On the other hand, the ratio of the epiphyseal rim (*ieAreaRatio) is prominently affected by age only in the upper endplate of males (deviance explained 32.3%), whereas in male lower endplate as well as in females the explained deviance was significantly lower (6.7%–12.8%).

Fig. 3
Regression of age against selected morphometric variables with statistically significant models.
![]()
Table 4
Univariate regression with generalized additive models in the Greek population
![]()
The results of the univariate regression of the variables for predicting age with GAMs are also provided in Table 4, while the corresponding regression plots are available in supplementary Figs. 9–12. As expected, they are in accordance with their ‘predict variables from age’ counterparts although to some lesser degree as expressed by the lower explained deviance of these models. These dissimilarities are expected since the majority of the produced GAMs are non-linear. It is important to note, though, that with respect to age prediction the analyzed variables in females can account up to about 31% of the explained deviance regarding the external perimeter of both endplates as well as the external Area-Perimeter Index of the lower endplate. In males, on the other hand, the best age-predicting variables concern the area and ratio of the upper endplate’s epiphyseal rim (UieArea: 30.7% deviance explained; UieAreaRatio: 32.3% deviance explained) followed by the external Area-Perimeter Index of the lower and upper endplates with explained deviance of 26.3% and 22.4% respectively.
The combination of variables for multivariate regression has been explored among the variables with statistically significant univariate regression models and the resulted optimal multivariate GAMs are summarized in Table 5. The best performing multivariate GAM concerns the upper endplate of male individuals explaining more than 46% of the observed variation, whereas the same endplate side albeit with different variables in females yielded the poorest performance with only 32.5% explained deviance. On the lower endplate, females’ GAM outperforms males’ GAM with explained deviance of 41.6% and 38.6% respectively. Conforming with the observations of the univariate results, the area of the epiphyseal rim (*ieArea) is included in all four models, the external Area-Perimeter Index is the next most used predictor, the external perimeter plays an important role only in females, whereas the ratio of the epiphyseal rim’s area (UieAreaRatio) is an effective predictor only in males’ upper endplate.
Table 5
Multivariate Generalized Additive Models and their application on Danish sample
![]()
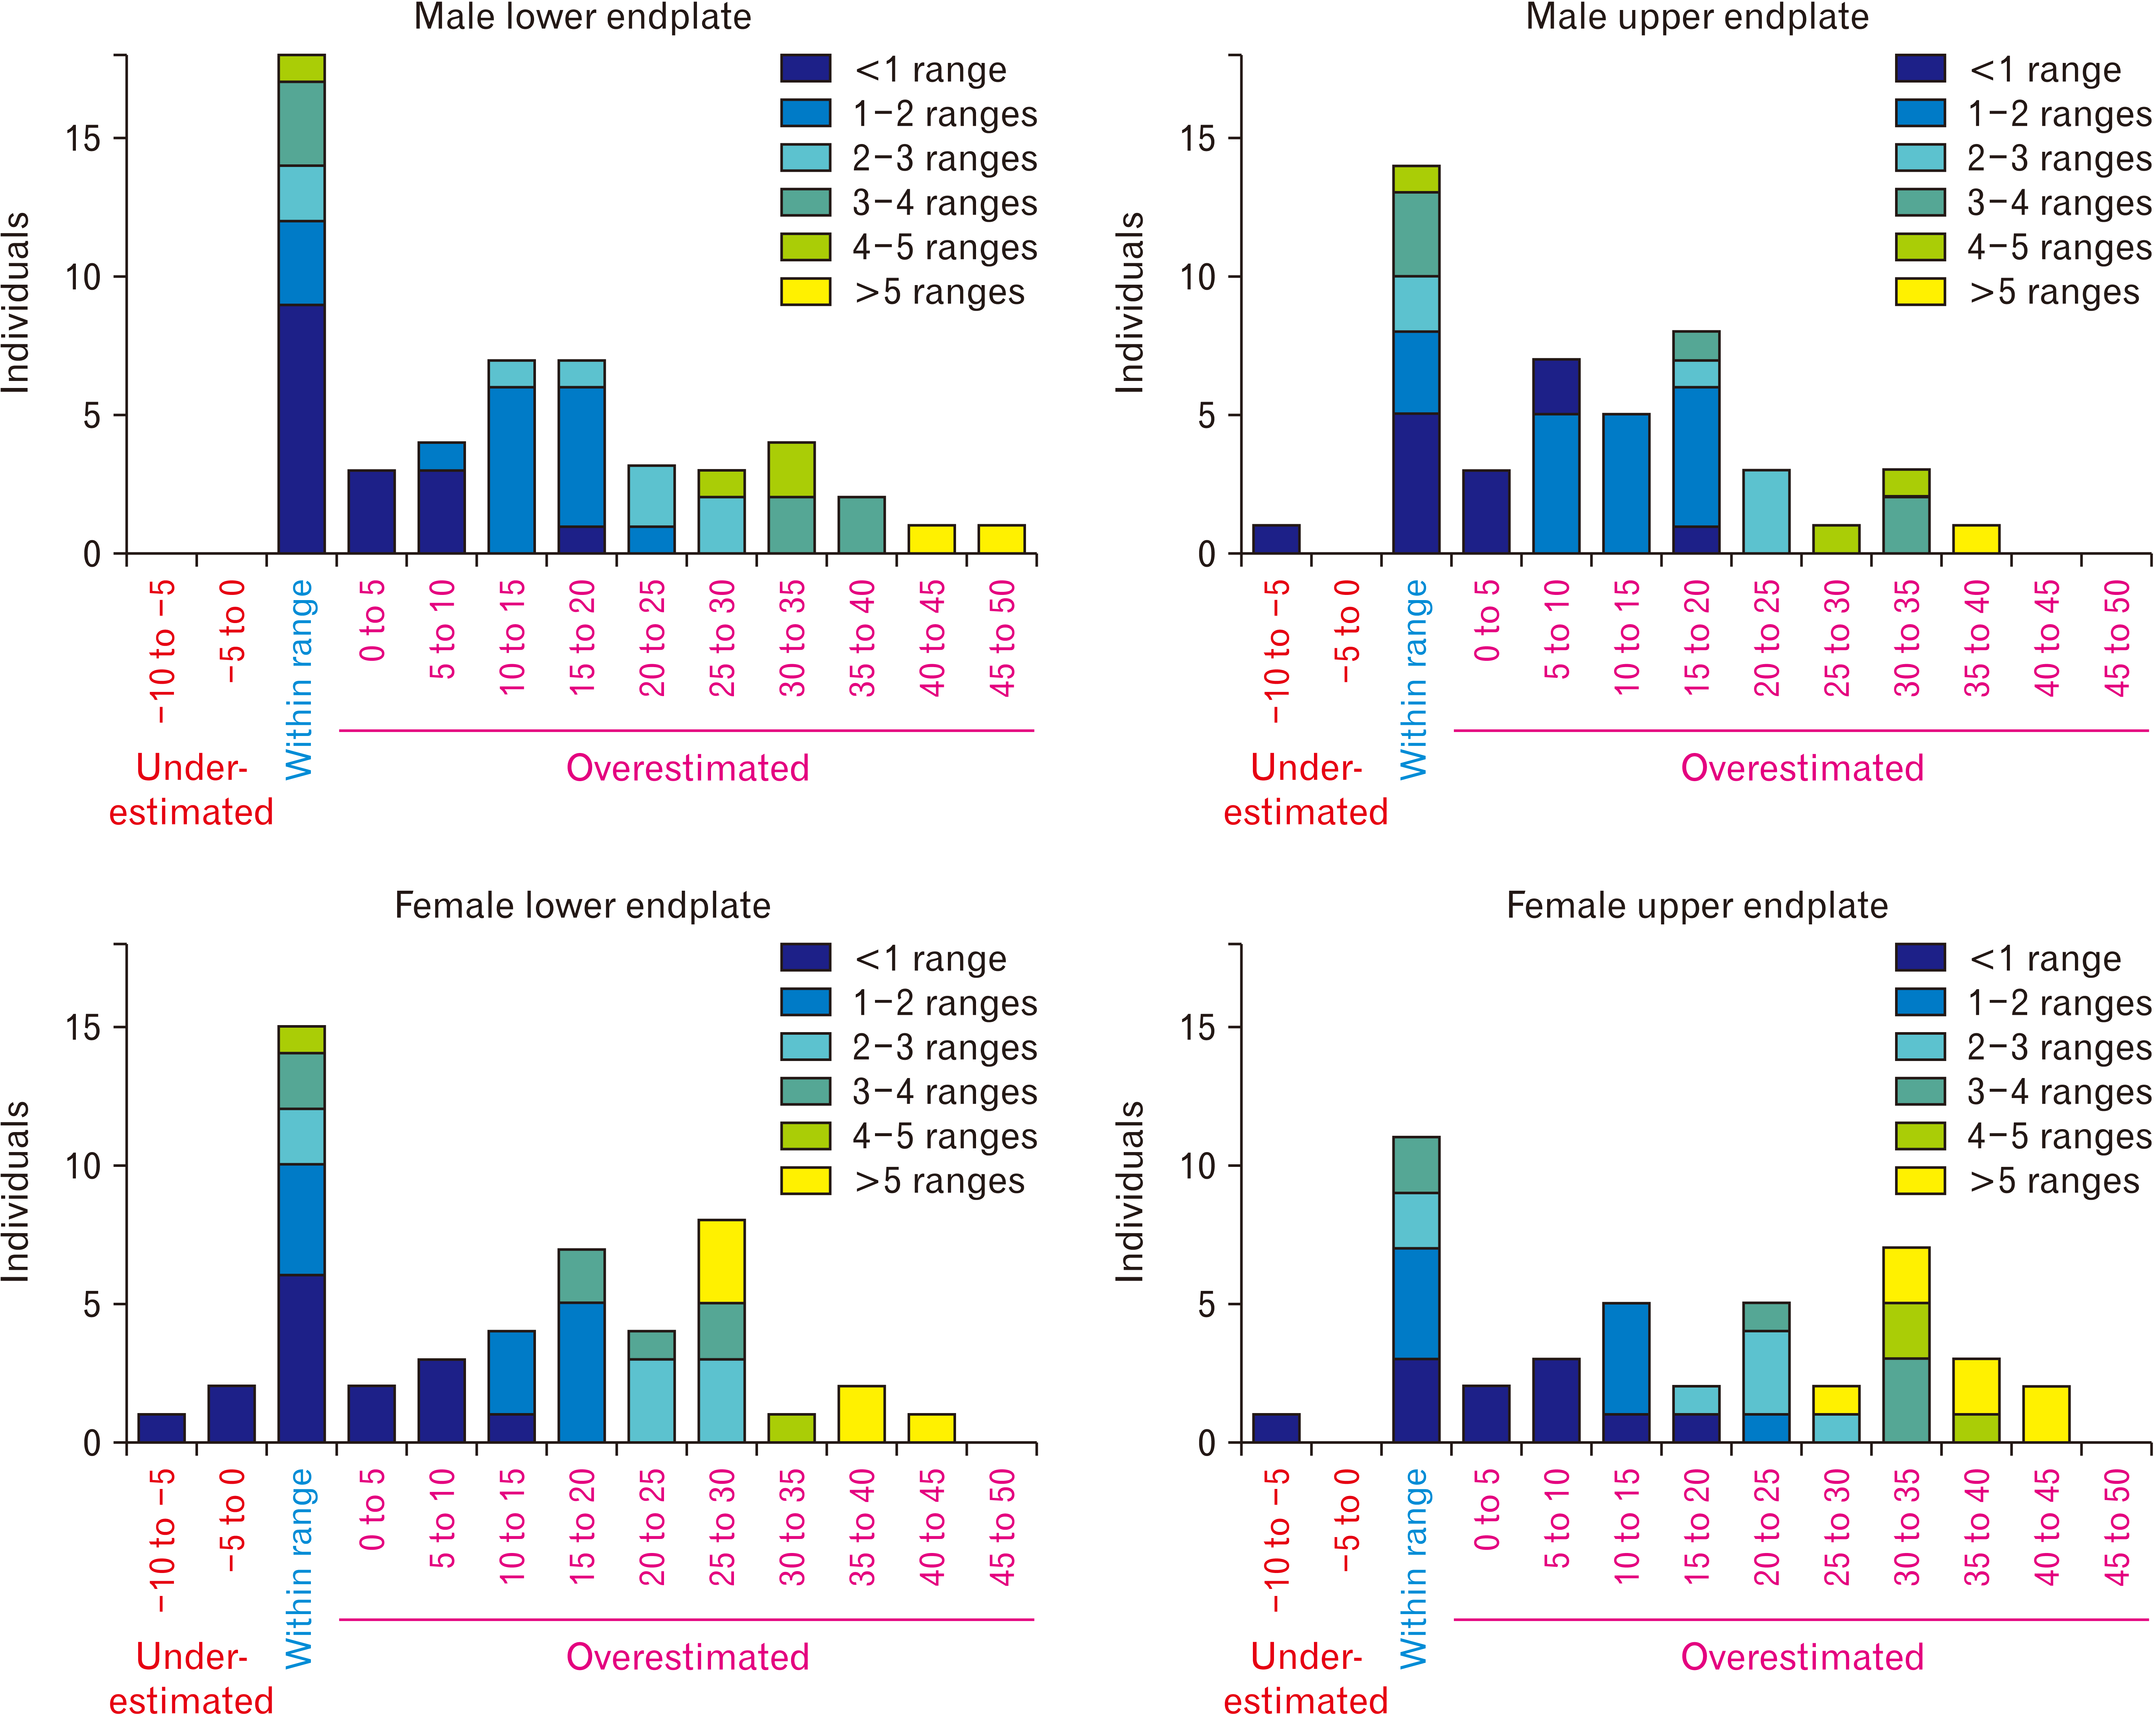
The application of the multivariate GAMs on the archaeological Danish material yielded a correct age prediction rate ranging from 25.6% (female upper endplate) up to 34% (male lower endplate). These results are included in Table 5 as underestimated, within range (correctly predicted), and overestimated individuals for each corresponding multivariate GAM. The majority of the misclassified individuals were overestimated in age compared with the estimated age-at-death ranges, a comparison illustrated in the histograms of Fig. 4. It should be noted that for the correctly estimated (within range) individuals, the colored range maps of the ‘within range’ bar represent the ratio of the distance of predicted age over the mean age range previously estimated osteologically multiplied by a fifth of the estimated age range, whereas the colored range maps of the bars for the under- and over-estimated individuals represent the distance in years between predicted age and the closest margin of the previously estimated age range.
Discussion
The present study introduces a robust and highly reproducible method for quantifying the morphology of the vertebral endplates for exploring correlations with age. Despite certain amount of variation being unaccounted for due to the 2D nature of the captured images and their subsequent post-processing for variable extraction, our method presents significant advantages over previous studies using categorical scoring schemes for vertebral osteophyte formation. Beyond the reliability of the adopted method, as shown by the measurement error results, a major advantage is that the extracted variables are continuous, hence offering a greater flexibility for statistical analysis, especially for exploring correlations with age. This is most prominent with the LeArPerIndex/UeArPerIndex variables that consistently capture and quantify the endplate’s external boundary’s irregularities, which are directly related to the formation of osteophytes. Another advantage is related to the acquired images, which bear the potential for a fully automated variable extraction in future works, although in this study the manual extraction of the polyline coordinates was favored for its simplicity despite its significant labor.
The presence of sexual dimorphism regarding the size-related variables is in accordance with previous findings on the Greek population [29] as well as the well-established fact that males are larger than females, in general. On the other hand, the shape of the endplate and especially its external boundary, which relates to osteophyte formation, does not exhibit differences between males and females. Hence, our results suggest that the processes involved in the formation of osteophytes at the boundaries of the vertebral endplates share the same underlying causes between sexes, such as trauma, congenital diseases, or aging [18]. The only exception is observed in the Danish population and concerns the shape of the boundary of the more porous central endplate (*iArPerIndex), which is sexually dimorphic with considerable estimated effect sizes, although not as much as those observed in the size-related variables such as the area or perimeter of the endplate. Since age-at-death does not have any significant effect on the respective variables (LiArPerIndex, UiArPerIndex) according to our regression results, this exception might be related to differential mechanical loading or growth patterns between males and females of the Danish archaeological population, which in turn may be related to sex division in labor or differences in food consumption and/or health status [30, 31].
The rationale behind using GAMs for investigating the effects of age on the vertebral endplates, including osteophyte formation, is that the age-related processes “driving” the observed changes are not necessarily linear, a fact also corroborated by our results. Furthermore, imposing certain assumptions regarding the expected fitted models would be unreliable, since not much is known on how the age affects the morphology of the vertebral endplates in order to select specific non-linear kernels for our regression models. GAMs, however, allow the computation of the best fit regression model on a dataset solely based on the available data and, most importantly, a mixed model approach via REML for estimating the smoothing parameter provides the appealing balance between flexibility and interpretability [32]. Hence, we argue that GAMs provide the optimal regression analysis tool for modeling the effects of aging on morphometric variables of the vertebral endplates, despite linear regression being regularly employed in relevant works to date [16, 21, 24, 25].
Our results on age-related changes of the vertebral endplates show a positive correlation of osteophyte formation with age-at-death, which is in accordance with previous studies [16, 19]. Interestingly, osteophyte formation in males increases consistently throughout adult life, while in females their development appears to start at a later stage in adult life and increases more rapidly thereafter, an observation more prominent on the upper endplate (Fig. 3). Despite this observation might being sample specific and our results certainly not allowing for any generalization, this differentiation could be attributed to sex differences in labor or habitual activity patterns [33, 34]. Nevertheless, our findings indicate that the effect of aging on osteophyte formation is more prominent in older females rather than males. Accordingly, a more pronounced effect of aging in females is also seen in the size-related variables of external area and perimeter of the endplates, which grow larger as age increases. However, it should be noted that the increase in these variables is most likely related to the formation of osteophytes around the endplate rather than the actual size of the vertebra itself.
The multivariate results confirm a strong correlation between age-at-death and the morphology of the vertebral endplates, as described by the selected morphometric variables and at least for the Greek population, whose sample was employed in this analysis. This correlation is stronger in males than females, which is in accordance with previous works [16, 19]. Most notably, not only the explained deviances of the GAMs differentiate between males and females as well as between upper and lower vertebral endplates, but there are also sex differences in the optimal, i.e. most predictive, variables involved in each GAM. Although there is no apparent explanation as to why females perform better in the lower endplate while males in the upper, it should be noted that osteophyte formation in this work is measured as a 2D planar projection of the endplates outline instead of the typical four-grade scoring system proposed by Watanabe and Terazawa [18]. Hence, our results are not directly comparable to earlier works and the different osteometric approach adopted in this work may well produce different patterns. Moreover, the observed sex differences in the multivariate GAMs could just be specific to the Greek population, in which aging has a more pronounced effect on the lower endplate of females rather than males, while, on the contrary, the upper endplate of males is more affected by age than in females. This distinct pattern is also corroborated by our univariate regression results (Table 3). Nevertheless, the here proposed method for quantifying the endplate morphology, including the degree of osteophyte formation, provides a consistent platform for inferring age-at-death albeit with limited predictive power as demonstrated by the application of multivariate GAMs on the archaeological Danish sample, in which about one third of the sample was accurately predicted within range, while the majority of the remaining sample was overestimated. Taking into account the possible population differences between the referenced modern Greeks and the archaeological medieval Danes and the fact that our results rely on osteological age estimates for the latter, we argue that the proposed method could provide an age-estimation framework for bioarchaeological settings, but only in the concept of broader age ranges, such as discriminating between young and old adults.
Conclusion
Our proposed method for reliably capturing the morphological variation of the vertebral endplates, including osteophytosis, in a continuous manner revealed a significant positive correlation between age-at-death and the morphology of the vertebral endplates of T12 tied to the formation of osteophytes. The observed correlation was stronger in males than females in the Greek population, with the latter developing osteophytes at later stages in adult life, possibly due to sex differences in labor or other habitual activity patterns. The developed multivariate GAMs showed differences in predicting age-at-death between the two sexes, as well as between the upper and lower endplates. However, from a forensic and bioarchaeological perspective, their maximum explained deviance on the Greek population as well as their application on the archaeological Danish sample showed low to moderate capacity in age-at-death estimation. Based on our results, we argue that the proposed method conveys certain merits in age-estimation frameworks, especially in distinguishing between younger and older adults, when more informative age markers are unavailable.
 XML Download