Journal List > Ann Lab Med > v.43(3) > 1516080659

van der Stam, Bouwmeester, van Loon, van Riel, Dekker, Boer, Houthuizen, and Scharnhorst: Prognostic Value of Combined Biomarkers in Patients With Heart Failure: The Heartmarker Score

Abstract

Background

Heart failure (HF) biomarkers have prognostic value. The aim of this study was to combine HF biomarkers into an objective classification system for risk stratification of patients with HF.

Methods

HF biomarkers were analyzed in a population of HF outpatients and expressed relative to their cut-off values (N-terminal pro-B-type natriuretic peptide [NT-proBNP] >1,000 pg/mL, soluble suppression of tumorigenesis-2 [ST2] >35 ng/mL, growth differentiation factor-15 [GDF-15] >2,000 pg/mL, and fibroblast growth factor-23 [FGF-23] >95.4 pg/mL). Biomarkers that remained significant in multivariable analysis were combined to devise the Heartmarker score. The performance of the Heartmarker score was compared to the widely used New York Heart Association (NYHA) classification based on symptoms during ordinary activity.

Results

HF biomarkers of 245 patients were analyzed, 45 (18%) of whom experienced the composite endpoint of HF hospitalization, appropriate implantable cardioverter-defibrillator shock, or death. HF biomarkers were elevated more often in patients that reached the composite endpoint than in patients that did not reach the endpoint. NT-proBNP, ST2, and GDF-15 were independent predictors of the composite endpoint and were thus combined as the Heartmarker score. The event-free survival and distance covered in 6 minutes of walking decreased with an increasing Heartmarker score. Compared with the NYHA classification, the Heartmarker score was better at discriminating between different risk classes and had a comparable relationship to functional capacity.

Conclusions

The Heartmarker score is a reproducible and intuitive model for risk stratification of outpatients with HF, using routine biomarker measurements.

INTRODUCTION

In current clinical practice, the New York Heart Association (NYHA) classification is widely used to classify patients with heart failure (HF) according to their symptoms [1]. The NYHA classification provides a simple method of classifying the severity of HF and has also been adopted in the European Society of Cardiology (ESC) HF guidelines [2], which emphasize the importance of prognostic stratification. The NYHA classification system is subjective, poorly reproducible, and difficult to follow over time, as patients might restrict their activities with worsening HF, potentially leading to false improvement. This classification also has limited predictive power [3-7]. There is a need for a new method of objective risk stratification of patients with HF.
Biomarkers are attractive candidates for risk stratification, because they are objective and reproducible. In addition to well-established natriuretic peptides [7-9], several novel HF biomarkers have been reported to have prognostic value [10-17]. Soluble suppression of tumorigenesis-2 (ST2) expression is associated with cardiac remodeling and fibrosis. Growth differentiation factor-15 (GDF-15) is related to apoptosis, and its expression is induced in cardiomyocytes that experience metabolic stress. Fibroblast growth factor-23 (FGF-23) is associated with left ventricular hypertrophy [18-20]. As these biomarkers are linked to different pathways in HF, they may have independent and synergistic prognostic value.
Apart from its prognostic value, the NYHA classification is associated with functional capacity, as an increase in NYHA class is associated with a decrease in the distance covered during 6 min of walking [21]. The HF biomarker N-terminal pro-B-type natriuretic peptide (NT-proBNP) also correlates with the 6-min walking distance in patients with left ventricular systolic dysfunction, indicating that a score based on multiple HF biomarkers could also be associated with functional capacity [22].
We aimed to evaluate the prognostic value of a new stratification and risk score based on combined HF biomarkers and its relationship with functional capacity in an unselected cohort of outpatients with HF with reduced ejection fraction (HFrEF), mildly reduced ejection fraction (HFmrEF), or preserved ejection fraction (HFpEF). The HF biomarker-based risk score was further compared to the routinely used NYHA classification.

MATERIALS AND METHODS

Study design

The Heart Failure Classification (HaFaC) trial (https://trialsearch.who.int/Trial2.aspx?TrialID=NTR7466) is a prospective, non-randomized, observational, single-center study conducted in a tertiary hospital (Catharina Hospital Eindhoven, the Netherlands) that aims to develop objective data-based classification of HF patients. The ethics committee and local institutional review board (Medical Research Ethics Committees United, the Netherlands, study number NL60579.100.17) approved the study.

Population

From December 2017 to September 2019, patients referred to the echocardiography laboratory with suspected or known HF, based on ESC guidelines, were prospectively included in the study. Patient eligibility was assessed by an experienced cardiologist. Inclusion criteria were aged ≥18 years and willing and able to provide written informed consent. Exclusion criteria were recent cardiothoracic surgery (≤90 days) or pregnancy. Prior to data analysis, patients without structural and/or functional cardiac abnormalities or for whom one of the biomarkers could not be measured for practical reasons were excluded [23]. Of the 610 patients that were contacted to screen for eligibility to participate in the trial, 278 patients with (suspected) HF who were referred to the echocardiography lab were enrolled; patients were not enrolled if no member of the study team was available, the patient could not be reached in time to mail out the patient information folder, the patient was already enrolled in another trial, or the patient declined to participate. Thirty-three patients were excluded from the analysis because of either the absence of HF (N=25) or a missing biomarker value (N=8), leaving 245 patients included in the analysis. The remaining patients were diagnosed as having HFrEF (left ventricular ejection fraction [LVEF] ≤40%), HFmrEF (LVEF 41%–49%), and HFpEF (LVEF ≥50%).

Data collection

At the baseline visit, all patients underwent a comprehensive transthoracic echocardiographic examination using commercially available equipment (Philips iE33 or Philips EPIQ, Andover, MA, USA). Standard 2D and Doppler echocardiographic measurements were performed following American Society of Echocardiography (ASE)/European Association of Cardiovascular Imaging (EACVI) guidelines [24]. LVEF was calculated using the modified biplane Simpson’s rule [24]. Blood samples were collected directly after echocardiographic examination while the patient was still in the supine position. NT-proBNP levels were determined routinely at the Department of Clinical Chemistry (Elecsys pro B-Type Natriuretic Peptide [BNP] II assay; Roche Diagnostics, Mannheim, Germany). The measurements of ST2 (SEQUENT-IA ST2 Assay, Critical Diagnostics, San Diego, CA, USA), GDF-15 (Elecsys GDF-15 assay, Roche Diagnostics, Mannheim, Germany), and FGF-23 (LIAISON FGF 23 assay, DiaSorin, Saluggia, Italy) were conducted as batch tests according to the manufacturer instructions. The functional status of HF patients was objectively assessed via the 6-minute walking test (6MWT) [25, 26] during the baseline visit, performed on a standardized 10-m course in the corridor. The baseline NYHA classification determined by the attending physicians was used for comparison [2].

Follow-up

Information on HF hospitalization and appropriate implantable cardioverter-defibrillator (ICD) shocks during the 1-year follow-up period was obtained through a systematic review of the medical records. Data on all-cause mortality during the 1-year follow-up period were collected from the Dutch Civil Registry. The primary outcome was a composite of hospitalization for HF, appropriate ICD shock, or death.

Statistical analysis

Baseline characteristics are expressed as medians and interquartile ranges (IQRs) in the case of numerical data or as counts and percentages in the case of binominal data. Comparisons between groups were made using the Mann–Whitney U test for numerical data and Fisher’s exact test for binominal data.
Biomarker values were converted into binominal values based on whether the patient’s laboratory results exceeded the established cut-off value obtained from the literature: NT-proBNP >1,000 pg/mL (conversion*0.118 for pmol/L), ST2 >35 ng/mL, GDF-15 >2,000 pg/mL, and FGF-23 >95.4 pg/mL [15, 27, 28] [manufacturer’s instructions, LIAISON FGF 23 assay, DiaSorin, Saluggia, Italy]. Univariate and multivariate Cox regression analyses were performed, and hazard ratios (HRs) and 95% confidence intervals (CIs) were calculated. The combined “Heartmarker score” was calculated based on the number of biomarkers for which the patient exceeded the stated threshold; only variables that remained significant in the multivariate analyses were included. Kaplan–Meier survival curves were plotted to compare event-free survival over the 1-year follow-up period according to the Heartmarker score and NYHA class. Pairwise comparisons between groups in the Kaplan–Meier curves were performed using log-rank tests with the Benjamin and Hochberg correction. The distance covered in the 6MWT is presented in boxplots, and significant differences in distance across different classification levels were assessed using the Kruskal–Wallis rank-sum test. For all comparisons, P<0.05 was considered statistically significant. All analyses were performed using R version 4.0.5 and RStudio 1/2/1335 (R Foundation for Statistical Computing, Vienna, Austria; RStudio Inc., Boston, MA, USA).

RESULTS

Patient characteristics

Of the 245 patients, 45 (18%) experienced at least one of the events in the composite endpoint (ICD shock [N=3], hospital admission due to HF [N=38], death [N=16]) within the 1-year follow-up period. The patient characteristics are shown in Table 1. The study population had a median age of 70 (IQR 61–76) years, the median body mass index (BMI) was 26 (IQR 24–30) kg/m2, and the majority of the patients were male (70%). The population included patients with all three subtypes of HF: HFrEF (42.45%), HFmrEF (35.10%), and HFpEF (22.45%). The largest proportion of patients had an NYHA classification of II (40%), while only a small proportion had an NYHA class of IV (3%).
Table 1 also includes a statistical comparison of patients who did and did not reach the composite endpoint. Patients who did experience the composite endpoint had a lower LVEF than those who did not experience the composite endpoint (33% vs. 45%, P<0.01). A significantly larger proportion of patients who reached the composite endpoint had HFrEF (P<0.01), and a significantly smaller proportion had HFmrEF (P=0.02). A significantly smaller proportion of patients who experienced the composite endpoint had an NYHA class of I (P<0.01), and a significantly larger proportion of patients who reached the composite endpoint had an NYHA class of III (P<0.01). A higher proportion of patients who reached the composite endpoint suffered from diabetes (38% vs. 11%, P<0.01) and had a lower estimated glomerular filtration rate (eGFR), expressed as the Chronic Kidney Disease Epidemiology Collaboration (CKD-EPI) score (68% vs. 53%, P<0.01) compared with those who did not reach the endpoint.

Prognostic value of individual and combined biomarkers

As shown in Table 1, the levels of all four biomarkers were significantly higher in patients who experienced the composite endpoint. Consequently, the percentage of patients with HF biomarkers above the cut-off values was significantly higher in the group that reached the composite endpoint (NT-proBNP: 78% vs. 31%, P<0.01; GDF-15: 73% vs. 34%, P<0.01; ST-2: 31% vs. 6%, P<0.01; FGF-23: 42% vs. 20%, P<0.01). Table 2 shows the predictive value of these biomarkers when interpreted against biomarker-specific cut-off values. All biomarkers had a positive HR, with the highest HR found for NT-proBNP (6.5, 95% CI: 3.2–13.2) and the lowest found for FGF-23 (2.7, 95% CI: 1.5–4.8). In the multivariate analysis, NT-proBNP, GDF-15, and ST2 remained significant, and FGF-23 did not have a significant contribution to predicting the composite endpoint.
As the predictive power of FGF-23 was also captured by the other three biomarkers, we subsequently analyzed whether a combination of the remaining three biomarkers could predict adverse outcomes. The survival curves for the three biomarkers are shown in Fig. 1A. By simply counting the number of biomarkers for which a patient exceeded the predefined cut-off value in the Heartmarker score, the patients were classified into four groups according to whether or not they exceeded the cut-off for 0, 1, 2, or 3 biomarkers (0: N=101, 1: N=81, 2: N=45, 3: N=18). As shown in Fig. 1B, one-third of the patients (N=81) had only one biomarker that exceeded the cut-off, which was most often GDF-15 (48%) or NT-proBNP (47%). In 18% of the patients (N=45), two biomarkers exceeded the cut-offs; all patients in this group had elevated GDF-15 levels, which were combined with either an NT-proBNP (91%) or ST2 (9%) level above the cut-off.
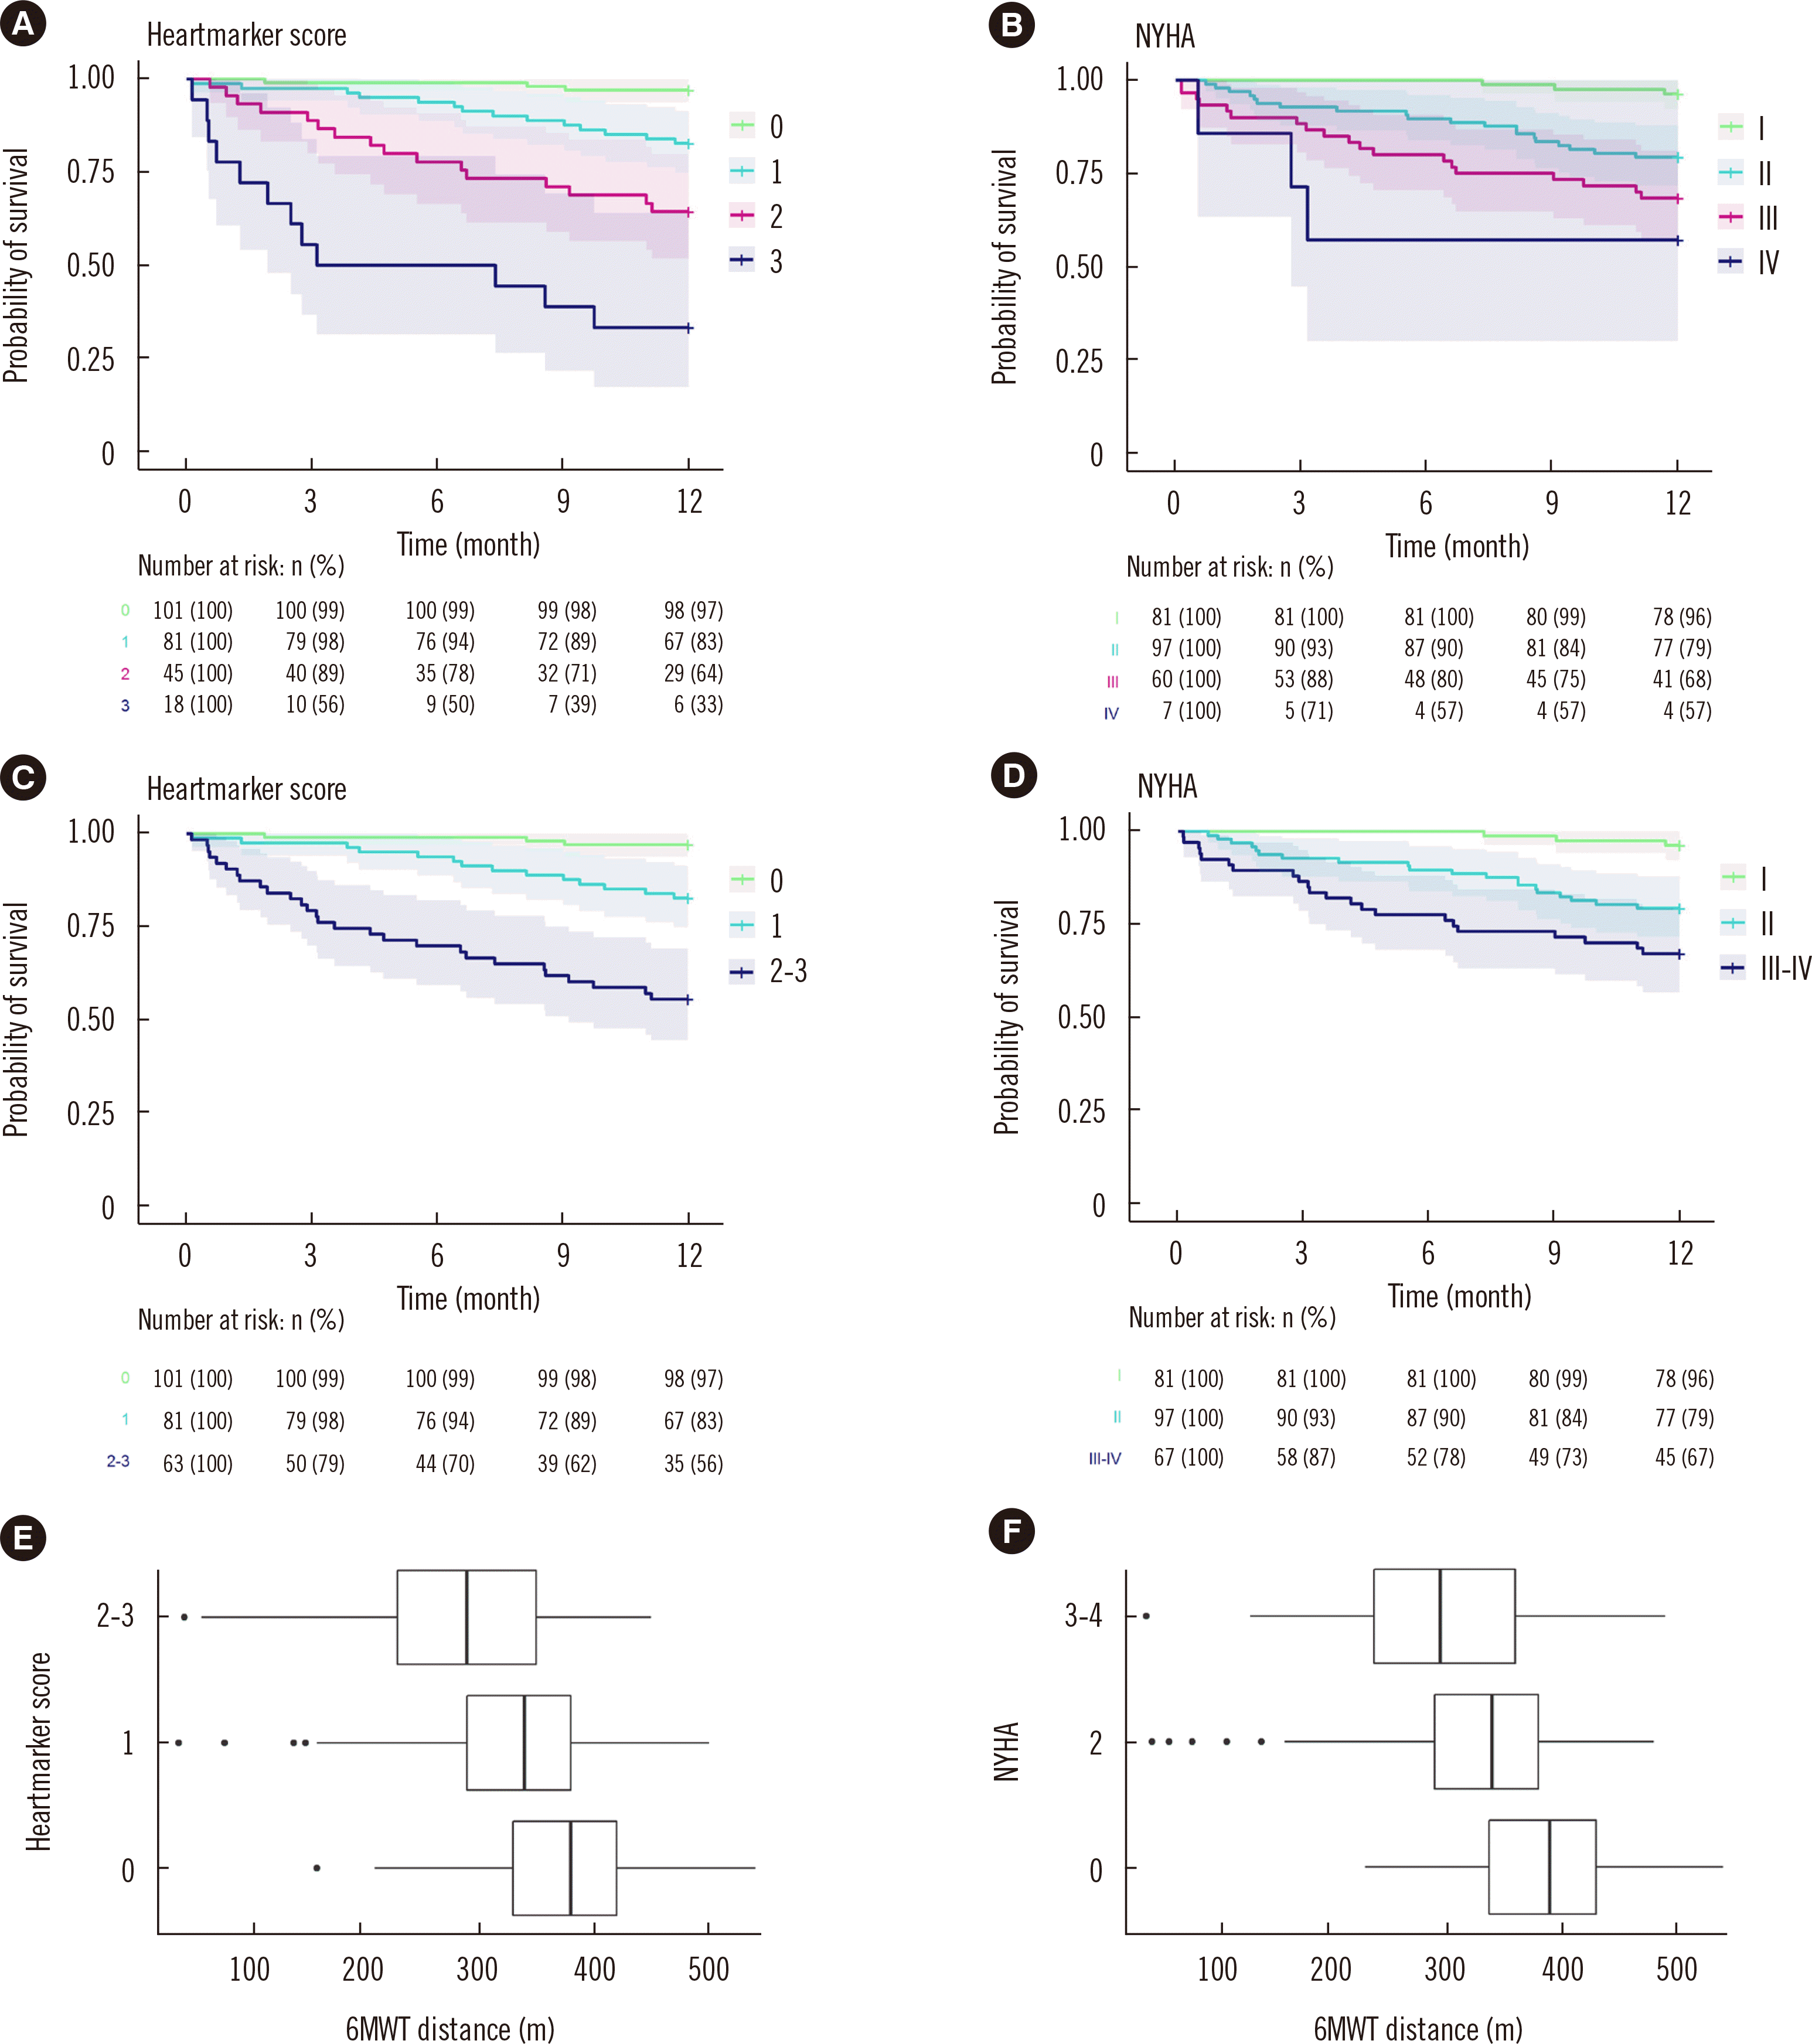
The survival curves according to different Heartmarker score levels are shown in Fig. 2A. The percentage of patients who did not experience the composite endpoint within the 1-year follow-up period decreased from 97% in patients without any elevated biomarkers (score 0) to 33% in patients for whom all three biomarkers (score 3) exceeded the cut-off values. Survival curves of the Heartmarker scores for the different HF subgroups are shown in Supplemental Data Fig. S1.

Prognostic value of the NYHA classification

Fig. 2B shows the survival curves for the NYHA classification. The percentage of patients who did not experience the composite endpoint within the 1-year follow-up period decreased from 96% for the patients with NYHA class I to 57% for patients with NYHA class IV.

Comparison of the classifications

Although NYHA class IV and Heartmarker score 3 seem to have good predictive ability of adverse outcomes, the number of patients in these categories was low. Therefore, the two highest groups were combined, resulting in a group with a Heartmarker score of 2–3 and NYHA class III–IV. The resulting survival curves are shown in Fig. 2C and D. Pairwise comparisons using log-rank tests showed significant differences between the different biomarker classes but no significant difference between NYHA II and NYHA III–IV (Heartmarker: 0 vs. 1, P<0.01; 0 vs. 2–3, P<0.01; 1 vs. 2–3, P<0.01; NYHA: 1 vs. 2, P<0.01; 1 vs. 3–4, P<0.01; 2 vs. 3–4, P=0.06).
To assess how well the NYHA classification and Heartmarker score reflected the current cardiac performance of the HF patients in this cohort, the distance covered in the 6MWT was used. NYHA class and biomarker scores showed a similar association with the distance covered in the 6MWT (Fig. 2E and F). The higher the NYHA class, the lower the distance that patients could cover in 6 min of walking, with a median of 390 m for NYHA I, 340 m for NYHA II, and 295 m for NYHA III–IV (P<0.01). Similarly, a higher Heartmarker score corresponded to a lower distance, with a median of 380 m for 0 elevated biomarkers, 340 m for 1 elevated biomarker, and 290 m for 2–3 elevated biomarkers (P<0.01).

DISCUSSION

Discriminating between different risk levels in patients with HF is of great importance as it allows healthcare providers to proactively identify patients at risk for poor outcomes. Patients with a high risk of unplanned hospital admission, ICD shock, or death could benefit from closer follow-up, which might not be needed for low-risk patients. Improved risk stratification could aid in the management of patients’ expectations regarding their prognosis and could trigger a clinician to consider referral to more advanced HF centers or alternative treatments.
In current clinical practice, the NYHA classification is widely used to classify patients with HF, including as an enrollment criterion and outcome measure in clinical trials [6], or in guidelines where medication, therapy, and referral to an advanced HF center are recommended depending on the NYHA classification [2]. However, the NYHA classification relies on the physician’s interpretation of “ordinary physical activity” and “slight limitations,” making the classification subjective and challenging. This subjectivity is likely the cause of the poor reproducibility of the NYHA class assignment of only 56% [4]. Classification based on biomarkers could aid physicians in assessing patients in a more objective and reproducible manner.
The proposed Heartmarker score combines NT-proBNP, ST2, and GDF-15 elevations above their cut-off values into a simple and intuitive classification. All three biomarkers remained significant in multivariable analysis, indicating added predictive value for the more novel HF biomarkers ST2 and GDF-15, in addition to the predictive value of the validated and widely used biomarker NT-proBNP. Classification using the Heartmarker score would result in a significantly lower percentage of patients with 2–3 elevated biomarkers compared to classification based solely on elevated NT-proBNP, allowing for more intensive follow-up of a more select high-risk group. As significant differences between the Heartmarker classes were found, the score based on combined biomarkers was able to discriminate between multiple risk levels in the cohort of patients with HF. The prognosis of HF has been linked to the widely used NYHA class; however, its prognostic value was found to be limited in several studies [5, 7]. In the present trial, patients without any symptoms (NYHA I) were less likely to experience the composite endpoint than those with slight to severe limitation of physical activity (NYHA II–IV). As no significant difference between NYHA II and NYHA III/IV was found, the new combined biomarker classification was able to discriminate between more, significantly different, risk classes.
In addition to its prognostic value, an HF classification model should capture the current functional status of patients with HF. The distance covered during the 6MWT decreased with increasing Heartmarker score and NYHA class. The decreasing median distance with increasing NYHA class matches the association reported in the literature [21]. The comparable correlation of the Heartmarker score to walking distance indicates that it can capture the functional status of patients with HF in a similar manner as the NYHA classification. As the proposed Heartmarker score correlates with functional capacity and can discriminate between multiple levels of risk of negative outcomes, it could be a valuable tool for the objective classification of HF patients.
The predictive values of GDF-15 and ST2 have been assessed in different cohorts. Kempf, et al. [15] described the prognostic value of GDF-15 levels in a cohort of patients with chronic HF. They found a slightly higher percentage of patients who exceeded the 2,000 pg/mL cut-off level (48% vs. 42%). Ky, et al. [28] described the prognostic value of ST2 in patients with chronic HF, and their cohort showed higher ST2 values (36.3 ng/mL in one-third of the patients) than those in the present cohort with only 11% of the patients exceeding an ST2 level of 35 ng/mL. As both previous studies only included all-cause mortality in their survival analyses, the exact survival percentages could not be compared to our composite endpoint of event-free survival. Kuster, et al. [29] identified ST2 as a predictor of 1-year mortality and GDF-15 as a significant predictor for 1- to 5-year follow-up. Owing to the unavailability of information about hospitalization during the follow-up period, the predictive value with respect to HF admission in their cohort could not be assessed. We confirmed the prognostic value of ST2 at the 1-year follow-up and confirmed the prognostic value of GDF-15 for the composite endpoint at the 1-year follow-up. Gaggin, et al. [14] studied HF biomarkers in patients with HFrEF and NYHA classes II–IV. Their biomarker selections included ST2 and GDF-15, which had independent predictive values. Adding HF biomarkers to the baseline model improved the performance. The present study also included HFmrEF, HFpEF, and NYHA I, showing the predictive values of ST2 and GDF-15 in an unselected cohort of HF patients and in patients without symptoms. Grande, et al. [30] proposed a biomarker score combining NT-proBNP, ST2, and galectin3 in a population consisting mainly of HFrEF patients (73%). Compared to these results, the combination of NT-proBNP, ST2, and GDF-15 used in the present study showed a higher percentage of event-free survival for the Heartmarker score 0 class and a lower percentage of event-free survival for the Heartmarker score 3 class.
In addition to biomarker-based classifications, previous models that combine biomarkers with patient characteristics, prescribed medication, and NYHA classification have been proposed, such as the MAGGIC model and Seattle Heart Failure Model [31, 32]. Although these models demonstrated prognostic value in the HF population, the present work adds to the existing literature as it only incorporates HF biomarkers that can be objectively and automatically assessed from laboratory analysis, allowing for easy calculation and implementation in laboratory systems.
The strengths of the present study include its real-world study population consisting of a cohort of patients referred to the echocardiography laboratory without selection for a specific subtype of HF. Established cut-offs for the three biomarkers based on the literature were used, and the cut-offs were thus not tailored to this specific study population. The results of this study can thus be applied to other HF populations. We also evaluated the performance of the classifications for both prognostic value and functional capacity expressed by walking distance. Although assessing a patient’s functional status and discussing complaints during activity remains important, we believe that the proposed objective laboratory-based classification system can provide an additional tool for estimating the severity of HF.
This study had a limited number of patients with the highest levels of classification, requiring the combination of NYHA III and IV classes and Heartmarker scores of 2 and 3. The cohort of patients with HF was relatively healthy as the number of patients who experienced the combined endpoint was relatively low. However, this population reflects the HF population at a tertiary hospital in the Netherlands. Due to the relatively low event rate in the outpatient population, the incorporation of other clinical parameters was not possible. Future studies in a larger study population should explore the combination of HF biomarkers and other clinical variables.
Counting the number of elevated biomarkers (NT-proBNP, ST2, and GDF-15) can serve as an intuitive model for the risk stratification of outpatients with HF. Compared with the NYHA classification, the Heartmarker score is better at discriminating between different risk classes and has a comparable correlation with functional capacity, expressed as the 6MWT distance. As the Heartmarker score can be calculated automatically from the results of standardized biomarker assays, it provides a reproducible and objective tool for the classification of patients with HF.

Supplemental Materials

ACKNOWLEDGMENTS

None.

Notes

AUTHOR CONTRIBUTIONS

van der Stam J: Conceptualization, Methodology, Formal analysis, Investigation, Visualization, Project administration, Data curation, Writing—Original draft. Bouwmeester S: Conceptualization, Methodology, Formal analysis, Investigation, Resources, Data curation, Writing—Original draft. van Loon S: Conceptualization, Data curation, Funding acquisition, Investigation, Writing—Review and Editing. Van Riel N: Conceptualization, Methodology, Supervision, Writing—Review and Editing. Dekker L: Investigation, Resources, Supervision, Writing—Review and Editing. Boer AK: Conceptualization, Methodology, Resources, Supervision, Writing—Review and Editing. Houthuizen P: Conceptualization, Investigation, Resources, Supervision, Writing—Review and Editing. Scharnhorst V: Conceptualization, Funding acquisition, Methodology, Resources, Supervision, Writing—Review and Editing.

CONFLICTS OF INTEREST

Some reagents for laboratory analysis were provided free of charge by Roche Diagnostics Nederland BV. Volkher Scharnhorst incidentally acts as a clinical consultant on advisory boards for Roche Diagnostics Nederland BV, and the associated fees are paid to the hospital.

RESEARCH FUNDING

The trial was partly financed by a grant from the Netherlands Enterprise Agency (Grant No: RVO ITEA 161006) and a grant from the Catharina Research Fund.

REFERENCES

1. New York Heart Association. 1994. Criteria Committee. Nomenclature and criteria for diagnosis of diseases of the heart and great vessels. 9th ed. Little Brown;Boston:
2. McDonagh TA, Metra M, Adamo M, Gardner RS, Baumbach A, Böhm M, et al. 2021; 2021 ESC Guidelines for the diagnosis and treatment of acute and chronic heart failure. Eur Heart J. 42:3599–726. DOI: 10.1093/eurheartj/ehab368. PMID: 34447992.
3. Goldman L, Cook EF, Mitchell N, Flatley M, Sherman H, Cohn PF. 1982; Pitfalls in the serial assessment of cardiac functional status. How a reduction in 'ordinary' activity may reduce the apparent degree of cardiac compromise and give a misleading impression of improvement. J Chronic Dis. 35:763–71. DOI: 10.1016/0021-9681(82)90087-X. PMID: 7119078.
4. Goldman L, Hashimoto B, Cook EF, Loscalzo A. 1981; Comparative reproducibility and validity of systems for assessing cardiovascular functional class: advantages of a new specific activity scale. Circulation. 64:1227–34. DOI: 10.1161/01.CIR.64.6.1227. PMID: 7296795.
crossref
5. Caraballo C, Desai NR, Mulder H, Alhanti B, Wilson FP, Fiuzat M, et al. 2019; Clinical implications of the New York Heart Association classification. J Am Heart Assoc. 8:e014240. DOI: 10.1161/JAHA.119.014240. PMID: 31771438. PMCID: PMC6912957.
crossref
6. Raphael C, Briscoe C, Davies J, Ian Whinnett Z, Manisty C, Sutton R, et al. 2007; Limitations of the New York Heart Association functional classification system and self-reported walking distances in chronic heart failure. Heart. 93:476–82. DOI: 10.1136/hrt.2006.089656. PMID: 17005715. PMCID: PMC1861501.
crossref
7. Spinar J, Spinarova L, Malek F, Ludka O, Krejci J, Ostadal P, et al. 2019; Prognostic value of NT-proBNP added to clinical parameters to predict two-year prognosis of chronic heart failure patients with mid-range and reduced ejection fraction-A report from FAR NHL prospective registry. PLoS One. 14:e0214363. DOI: 10.1371/journal.pone.0214363. PMID: 30913251. PMCID: PMC6435170.
8. Gardner RS, Özalp F, Murday AJ, Robb SD, McDonagh TA. 2003; N-terminal pro-brain natriuretic peptide. A new gold standard in predicting mortality in patients with advanced heart failure. Eur Heart J. 24:1735–43. DOI: 10.1016/j.ehj.2003.07.005. PMID: 14522568.
crossref
9. Kang SH, Park JJ, Choi DJ, Yoon CH, Oh IY, Kang SM, et al. 2015; Prognostic value of NT-proBNP in heart failure with preserved versus reduced EF. Heart. 101:1881–8. DOI: 10.1136/heartjnl-2015-307782. PMID: 26319121.
crossref
10. Poelzl G, Trenkler C, Kliebhan J, Wuertinger P, Seger C, Kaser S, et al. 2014; FGF23 is associated with disease severity and prognosis in chronic heart failure. Eur J Clin Invest. 44:1150–8. DOI: 10.1111/eci.12349. PMID: 25294008.
crossref
11. Koller L, Kleber ME, Brandenburg VM, Goliasch G, Richter B, Sulzgruber P, et al. 2015; Fibroblast growth factor 23 is an independent and specific predictor of mortality in patients with heart failure and reduced ejection fraction. Circ Heart Fail. 8:1059–67. DOI: 10.1161/CIRCHEARTFAILURE.115.002341. PMID: 26273098.
crossref
12. Roy C, Lejeune S, Slimani A, de Meester C, Ahn As SA, Rousseau MF, et al. 2020; Fibroblast growth factor 23: a biomarker of fibrosis and prognosis in heart failure with preserved ejection fraction. ESC Heart Fail. 7:2494–507. DOI: 10.1002/ehf2.12816. PMID: 32578967. PMCID: PMC7524237.
crossref
13. Mendez Fernandez AB, Ferrero-Gregori A, Garcia-Osuna A, Mirabet-Perez S, Pirla-Buxo MJ, Cinca-Cuscullola J, et al. 2020; Growth differentiation factor 15 as mortality predictor in heart failure patients with non-reduced ejection fraction. ESC Heart Fail. 7:2223–9. DOI: 10.1002/ehf2.12621. PMID: 32589369. PMCID: PMC7524215.
crossref
14. Gaggin HK, Szymonifka J, Bhardwaj A, Belcher A, de Berardinis B, Motiwala S, et al. 2014; Head-to-head comparison of serial soluble ST2, growth differentiation factor-15, and highly-sensitive troponin T measurements in patients with chronic heart failure. JACC Heart Fail. 2:65–72. DOI: 10.1016/j.jchf.2013.10.005. PMID: 24622120.
crossref
15. Kempf T, von Haehling S, Peter T, Allhoff T, Cicoira M, Doehner W, et al. 2007; Prognostic utility of growth differentiation factor-15 in patients with chronic heart failure. J Am Coll Cardiol. 50:1054–60. DOI: 10.1016/j.jacc.2007.04.091. PMID: 17825714.
crossref
16. Emdin M, Aimo A, Vergaro G, Bayes-Genis A, Lupón J, Latini R, et al. 2018; sST2 predicts outcome in chronic heart failure beyond NT-proBNP and high-sensitivity troponin T. J Am Coll Cardiol. 72:2309–20. DOI: 10.1016/j.jacc.2018.08.2165. PMID: 30384887.
17. Bouwens E, Brankovic M, Mouthaan H, Baart S, Rizopoulos D, van Boven N, et al. 2019; Temporal patterns of 14 blood biomarker candidates of cardiac remodeling in relation to prognosis of patients with chronic heart failure-The Bio- SH i FT study. J Am Heart Assoc. 8:e009555. DOI: 10.1161/JAHA.118.009555. PMID: 30760105. PMCID: PMC6405680.
crossref
18. Masson S, Agabiti N, Vago T, Miceli M, Mayer F, Letizia T, et al. 2015; The fibroblast growth factor-23 and vitamin D emerge as nontraditional risk factors and may affect cardiovascular risk. J Intern Med. 277:318–30. DOI: 10.1111/joim.12232. PMID: 24620922.
crossref
19. Gaggin HK, Januzzi JL. 2013; Biomarkers and diagnostics in heart failure. Biochim Biophys Acta. 1832:2442–50. DOI: 10.1016/j.bbadis.2012.12.014. PMID: 23313577.
crossref
20. Sun RR, Lu L, Liu M, Cao Y, Li XC, Liu H, et al. 2014; Biomarkers and heart disease. Eur Rev Med Pharmacol Sci. 18:2927–35.
21. Yap J, Lim FY, Gao F, Teo LL, Lam CSP, Yeo KK. 2015; Correlation of the New York Heart Association classification and the 6‐minute walk distance: A systematic review. Clin Cardiol. 38:621–8. DOI: 10.1002/clc.22468. PMID: 26442458. PMCID: PMC6490728.
crossref
22. Felker GM, Whellan D, Kraus WE, Clare R, Zannad F, Donahue M, et al. 2009; N-terminal pro-brain natriuretic peptide and exercise capacity in chronic heart failure: data from the Heart Failure and a Controlled Trial Investigating Outcomes of Exercise Training (HF-ACTION) study. Am Heart J. 158:S37–44. DOI: 10.1016/j.ahj.2009.07.011. PMID: 19782787. PMCID: PMC3748954.
crossref
23. Bozkurt B, Coats AJ, Tsutsui H, Abdelhamid M, Adamopoulos S, Albert N, et al. 2021; Universal definition and classification of heart failure: A report of the Heart Failure Society of America, Heart Failure Association of the European Society of Cardiology, Japanese Heart Failure Society and Writing Committee of the Universal Definition of Heart Failure. J Card Fail. 27:387–413. DOI: 10.1016/j.cardfail.2021.01.022.
crossref
24. Nagueh SF, Smiseth OA, Appleton CP, Byrd BF, Dokainish H, Edvardsen T, et al. 2016; Recommendations for the evaluation of left ventricular diastolic function by echocardiography: an update from the American Society of Echocardiography and the European Association of Cardiovascular Imaging. J Am Soc Echocardiogr. 29:277–314. DOI: 10.1016/j.echo.2016.01.011. PMID: 27037982.
crossref
25. Guyatt GH, Sullivan MJ, Thompson PJ, Fallen EL, Pugsley SO, Taylor DW, et al. 1985; The 6-minute walk: a new measure of exercise capacity in patients with chronic heart failure. Can Med Assoc J. 132:919–23.
26. Demers C, McKelvie RS, Negassa A, Yusuf S. RESOLVD Pilot Study Investigators. 2001; Reliability, validity, and responsiveness of the six-minute walk test in patients with heart failure. Am Heart J. 142:698–703. DOI: 10.1067/mhj.2001.118468. PMID: 11579362.
crossref
27. Masson S, Latini R, Anand IS, Vago T, Angelici L, Barlera S, et al. 2006; Direct comparison of B-type natriuretic peptide (BNP) and amino-terminal proBNP in a large population of patients with chronic and symptomatic heart failure: the Valsartan Heart Failure (Val-HeFT) data. Clin Chem. 52:1528–38. DOI: 10.1373/clinchem.2006.069575. PMID: 16777915.
crossref
28. Ky B, French B, McCloskey K, Rame JE, McIntosh E, Shahi P, et al. 2011; High-sensitivity ST2 for prediction of adverse outcomes in chronic heart failure. Circ Heart Fail. 4:180–7. DOI: 10.1161/CIRCHEARTFAILURE.110.958223. PMID: 21178018. PMCID: PMC3163169.
crossref
29. Kuster N, Huet F, Dupuy AM, Akodad M, Battistella P, Agullo A, et al. 2020; Multimarker approach including CRP, sST2 and GDF-15 for prognostic stratification in stable heart failure. ESC Heart Fail. 7:2230–9. DOI: 10.1002/ehf2.12680. PMID: 32649062. PMCID: PMC7524044.
crossref
30. Grande D, Leone M, Rizzo C, Terlizzese P, Parisi G, Gioia MI, et al. 2017; A multiparametric approach based on NT-proBNP, ST2, and galectin3 for stratifying one year prognosis of chronic heart failure outpatients. J Cardiovasc Dev Dis. 4:9. DOI: 10.3390/jcdd4030009. PMID: 29367540. PMCID: PMC5715710.
crossref
31. Pocock SJ, Ariti CA, McMurray JJV, Maggioni A, Køber L, Squire IB, et al. 2013; Predicting survival in heart failure: a risk score based on 39 372 patients from 30 studies. Eur Heart J. 34:1404–13. DOI: 10.1093/eurheartj/ehs337. PMID: 23095984.
crossref
32. Levy WC, Mozaffarian D, Linker DT, Sutradhar SC, Anker SD, Cropp AB, et al. 2006; The Seattle heart failure model: prediction of survival in heart failure. Circulation. 113:1424–33. DOI: 10.1161/CIRCULATIONAHA.105.584102. PMID: 16534009.
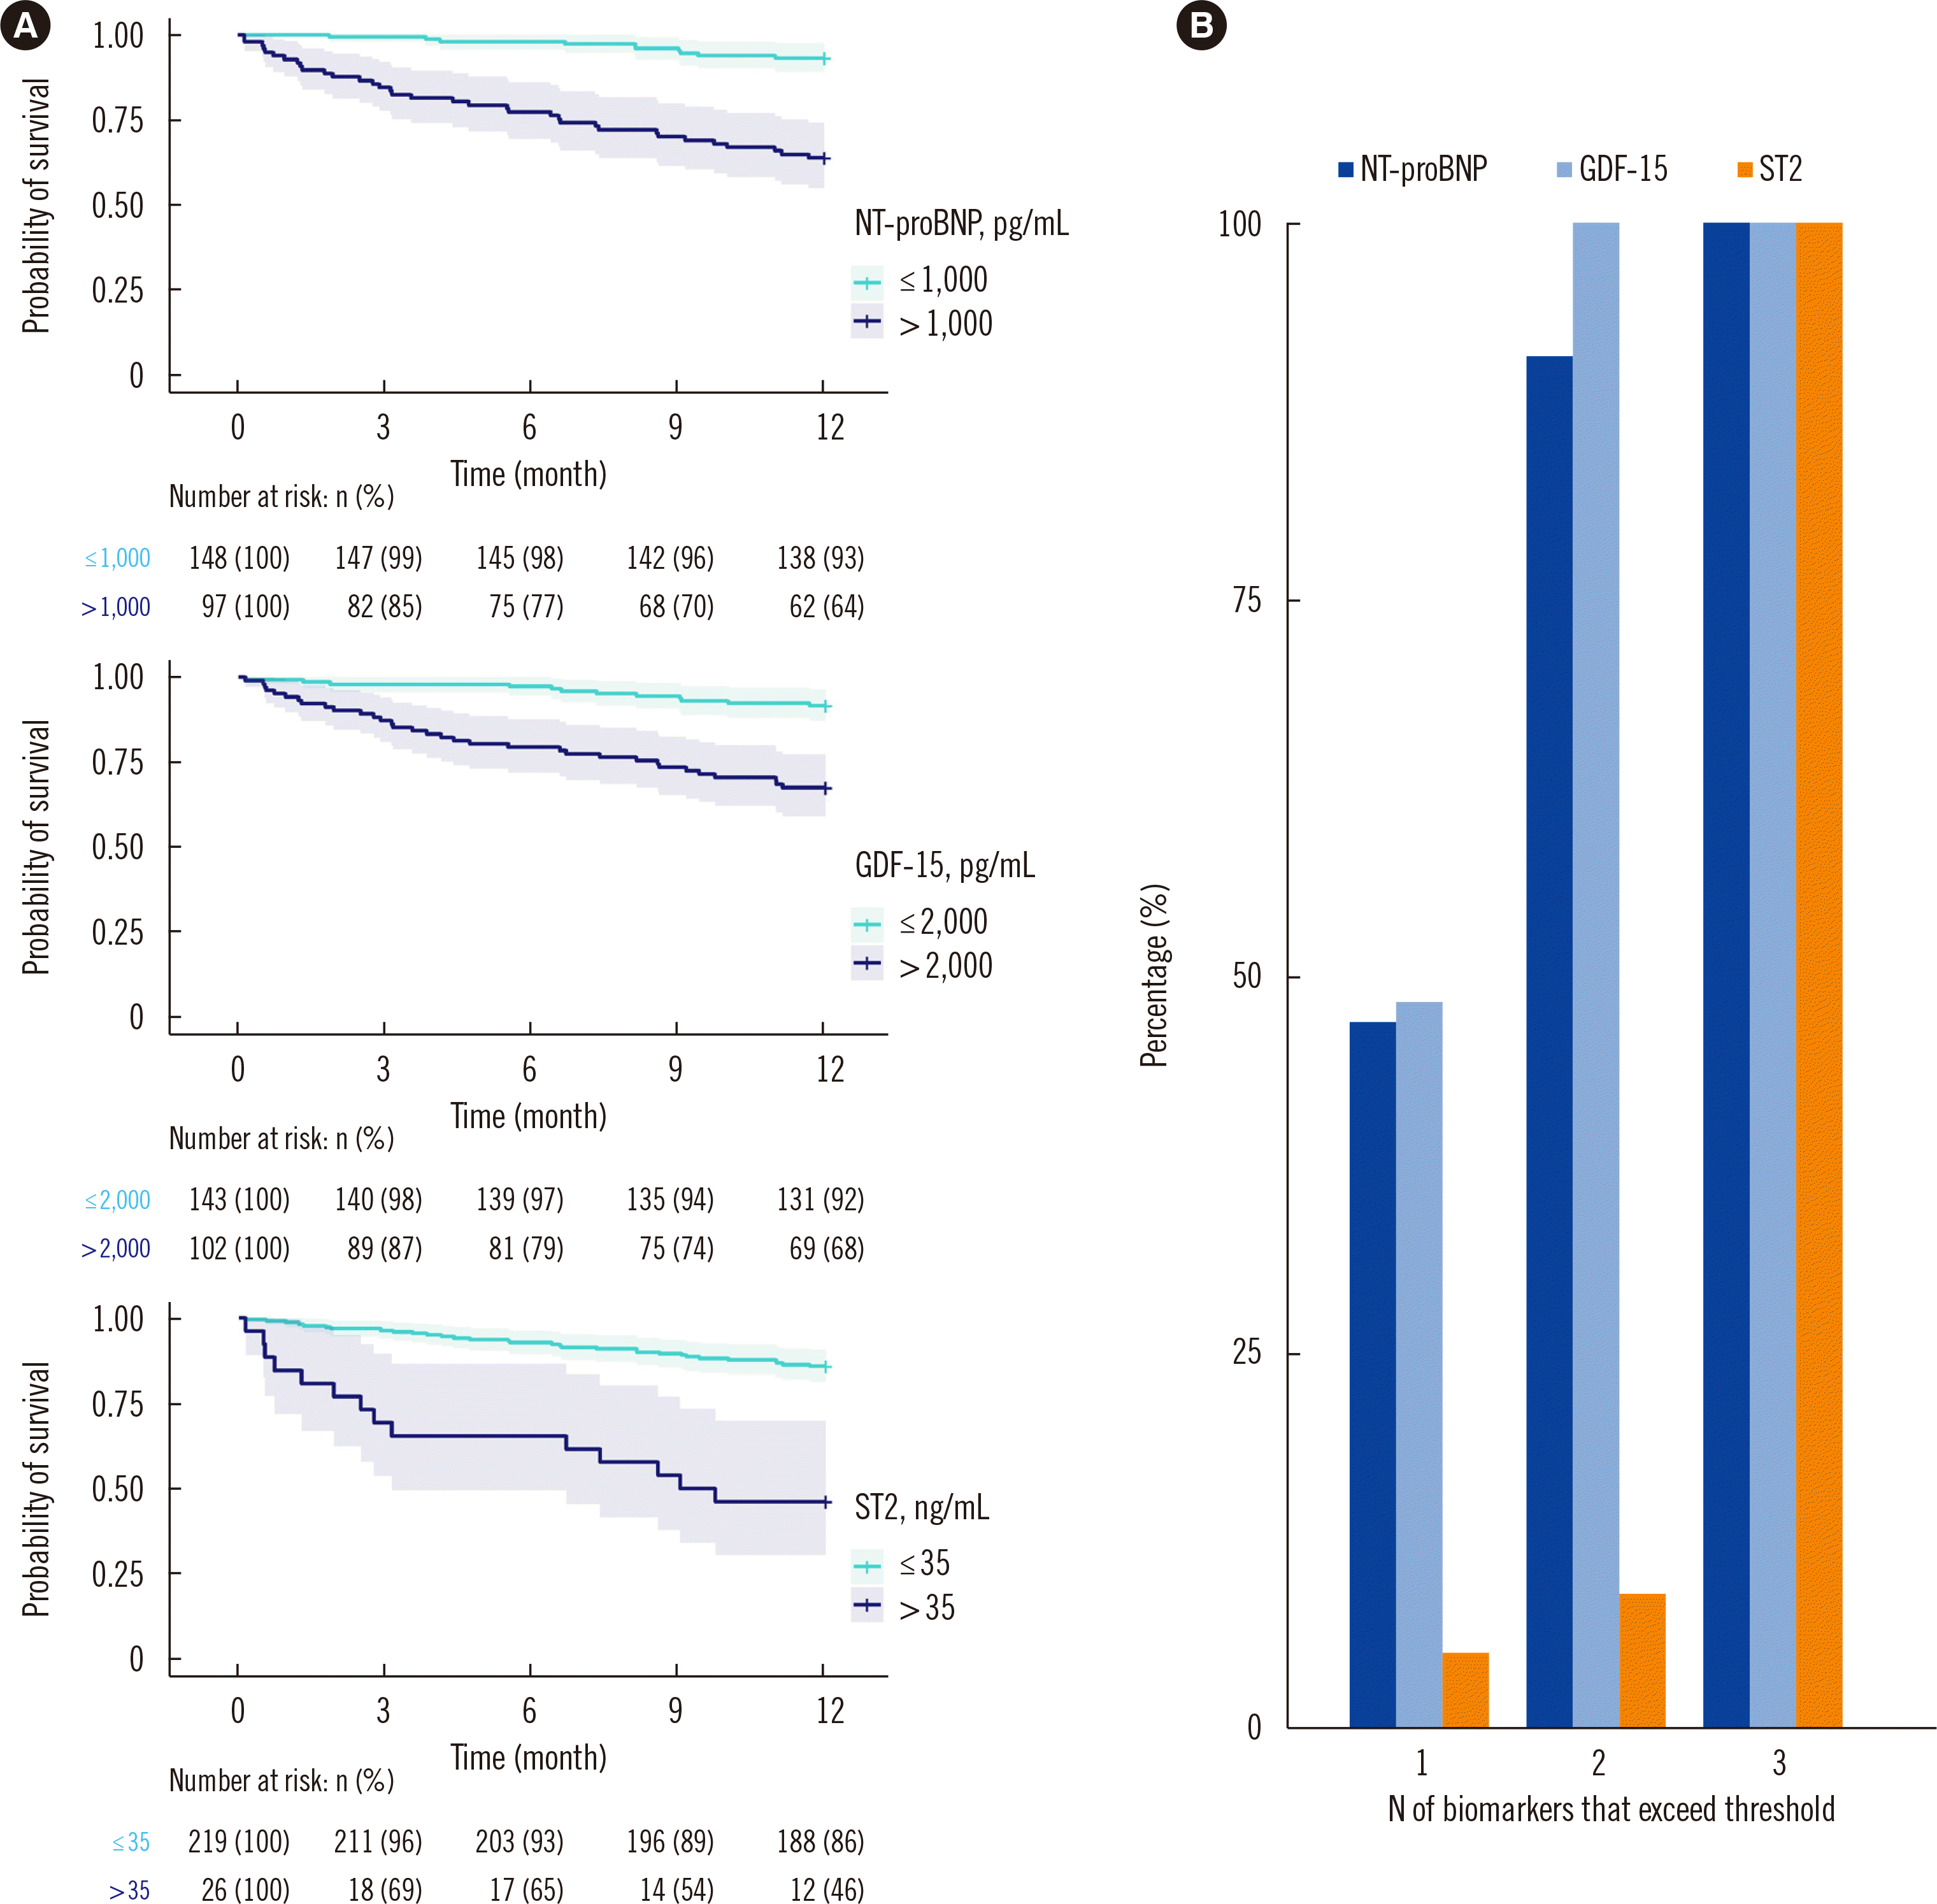
Fig. 1
Survival curves and percentage of patients of the HF biomarkers. (A) Kaplan–Meier survival curves for the biomarkers NT-proBNP, GDF-15, and ST-2. Lines indicate the survival curve, and shaded areas indicate the 95% confidence intervals. Numbers at the bottom of the graphs indicate the number of patients at risk and the corresponding percentage relative to the initial number of patients in the group. (B) Percentage of patients for which a specific biomarker exceeds predefined cut-off values. By definition, the totals of the bars are 0% for patients with no elevated biomarkers, 100% for the group with one elevated biomarker, 200% (2×100%) for the group with two elevated biomarkers, and 300% (3×100%) for the group with three elevated biomarkers.
Abbreviations: GDF-15, growth differentiation factor-15; ST2, suppression of tumorigenesis-2; FGF-23, fibroblast growth factor-23; NT-proBNP, N-terminal pro-B-type natriuretic peptide.
alm-43-3-253-f1.tif
Fig. 2
Prognostic value and relation to 6MWT distance for both NYHA classification and Heartmarker Score. (A–D) Kaplan–Meier survival curves. Lines indicate the survival curves for heart failure (HF) patients grouped according to the (A, C) proposed Heartmarker biomarker score and (B, D) NYHA classification; shaded areas indicate the 95% confidence intervals. Numbers at the bottom of the graphs indicate the number of patients at risk and the corresponding percentage relative to the initial patients in the group. (C and D) The two highest classes of the classifications in (A) and (B), respectively. (E and F) Boxplots showing the distance covered in the 6MWT for the HF patients grouped according to (E) Heartmarker score and (F) the NYHA classification. Note that the 6MWT distance was unavailable for nine patients.
Abbreviations: 6MWT, 6-min walking test; NYHA, New York Heart Association.
alm-43-3-253-f2.tif
Table 1
Baseline characteristics and comparison of the groups that did not and did reach the composite endpoint
Parameter Total No composite endpoint Composite endpoint P*
N 245 200 45
Age (yr), median (IQR) 70 (61–76) 70 (61–76) 71 (64–79) 0.04
Male, N (%) 172 (70) 140 (70) 32 (71) 1.00
BMI (kg/m2), median (IQR) 26 (24–30) 26 (24–29) 28 (24–32) 0.24
LVEF, N (%) 43 (33–49) 45 (36–49) 33 (26–43) < 0.01
6MWT distance (m), median (IQR) 350 (290–400) 350 (300–400) 320 (230–360) < 0.01
Type of HF, N (%)
HFrEF 104 (42) 74 (37) 30 (67) < 0.01
HFmrEF 86 (35) 77 (38) 9 (20) 0.02
HFpEF 55 (22) 49 (24) 6 (13) 0.12
Comorbidities, N (%)
Diabetes 38 (16) 21 (11) 17 (38) < 0.01
Hypertension 123 (50) 97 (49) 26 (58) 0.32
Arrhythmia 148 (61) 119 (60) 29 (64) 0.62
COPD 26 (11) 21 (11) 5 (11) 1.00
NYHA class, N (%)
I 81 (33) 78 (39) 3 (7) < 0.01
II 97 (40) 77 (38) 20 (44) 0.50
III 60 (24) 41 (20) 19 (42) < 0.01
IV 7 (3) 4 (2) 3 (7) 0.12
Laboratory parameters, median (IQR)
eGFR/CKD-EPI, mL/min/1.73 m2 65 (22) 68 (21) 53 (23) < 0.01
NT-proBNP, pg/mL 712 (380–1,629) 618 (298–1,232) 2,049 (1,191–4,902) < 0.01
GDF15, pg/mL 1,749 (1,168–2,786) 1,565 (1,072–2,438) 2,963 (1,970–4,983) < 0.01
ST2, ng/mL 16 (12–24) 15 (12–21) 22 (16–40) < 0.01
FGF23, pg/mL 71 (58–94) 70 (56–87) 76 (67–122) < 0.01
Laboratory parameters > cut-off value, N (%)
NT-proBNP > 1,000 pg/mL 97 (40) 62 (31) 35 (78) < 0.01
GDF-15 > 2,000 pg/mL 102 (42) 69 (34) 33 (73) < 0.01
ST2 > 35 ng/mL 26 (11) 12 (6) 14 (31) < 0.01
FGF-23 > 95.4 pg/mL 60 (24) 41 (20) 19 (42) < 0.01
Medication, N (%)
β-blockers 193 (79) 159 (80) 34 (77) 0.68
Angiotensin-converting enzyme inhibitors 140 (58) 113 (57) 27 (61) 0.62
Angiotensin type 2 receptor blockers 58 (24) 50 (25) 8 (18) 0.43
Angiotensin receptor neprilysin inhibitor 5 (2) 3 (2) 2 (5) 0.22
Loop diuretics 116 (48) 85 (43) 31 (70) < 0.01
Spironolacton 77 (32) 56 (28) 21 (48) 0.02

*P-values are based on statistical comparisons of the groups that reached or did not reach the composite endpoint.

Abbreviations: LVEF, left ventricular ejection fraction; HF, heart failure; NYHA, New York Heart Association; NT-proBNP, N-terminal pro-B-type natriuretic peptide; ST2, suppression of tumorigenesis-2; GDF-15, growth differentiation factor-15; FGF-23, fibroblast growth factor-23; BMI, body mass index; HFrEF, heart failure with reduced ejection fraction; HFmrEF, heart failure with mildly reduced ejection fraction; HFpEF, heart failure with preserved ejection fraction; COPD, chronic obstructive pulmonary disease; eGFR, estimated glomerular filtration rate; CKD-EPI, Chronic Kidney Disease Epidemiology Collaboration.

Table 2
Univariate and multivariate Cox regression analyses for the risk of the composite endpoint comparing patients with a biomarker within and above the cut-off value
Biomarker and cut-off Univariable Multivariable


HR (95% CI) P HR (95% CI) P
NT-proBNP > 1,000 pg/mL 6.5 (3.2–13.2) < 0.01 4.1 (2.0–8.9) < 0.01
GDF-15 > 2,000 pg/mL 4.5 (2.3–8.8) < 0.01 2.2 (1.0–4.5) 0.04
ST2 > 35 ng/mL 5.4 (2.8–10.1) < 0.01 2.6 (1.3–5.2) < 0.01
FGF-23 > 95.4 pg/mL 2.7 (1.5–4.8) < 0.01 1.5 (0.8–2.7) 0.21

Abbreviations: HR, hazard ratio; CI, confidence interval; GDF-15, growth differentiation factor-15; ST2, suppression of tumorigenesis-2; FGF-23, fibroblast growth factor-23; NT-proBNP, N-terminal pro-B-type natriuretic peptide.

TOOLS
Similar articles