INTRODUCTION
METHODS
Ethics Approval
Data Attributes
Statistical Analysis
RESULTS
Heart Failure Burden in Hong Kong: an Overview
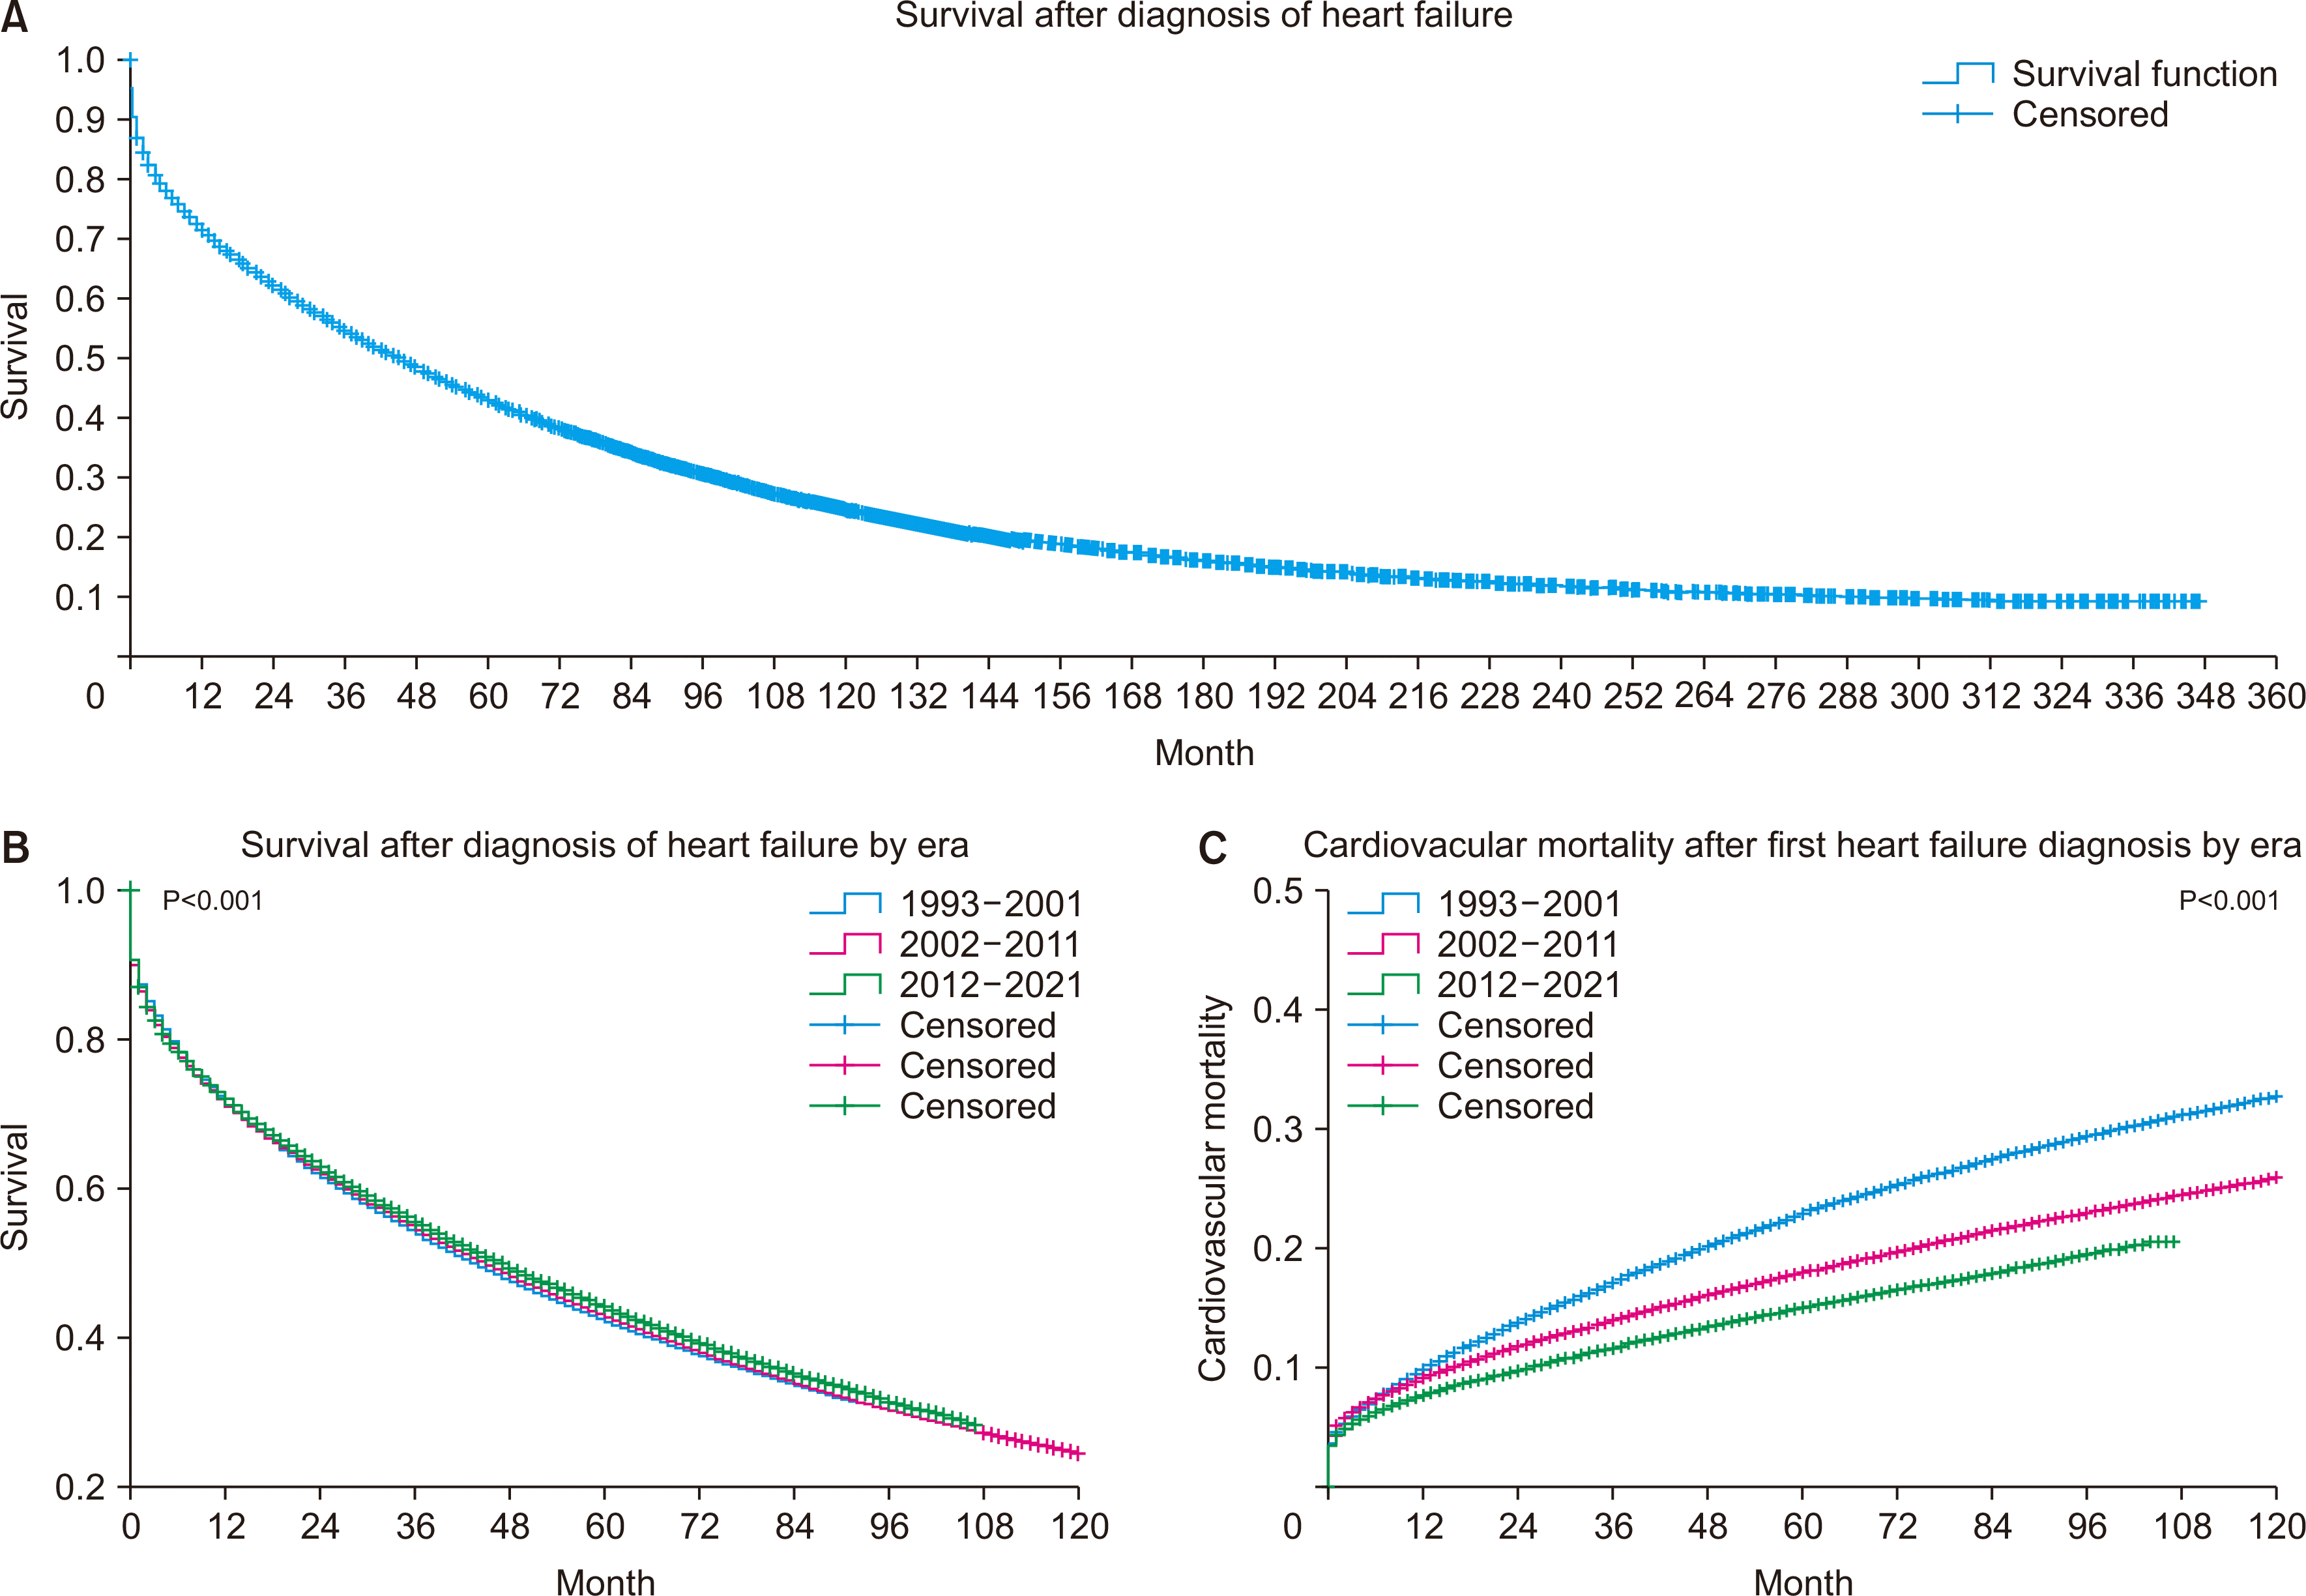
 | Fig. 1Hong Kong heart failure statistics in 1993–2021. (A) Long-term survival after the first diagnosis of heart failure in Hong Kong in 1993–2021 (n=292, 667). (B) A significant difference was observed across the examined eras in long-term survival after the first diagnosis of heart failure in Hong Kong (P<0.001). (C) A significant difference was also seen across eras in cardiovascular mortality after first diagnosis of heart failure in Hong Kong (n=271, 241; P<0.001). |
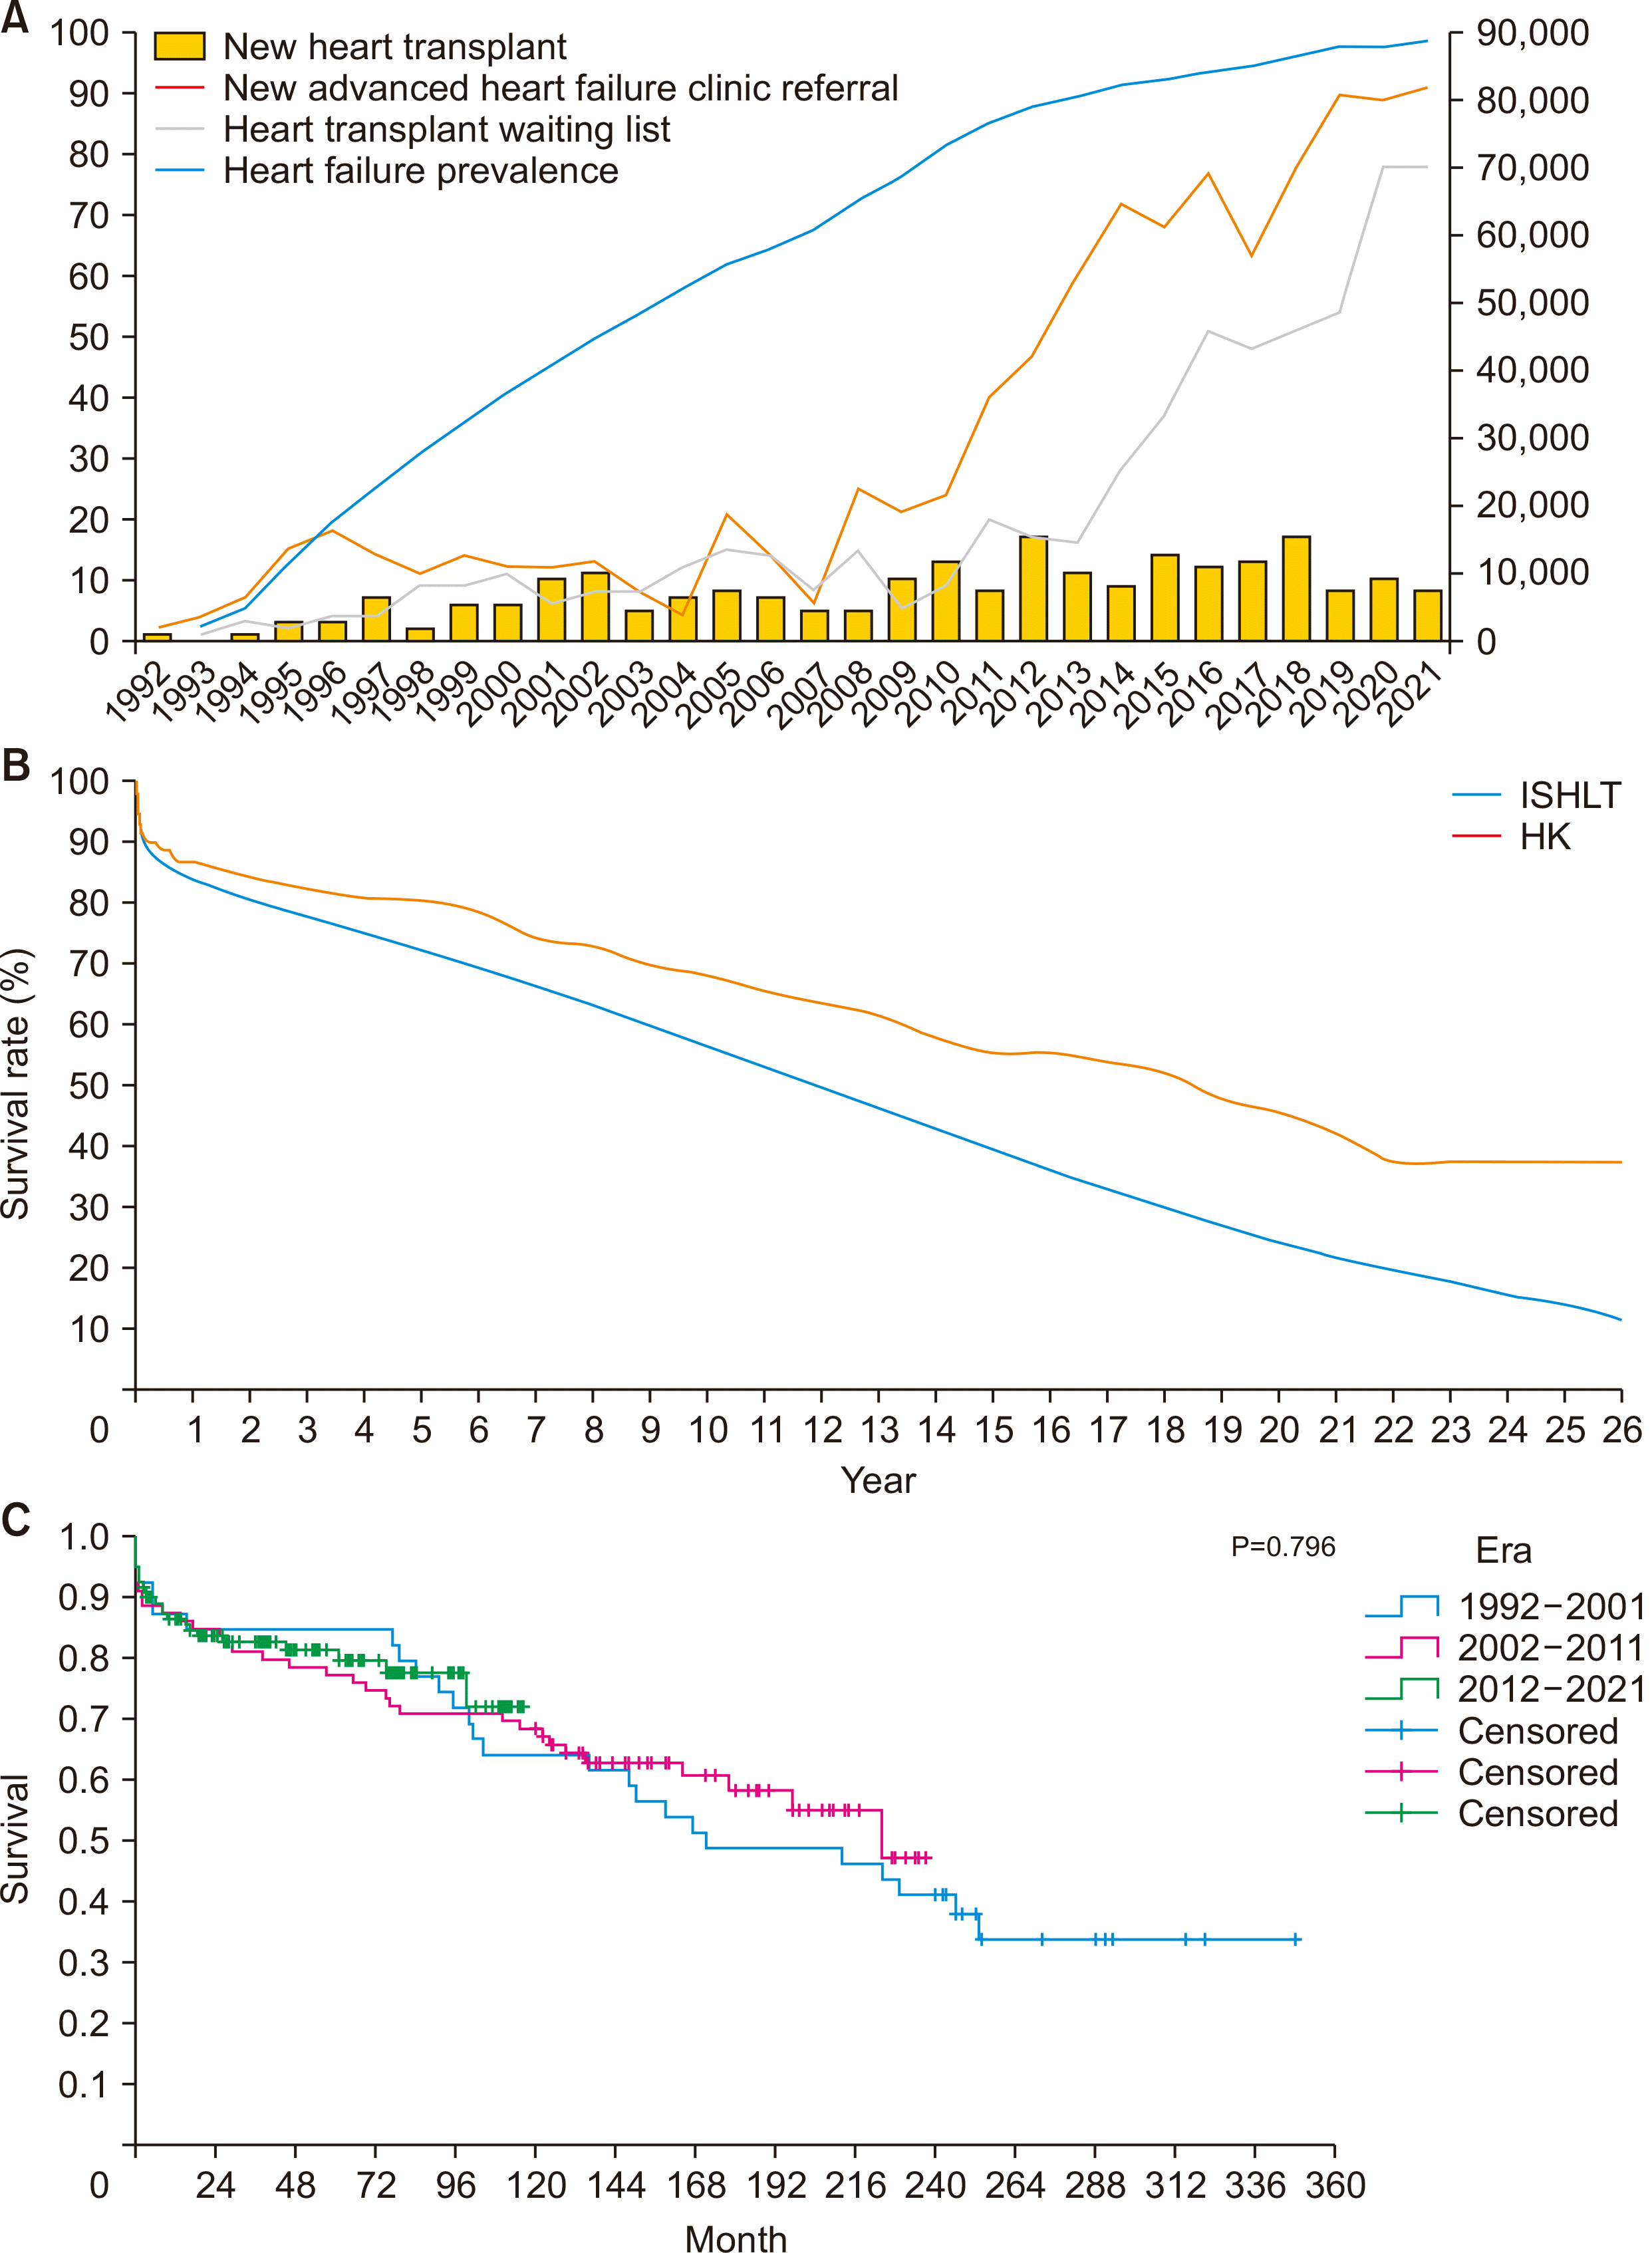
 | Fig. 2Hong Kong heart transplant statistics in 1992–2021. (A) Trends in number of new heart transplantations, new advanced heart failure clinic referrals, active patients on the heart transplant waiting list, and heart failure prevalence in Hong Kong from 1992 to 2021. (B) Long-term survival after adult and pediatric heart transplantations in Hong Kong (HK; n=237) and the International Society for Heart and Lung Transplantation Registry (ISHLT; n=114,783). (C) Long-term survival after adult and pediatric heart transplantations in Hong Kong by era. |
Heart Transplant Outcomes and Waiting List Trends
Table 1
| Baseline characteristic | Original cohort (n=237) | After multiple imputation | Univariate | Multivariate | ||
|---|---|---|---|---|---|---|
|
|
|
|||||
| HR (95% CI) | P-value | HR (95% CI) | P-value | |||
| Transplant era | ||||||
| 1992–2001 | 39 (16.5) | 39 (16.5) | ||||
| 2002–2011 | 79 (33.3) | 79 (33.3) | 0.869 (0.504–1.498) | 0.614 | ||
| 2012–2021 | 119 (50.2) | 119 (50.2) | 0.813 (0.433–1.525) | 0.519 | ||
| Recipient | ||||||
| Male sex | 165 (69.6) | 165 (69.6) | 1.365 (0.817–2.281) | 0.235 | ||
| Age (yr) | 43.7±13.4 | 43.7±13.4 | 1.001 (0.983–1.019) | 0.935 | ||
| Blood group (group O) | 86 (36.3) | 86 (36.3) | 1.098 (0.698–1.728) | 0.685 | ||
| Smoking (n=233) | 84 (36.1) | 85.6 (36.1) | 1.392 (0.895–2.167) | 0.143 | ||
| Alcohol use (n=230) | 36 (15.7) | 40.2 (17.0) | 1.067 (0.588–1.935) | 0.831 | ||
| Diabetes mellitus (n=236) | 53 (22.5) | 53.6 (22.6) | 1.289 (0.766–2.169) | 0.339 | ||
| Hypertension (n=236) | 37 (15.7) | 37.4 (15.8) | 0.830 (0.413–1.670) | 0.602 | ||
| Hyperlipidemia (n=236) | 56 (23.7) | 56.4 (23.8) | 0.850 (0.483–1.496) | 0.574 | ||
| TIA/CVA (n=236) | 19 (8.1) | 19.6 (8.3) | 1.470 (0.712–3.035) | 0.297 | ||
| Peripheral artery disease (n=236) | 3 (1.3) | 3 (1.3) | 1.417 (0.196–10.218) | 0.730 | ||
| CKD (n=230) | 40 (17.4) | 44.4 (18.7) | 1.545 (0.938–2.543) | 0.087 | 1.364 (0.803–2.317) | 0.250 |
| Atrial fibrillation (n=236) | 85 (36) | 85.6 (36.1) | 1.030 (0.652–1.627) | 0.899 | ||
| Ventricular arrhythmia (n=236) | 66 (28) | 66.8 (28.2) | 1.191 (0.730–1.942) | 0.485 | ||
| Depression (n=236) | 4 (1.7) | 4.6 (1.9) | 5.270 (1.720–16.151) | 0.004 | 4.682 (1.410–15.549) | 0.012 |
| Asthma/COPD (n=236) | 12 (5.1) | 12.8 (5.4) | 1.546 (0.596–4.010) | 0.371 | ||
| History of tuberculosis (n=236) | 7 (3.0) | 7.2 (3.0) | 0.929 (0.227–3.809) | 0.918 | ||
| Obstructive sleep apnea (n=236) | 9 (3.8) | 9.4 (4.0) | 1.814 (0.573–5.746) | 0.311 | ||
| Overweight (n=236)a) | 35 (14.8) | 36 (15.2) | 1.556 (0.849–2.850) | 0.152 | ||
| Thyroid disease (n=236) | 28 (11.9) | 28.8 (12.2) | 1.286 (0.652–2.534) | 0.468 | ||
| Hepatitis B carrier (n=234) | 12 (5.1) | 13.6 (5.7) | 1.516 (0.638–3.603) | 0.346 | ||
| Liver cirrhosis (n=235) | 7 (3.0) | 7.8 (3.3) | 3.170 (0.868–11.581) | 0.080 | 3.026 (0.935–9.800) | 0.065 |
| DVT/PE (n=236) | 2 (0.8) | 2.6 (1.1) | 0.482 (0.000–12566) | 0.887 | ||
| History of malignancy (n=236) | 5 (2.1) | 5.8 (2.4) | 0.356 (0.004–29.917) | 0.640 | ||
| HF etiology (ischemic) | 44 (18.6) | 44 (18.6) | 0.577 (0.348–0.959) | 0.034 | 1.783 (1.016–3.128) | 0.044 |
| HF duration (mo) (n=234) | 57.3 (65.3) | 57 (65.5) | 0.997 (0.993–1.001) | 0.141 | ||
| ICD | 92 (38.8) | 92 (38.8) | 0.817 (0.508–1.313) | 0.404 | ||
| CRT | 67 (28.3) | 67 (28.3) | 0.871 (0.512–1.484) | 0.612 | ||
| LVAD | 35 (14.8) | 35 (14.8) | 0.937 (0.399–2.203) | 0.882 | ||
| LVEDD (cm) (n=201) | 6.5±1.4 | 6.5±1.4 | 0.961 (0.819–1.128) | 0.627 | ||
| LVESD (cm) (n=195) | 5.8±1.5 | 5.8±1.5 | 0.946 (0.813–1.100) | 0.471 | ||
| LVEF (%) (n=217) | 23.3±13 | 23.7±13.9 | 1.005 (0.990–1.021) | 0.508 | ||
| Cardiac output (L/min) (n=201) | 3±0.9 | 3±1 | 1.095 (0.873–1.374) | 0.431 | ||
| Cardiac index (L/min/m2) (n=200) | 1.8±0.5 | 1.8±0.6 | 1.299 (0.856–1.973) | 0.217 | ||
| PCWP (mmHg) (n=194) | 21.2±9.5 | 20.8±10.1 | 1.021 (0.997–1.046) | 0.080 | 1.005 (0.953–1.059) | 0.856 |
| RAP (mmHg) (n=173) | 11.8±7.4 | 11.7±8.2 | 1.019 (0.989–1.051) | 0.216 | ||
| PAPm (mmHg) (n=203) | 29.7±11.9 | 29.7±12.3 | 1.018 (0.999–1.038) | 0.069 | 1.015 (0.969–1.063) | 0.521 |
| PVR (Wood units) (n=195) | 3.7±3.8 | 3.7±4.4 | 1.015 (0.949–1.085) | 0.662 | ||
| VO2max (mL/kg/min) (n=143) | 14.2±4.2 | 14.4±6.3 | 1.003 (0.947–1.061) | 0.917 | ||
| Donor | ||||||
| Male sex | 154 (65) | 154 (65) | 0.708 (0.455–1.102) | 0.126 | ||
| Age (yr) | 41.6±13.7 | 41.6±13.7 | 1.012 (0.995–1.029) | 0.157 | ||
| Blood group (group O) | 136 (57.4) | 136 (57.4) | 0.967 (0.622–1.502) | 0.880 | ||
| Weight (kg) | 64.4±11.1 | 64.4±11.1 | 0.993 (0.972–1.015) | 0.529 | ||
| Height (cm) (n=233) | 165.7±10.6 | 165.8±10.6 | 0.975 (0.955–0.995) | 0.016 | 0.977 (0.955–1.001) | 0.057 |
| BMI (kg/m2) (n=233) | 23.3±3 | 23.3±3.1 | 1.034 (0.959–1.115) | 0.384 | ||
| Smoking (n=222) | 79 (35.6) | 89.4 (37.7) | 1.628 (0.993–2.669) | 0.054 | 1.693 (0.989–2.898) | 0.055 |
| Alcohol use (n=151) | 18 (11.9) | 69 (29.1) | 0.892 (0.857–4.179) | 0.110 | ||
| Diabetes mellitus (n=220) | 7 (3.2) | 15.6 (6.6) | 1.108 (0.395–3.102) | 0.846 | ||
| Hypertension (n=223) | 49 (22.0) | 53.2 (22.4) | 1.876 (1.145–3.072) | 0.012 | 2.123 (1.237–3.641) | 0.006 |
| Malignancy history (n=223) | 10 (4.5) | 18.2 (7.7) | 1.240 (0.488–3.156) | 0.651 | ||
| Inotrope use (n=236) | 212 (89.8) | 212 (89.5) | 1.316 (0.678–2.556) | 0.417 | ||
| CPR (n=220) | 42 (19.1) | 48.4 (20.4) | 1.192 (0.641–2.216) | 0.579 | ||
| Ischemic time (n=156) | 162.4±56.5 | 162±77.5 | 1.000 (0.994–1.007) | 0.883 | ||
HR, hazard ratio; CI, confidence interval; TIA, transient ischemic attack; CVA, cerebrovascular accident; CKD, chronic kidney disease with estimated glomerular filtration rate less than 60 mL/min/1.73 m2; COPD, chronic obstructive pulmonary disease; DVT, deep vein thrombosis; PE, pulmonary embolism; HF, heart failure; ICD, implantable cardioverter defibrillator; CRT, cardiac resynchronization therapy; LVAD, left ventricle assist device; LVEDD, left ventricular end-diastolic diameter; LVESD, left ventricular end-systolic diameter; LVEF, left ventricular ejection fraction; PCWP, pulmonary capillary wedge pressure; RAP, mean right atrial pressure; PAPm, mean pulmonary arterial pressure; PVR, pulmonary vascular resistance; VO2max, peak oxygen consumption on cardiopulmonary exercise test; BMI, body mass index; CPR, cardiopulmonary resuscitation.
Short-term and Durable Mechanical Circulatory Support
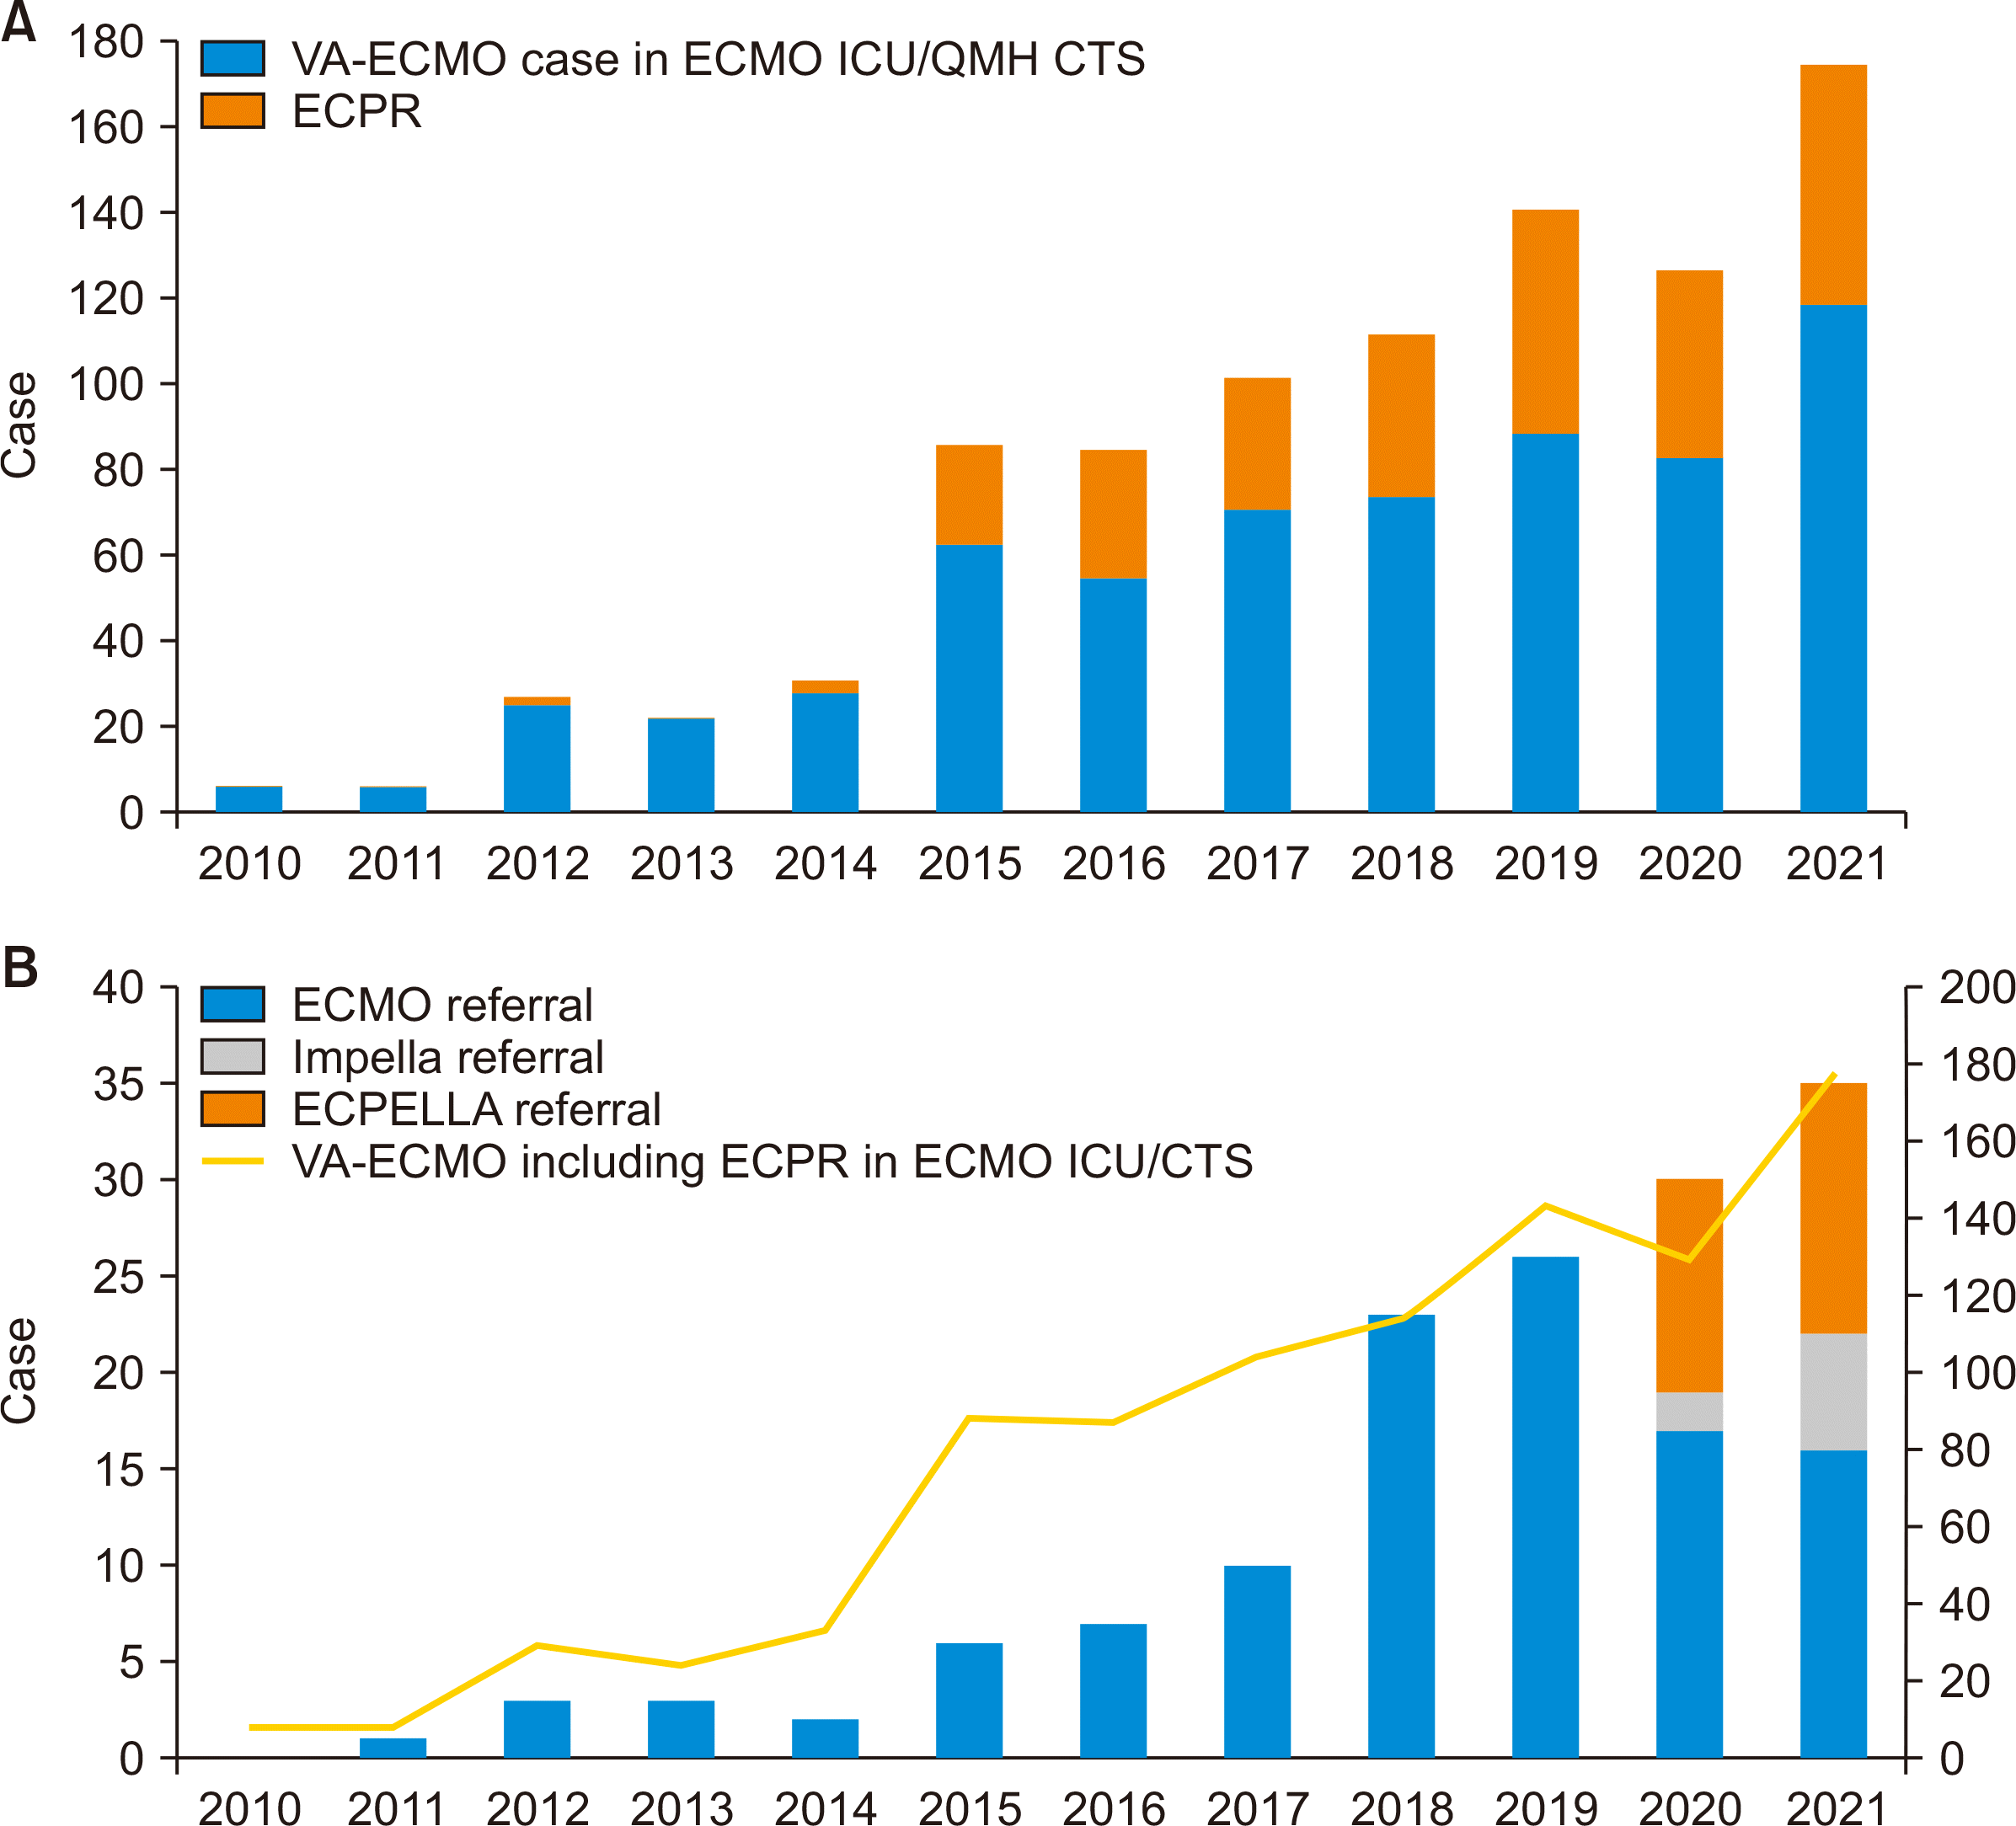
 | Fig. 3Mechanical circulatory support statistics in Hong Kong in 2010–2021. (A) Trend in the utilization of venoarterial extracorporeal membrane oxygenation (VA-ECMO) and extracorporeal cardiopulmonary resuscitation (ECPR) in Hong Kong from 2010 to 2021. (B) Trend in VA-ECMO or percutaneous microaxial left ventricular assist device (Impella; Abiomed)-related referrals to the heart transplant service as well as total background numbers of VA-ECMO and ECPR cases in Hong Kong from 2010 to 2021. ICU, intensive care unit; QMH, Queen Mary Hospital; CTS, cardiothoracic surgery; ECPELLA, extracorporeal membrane oxygenation and impella. |
 | Fig. 4(A) Survival of patients referred for advanced heart failure therapy related to the use of short-term mechanical circulatory support devices. A significant difference in survival was observed by decision after patient referral to the advanced heart failure service related to short-term mechanical circulatory support (P<0.001). (B) Survival of patients accepted for advanced heart failure therapies by different bridging strategies. Significantly better survival (71.5%) was observed at 1 year after durable left ventricular assist device implantation compared to 40% at 1 year after CentriMag (Levitronix) left ventricular assist device implantation as bridging strategies for transplantation/candidacy (P=0.008). LVAD, left ventricular assist device. |
 | Fig. 5(A) Survival after durable left ventricular assist device implantation in Hong Kong between 2010 and 2021 (n=143). (B) Comparison of survival after durable left ventricular assist device implantation as a bridge to transplantation/candidacy strategy and survival after heart transplantation in Hong Kong (P=0.296). |


 PDF
PDF Citation
 Print
Print


 XML Download