

 PDF
PDF Citation
 Print
Print


INTRODUCTION
Cancer-related pain is one of the most common and difficult problems affecting cancer patients, with more than 70% of patients suffering from cancer-related pain [1]. Pain in cancer patients is currently not adequately controlled [2]. At present, due to the complex etiology and unclear mechanism of cancer pain, the lack of effective pain control methods has a negative impact on the treatment effect and quality of life of patients [3]. Therefore, it is crucial to find effective ways to relieve cancer-related pain.
Heparanase (HPSE) is an enzyme that cleaves heparan sulfate in mammalian cells. It has been reported that most cancers have a high level of HPSE, resulting in enhanced tumor growth and metastasis, along with poor patient survival [4,5]. A low level of HPSE is associated with prolonged disease-free period and overall survival in squamous cell carcinoma of head and neck [6]. Elevated HPSE levels induce tumor-associated macrophages to acquire a precancerous phenotype in cases of obesity, leading to activation of pro-tumor signaling and promoting breast tumor growth, while HPSE deficiency abolishes obesity-accelerated tumors progress [7]. HPSE inhibition significantly reduces cell invasive phenotype in liver cancer cell lines [8]. However, the role of HPSE on melanoma cells and cancer pain is unclear.
Nerve growth factor (NGF) belongs to the neurotrophic factor family and is a growth factor [9]. Studies have reported that NGF is overexpressed in the vast majority of human solid cancers [10]. NGF and its receptors play important roles in regulating tumorigenesis and cancer pain [11]. NGF is associated with pancreatic cancer cell growth, and inhibition of NGF significantly inhibits tumor growth in prostate cancer [12]. Cholinergic activity in the gastric epithelium induces NGF expression, and thus overexpression of NGF within the gastric epithelium dilates enteric nerves and promotes carcinogenesis [13]. Sonic hedgehog (sHH) secreted by pancreatic cancer cells can activate the sHH pathway to increase the expression of NGF in the dorsal root ganglions, which mediates pain mechanisms by regulating substance P and calcitonin gene-related peptide [14].
Syndecan-1 (SDC1) is an important member of the cell surface heparan sulfate proteoglycan family. SDC1 is an important co-receptor for receptor tyrosine kinases and chemokine receptors, and it acts as a substrate for HPSE [15]. Functional interaction between SDC1 and HPSE regulates tumor progression [15]. HPSE activity enhances hepatocyte growth factor expression and signaling through SDC1 shedding [16]. SDC1 silencing in breast cancer cells significantly reduces brain metastasis, whereas overexpression of SDC1 promotes brain metastasis [17]. SDC1 induction in the lung microenvironment promotes the establishment of breast tumor metastases [18].
In this study, the authors demonstrated the role of HPSE/SDC1/NGF in melanoma cells and cancer pain. The results suggested that HPSE/SDC1/NGF may act as a novel marker for this disease and its targeting could have therapeutic implications for cancer pain from melanoma.
Go to : 
MATERIALS AND METHODS
1. Cell culture
Mice melanoma cells (B16-F10) and human melanoma cells (A375 cells) were obtained from American Type Culture Collection (Manassas, VA), and cultured in Dulbecco’s modified Eagle’s medium containing 10% fetal bovine serum and 1% penicillin/streptomycin at 37°C with 5% CO2 and 95% humidity. B16-F10 and A375 cells were divided into control, HPSE, SST0001 (HPSE inhibitor), and SST0001 + NGF groups. Cells of the HPSE group were treated with 1.0 μg/mL exogenous HPSE (MEC, Monmouth Junction, NJ) for 24 hours. Cells in the SST0001 group were treated with 200 μg/mL SST0001 (Sigma-tau, Mendrisio, Switzerland) for 24 hours. Cells in the SST0001 + NGF group were treated with 200 μg/mL SST0001 and 100 μg/mL exogenous NGF (MEC) for 24 hours.
2. Transfection
siRNA targeting NGF (si-NGF) and negative control (si-NC) were obtained from GenePharma (Shanghai, China). si-NGF or si-NC were transfected with B16-F10 cells using Lipofectamine 3000 reagent (Invitrogen, Carlsbad, CA) at 37°C for 48 hours according to the instructions of the manufacturer. Subsequently, the transfected cells were employed in the next experiments.
3. Animals
Six-week-old male C57BL/6 mice weighing 22–24 g (Shanghai SLAC Laboratory Animal Co., Ltd., Shanghai, China) were used in this study. All animal experiments were performed following animal welfare legislation and were approved by Xuzhou Medical University. Melanoma cells (20 μL, 2 × 10⁵ cells) were suspended in phosphate buffered saline and injected subcutaneously into the plantar area of the right hind paw of the mice to establish a xenograft model in mice. The model mice were divided into the model, model + SST0001, model + HPSE, and model + SST0001 + Ad-SDC1 groups (n = 6/group). Mice in the model + SST0001 group were subcutaneously injected with 30 mg/kg/day SST0001 (Sigma-tau). Mice in the model + HPSE group were subcutaneously injected with 100 μg/kg/day exogenous HPSE (MEC). Mice in the model + SST0001 + Ad-SDC1 group were subcutaneously injected with 30 mg/kg/day SST0001 and 1 × 10⁹ PFU recombinant adenovirus carrying SDC1 (Ad-SDC1; RiboBio, Guangzhou, China). At the end of the experiment (28th day), the mice were euthanized, and the sciatic nerve was dissected. Tumor weight was measured and volume was calculated every seven days using the formula (length × width2)/2. Thestudy was approved by the ethics committee of the Xuzhou Medical University (No. XMH-03047).
4. Paw thickness
The paw thickness was measured after B16-F10 cells inoculation for 3–14 days with a digital caliper. The results are expressed as percent increase in paw thickness relative to basal values.
5. Behavioral tests
Behavioral examinations were conducted to determine the pain in mice of different groups. Behavioral assessments were performed at 9:00 a.m.–4:00 p.m. before melanoma cell inoculation (baseline), as well as on days 3, 6, 9, 12, and 14 after B16-F10 cells inoculation or HPSE/SST0001 injection, and then at different time points following treatments.
6. Mechanical allodynia
Mechanical allodynia was evaluated using von Frey filaments (Stoelting,Wood Dale, IL) via the up-down method.Briefly, mice were placed in a single plexiglass box with a metal mesh floor. After 30 minutes of acclimation, von Frey filaments were applied to the mid-plantar surface of the hind paw in ascending order (0.02, 0.07, 0.16, 0.4, 0.6, 1.0, 1.4, and 2.0 g). An abrupt withdrawal of the paw or licking in response to filaments within 6 seconds was considered to be positive. The next descending filament was used when a positive response was observed, and the next ascending filament was used when no positive response was observed. The lowest force required to elicit a positive response was recorded as the hind paw withdrawal threshold.
7. Cold allodynia
Cold allodynia was evaluated by measuring acetone-induced acute nociceptive responses. Briefly, 30 μL of acetone was dropped into the dorsum of the mouse’s hind paw. Then, the time in lifting and licking of paw was recorded over a 60 second period. Three tests were performed at least 10 minutes apart, and the average lifting/licking time was computed.
8. Enzyme-linked immunosorbent assay (ELISA)
The tumor tissues and sciatic nerves that were resected from the mice were used for ELISA. The levels of programmed death-ligand 1 (PD-L1), prostaglandin E2 (PGE2), tumor necrosis factor-alpha (TNF-α), nuclear factor-κB (NF-κB), interleukin (IL)-6, and IL-1β in tissue homogenates were detected by corresponding ELISA kits (Esebio, Shanghai, China) following the instructions of the manufacturer.
9. Western blot assay
Protein was extracted from the melanoma cells or tumor tissues using lysis buffer (Sigma-Aldrich, St. Louis, MO). The protein samples were resolved using 10% SDS-PAGE and then transferred to the polyvinylidene fluoride membranes. The membranes were blocked using 5% skim milk at 25°C for 60 minutes. The membranes were incubated with the primary antibodies against HPSE (1:1,000, ab288438, Abcam, Cambridge, MA), SDC1 (1:1,000, ab128936, Abcam), NGF (1:1,000, ab52918, Abcam), and GAPDH (1:1,000, ab8245, Abcam) overnight at 4°C, and then incubated with HRP-conjugated secondary antibody (Goat Anti-Rabbit IgG, 1:5,000, ab97051, Abcam) at 25°C for 1 hour. The enhanced chemiluminescence western blotting detection kits (Sigma-Aldrich) were used to analyze the blots. GAPDH was employed as a protein loading control.
10. 3-[4,5-dimethyl-2-thiazolyl]-2,5 diphenyl-2H-tetrazolium bromide (MTT) assay
The viability of B16-F10 and A375 cells was measured using an MTT kit (Sigma-Aldrich). Cells were cultured for 24 hours into 96-well plates at 37°C, and 20 µL of MTT (2.5 mg/mL) was added to the wells and maintained for 4–6 hours. Then, the absorbance (450 nm) was measured by a microplate reader (Labcompare, San Diego, CA) and recorded at 0, 24, 48, and 72 hours.
11. Quantitative real-time polymerase chain reaction (qRT-PCR)
Total RNA was prepared from melanoma cells, tumor tissue, or sciatic nerve using TRIzol reagent (Sigma-Aldrich) according to the manufacturer’s instructions. Reverse transcription was performed using a Reverse Transcriptase kit (Thermo Fisher Scientific, Waltham, MA), and qRT-PCR was carried out by using SYBR green master mix kit (Thermo Fisher Scientific) and was analyzed using the Mastercycler ep realplex detection system (Eppendorf, Hamburg, Germany). The relative mRNA expression was normalized against β-actin using the 2−ΔΔCt method. The primer sequences are shown in Table 1.
Table 1
Primers for qRT-PCR in this study
![]()
12. Immunohistochemical (IHC) analysis
The tumor tissues were resected from the mice, post-fixed for 24 hours using 4% paraformaldehyde, and paraffin-embedded overnight at 4°C until cryosectioning. Tissue sections (5 μm) were incubated with the primary antibody HPSE (ab288438, 1:200, Abcam) or SDC1 (ab128936, 1:500, Abcam) followed by using goat anti-rabbit IgG H&L (ab97051, 1/500, Abcam). Digital images were obtained using the Olympus BX51 (Olympus, Tokyo, Japan).
13. Cell proliferation assay
According to the instructions of manufacturer, the proliferation of melanoma cells was detected using the 5-Ethynyl-20-deoxyuridine (EdU) kit (Ribobio, Guangzhou, China). Then cell nuclei were counter-stained with DAPI (1 mg/mL) for 5 minutes. Finally, the images were acquired by the fluorescence microscope (Leica, Wetzlar, Germany), and the EdU positive cell ratio was calculated.
14. Transwell assay
The invasion and migration of melanoma cells were determined using transwell (8 µm pore; Corning, Inc., Corning, NY) assay. For cell invasion assay, the upper chambers were pre-coated with Matrigel (BD Biosciences, Sparks, MD) for 5 hours at 37°C. B16-F10 or A375 cells were incubated at 37°C overnight in serum-free RPMI-1640 and were added into the upper chambers (2 × 10⁴ cells). The lower chamber was added into the complete medium. Cells were fixed with 4% paraformaldehyde for 30 minutes after incubating for 24 hours, and stained with 0.1% crystal violet for 10 minutes at 25°C. Then the migrated cells were counted using the light microscope. For cell migration assay, the transwell chambers were not coated with Matrigel. Other operations of migration are consistent with cell invasion assay.
15. Statistical analysis
Statistical data were presented as the mean ± standard deviation. Two-group comparisons were analyzed using Studentʼs t-test and multiple group comparisons by one-way ANOVA followed by Tukey’s post hoc test using Prism 7.0 software (GraphPad, La Jolla, CA). P < 0.05 was considered statistically significant.
Go to :
RESULTS
1. HPSE promotes the malignant phenotype of melanoma cells
Expression of HPSE was detected in B16-F10 and A375 cells after exogenous HPSE treatment. Results showed that HPSE is highly expressed in melanoma cells after exogenous HPSE treatment, while SST0001 treatment reduced the expression of HPSE (Fig. 1A, P < 0.001). HPSE treatment increased the cell viability and EdU positive cells, while SST0001 treatment reduced cell viability and EdU positive cells in B16-F10 and A375 cells (Fig. 1B, C, P < 0.010). In addition, HPSE treatment promoted migration and invasion of B16-F10 and A375 cells, while these were suppressed by SST0001 (Fig. 1D, E, P < 0.010). The data showed that exogenous HPSE treatment enhanced cell viability, proliferation, migration, and invasion of melanoma cells, while inhibition of HPSE suppressed the malignant phenotype of melanoma cells.
 | Fig. 1Heparanase (HPSE) promotes the malignant phenotype of melanoma cells. (A) HPSE expression was determined in B16-F10 and A375 cells by western blot. (B) Cell viability was measured by MTT assay in B16-F10 and A375 cells. (C) The proliferation of melanoma cells was detected by the EdU detection kit (200×, scale bar = 100 μm). (D, E) Transwell assay was used to determine cell migration and invasion (200×, scale bar = 200 μm). *P < 0.05, **P < 0.01 versus control. The error bars indicate mean ± standard deviation. MTT: 3-[4,5-dimethyl-2-thiazolyl]-2,5 diphenyl-2H-tetrazolium bromide, EdU: 5-Ethynyl-20-deoxyuridine.
|
2. HPSE promotes tumor growth
The role of HPSE on tumor growth was further investigated. Western blot assay showed that HPSE protein expression was increased in mouse tumor tissue suspension supernatant (Fig. 2A). As shown in Fig. 2B, HPSE was positively detected by IHC in mouse tumor tissues. HPSE treatment increased the tumor volume and weight (P < 0.050), while SST0001 treatment reduced tumor volume and weight (Fig. 2C, P < 0.050).
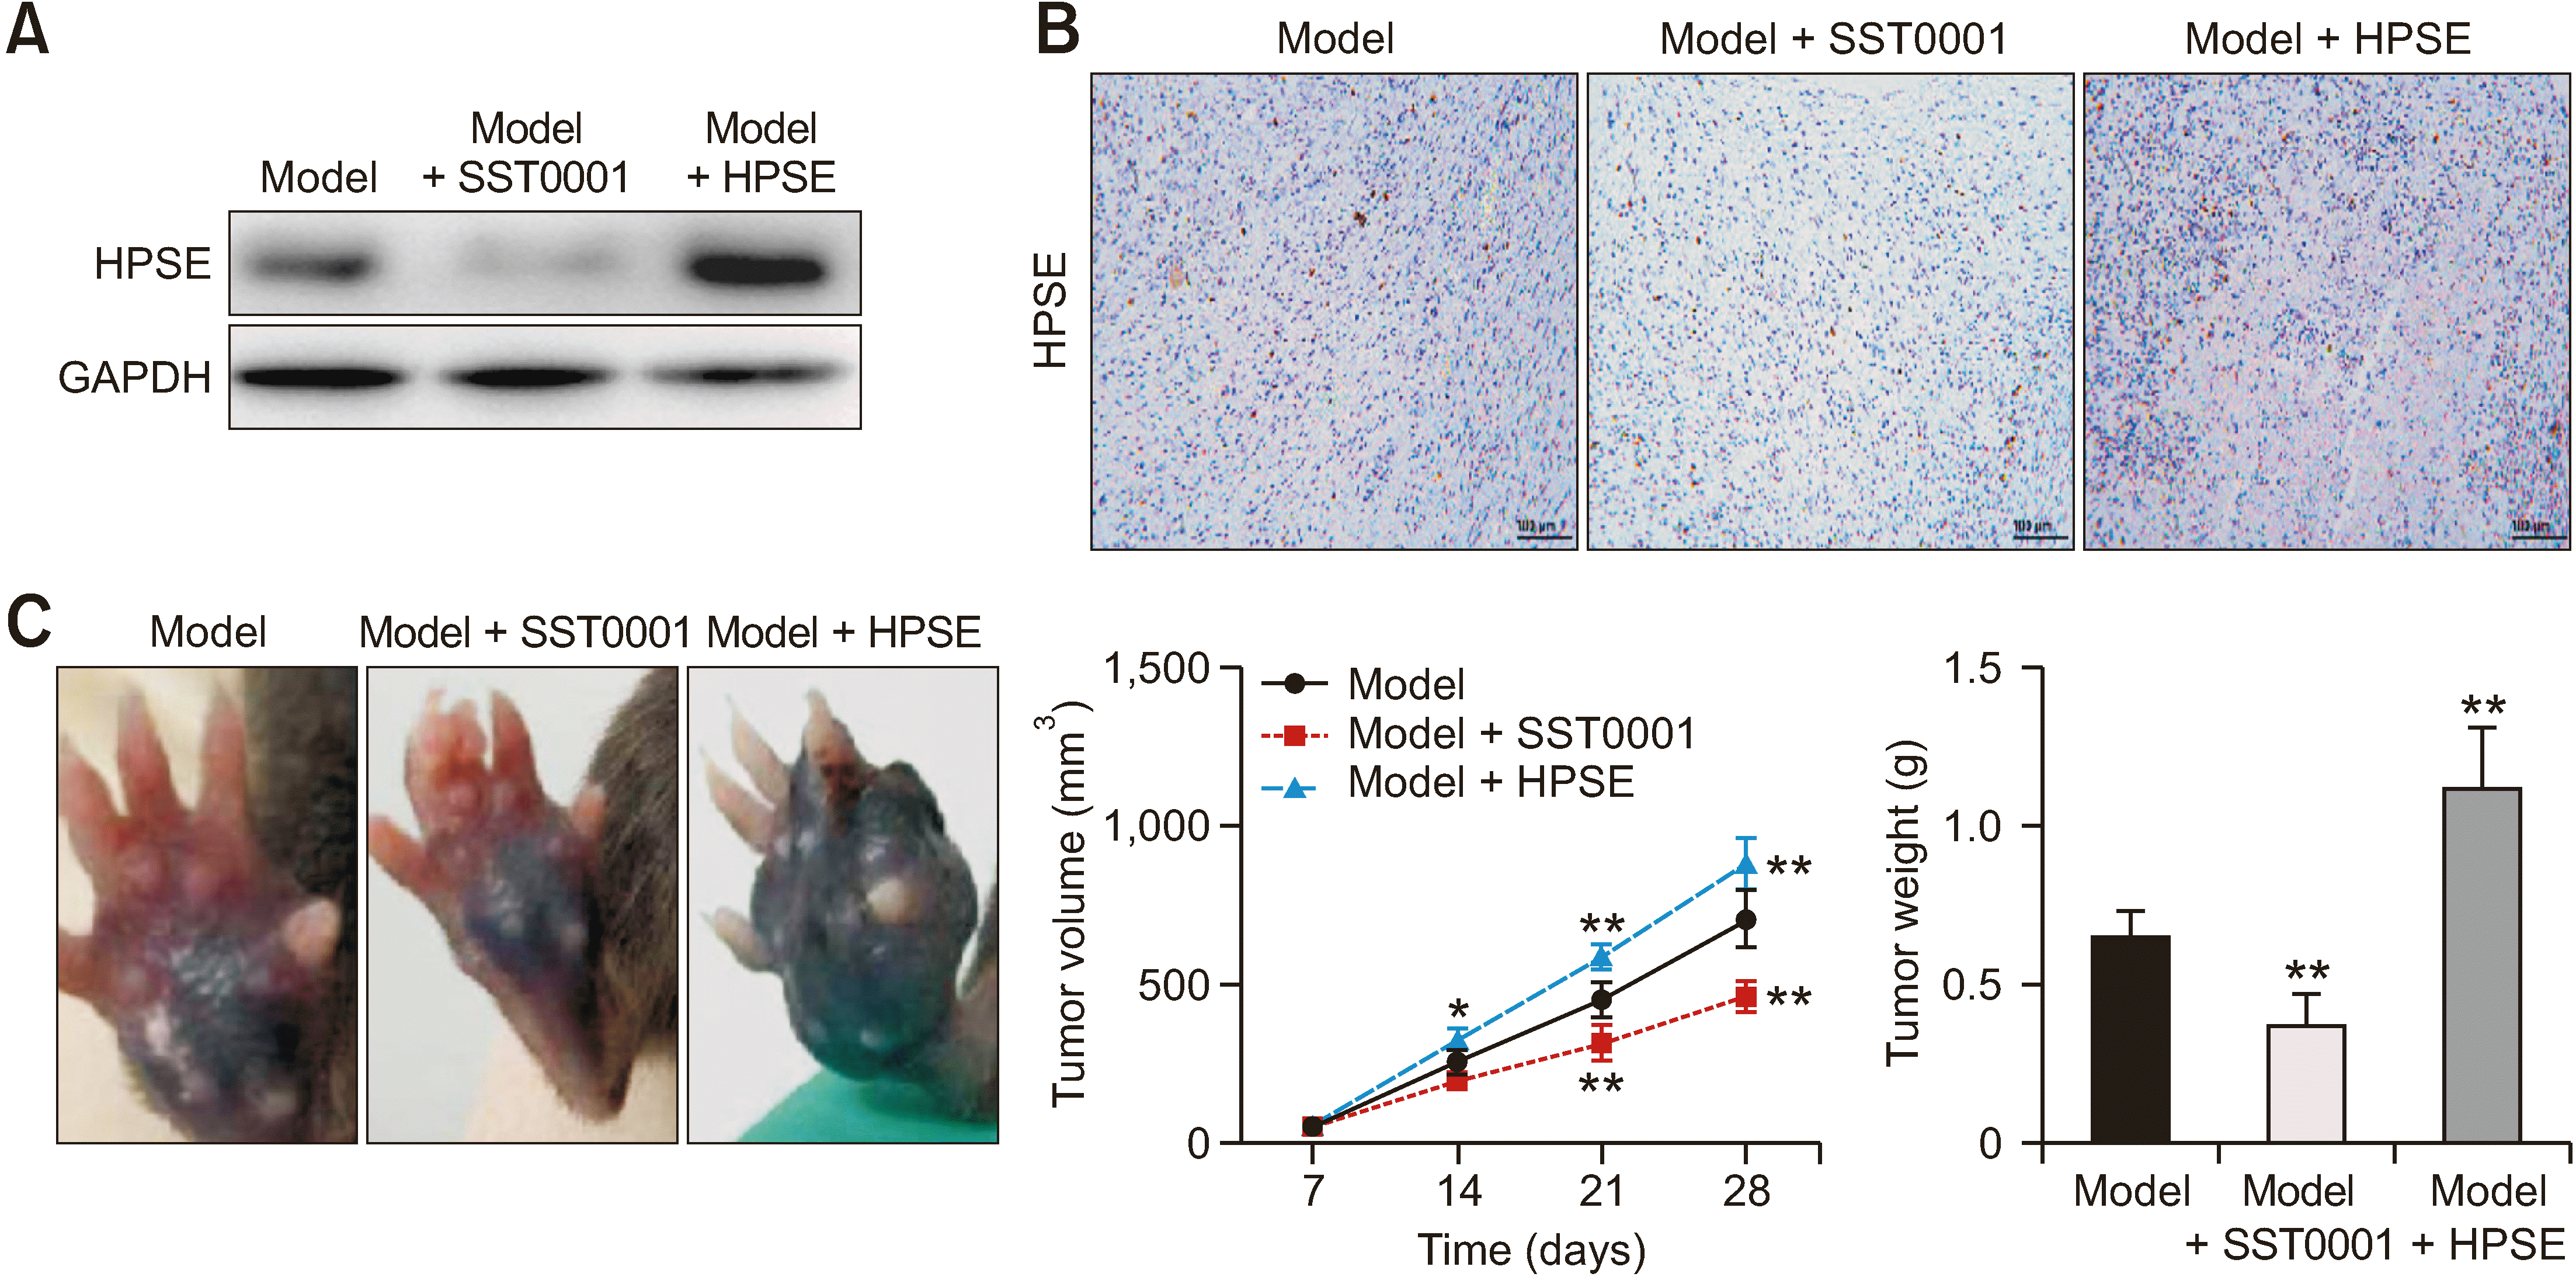 | Fig. 2Heparanase (HPSE) promotes tumor growth. (A) The expression of HPSE was detected by western blot after SST0001 or HPSE treatment. (B) HPSE in tumor tissues was detected by IHC (200×, scale bar = 100 μm). (C) Tumor volume and weight in different groups. *P < 0.05, **P < 0.01 versus model. The error bars indicate mean ± standard deviation. IHC: immunohistochemical.
|
3. HPSE promotes cancer pain in mice
Studies have reported that melanoma produces PD-L1 that effectively inhibits acute and chronic pain. Improvements in cancer pain symptoms may be associated with decreased levels of IL-1β, TNF-α, and PGE2. HPSE treatment increased the paw thickness, while SST001 reduced paw thickness (Fig. 3A, P < 0.010). HPSE treatment aggravated mechanical allodynia, cold response, and spontaneous pain, which was reversed by SST0001 (Fig. 3B–D, P < 0.010). The content of inflammatory cytokines (TNF-α, NF-κB, IL-6, and IL-1β) in tumor tissue and the sciatic nerve was increased by HPSE treatment, while it was reduced by SST0001 (Fig. 3E, F, P < 0.010). Furthermore, SST0001 increased PD-L1 level and decreased PGE2 level in the tumor tissues and sciatic nerves of model mice, while HPSE exhibited opposite results (Fig. 3G, H, P < 0.010).
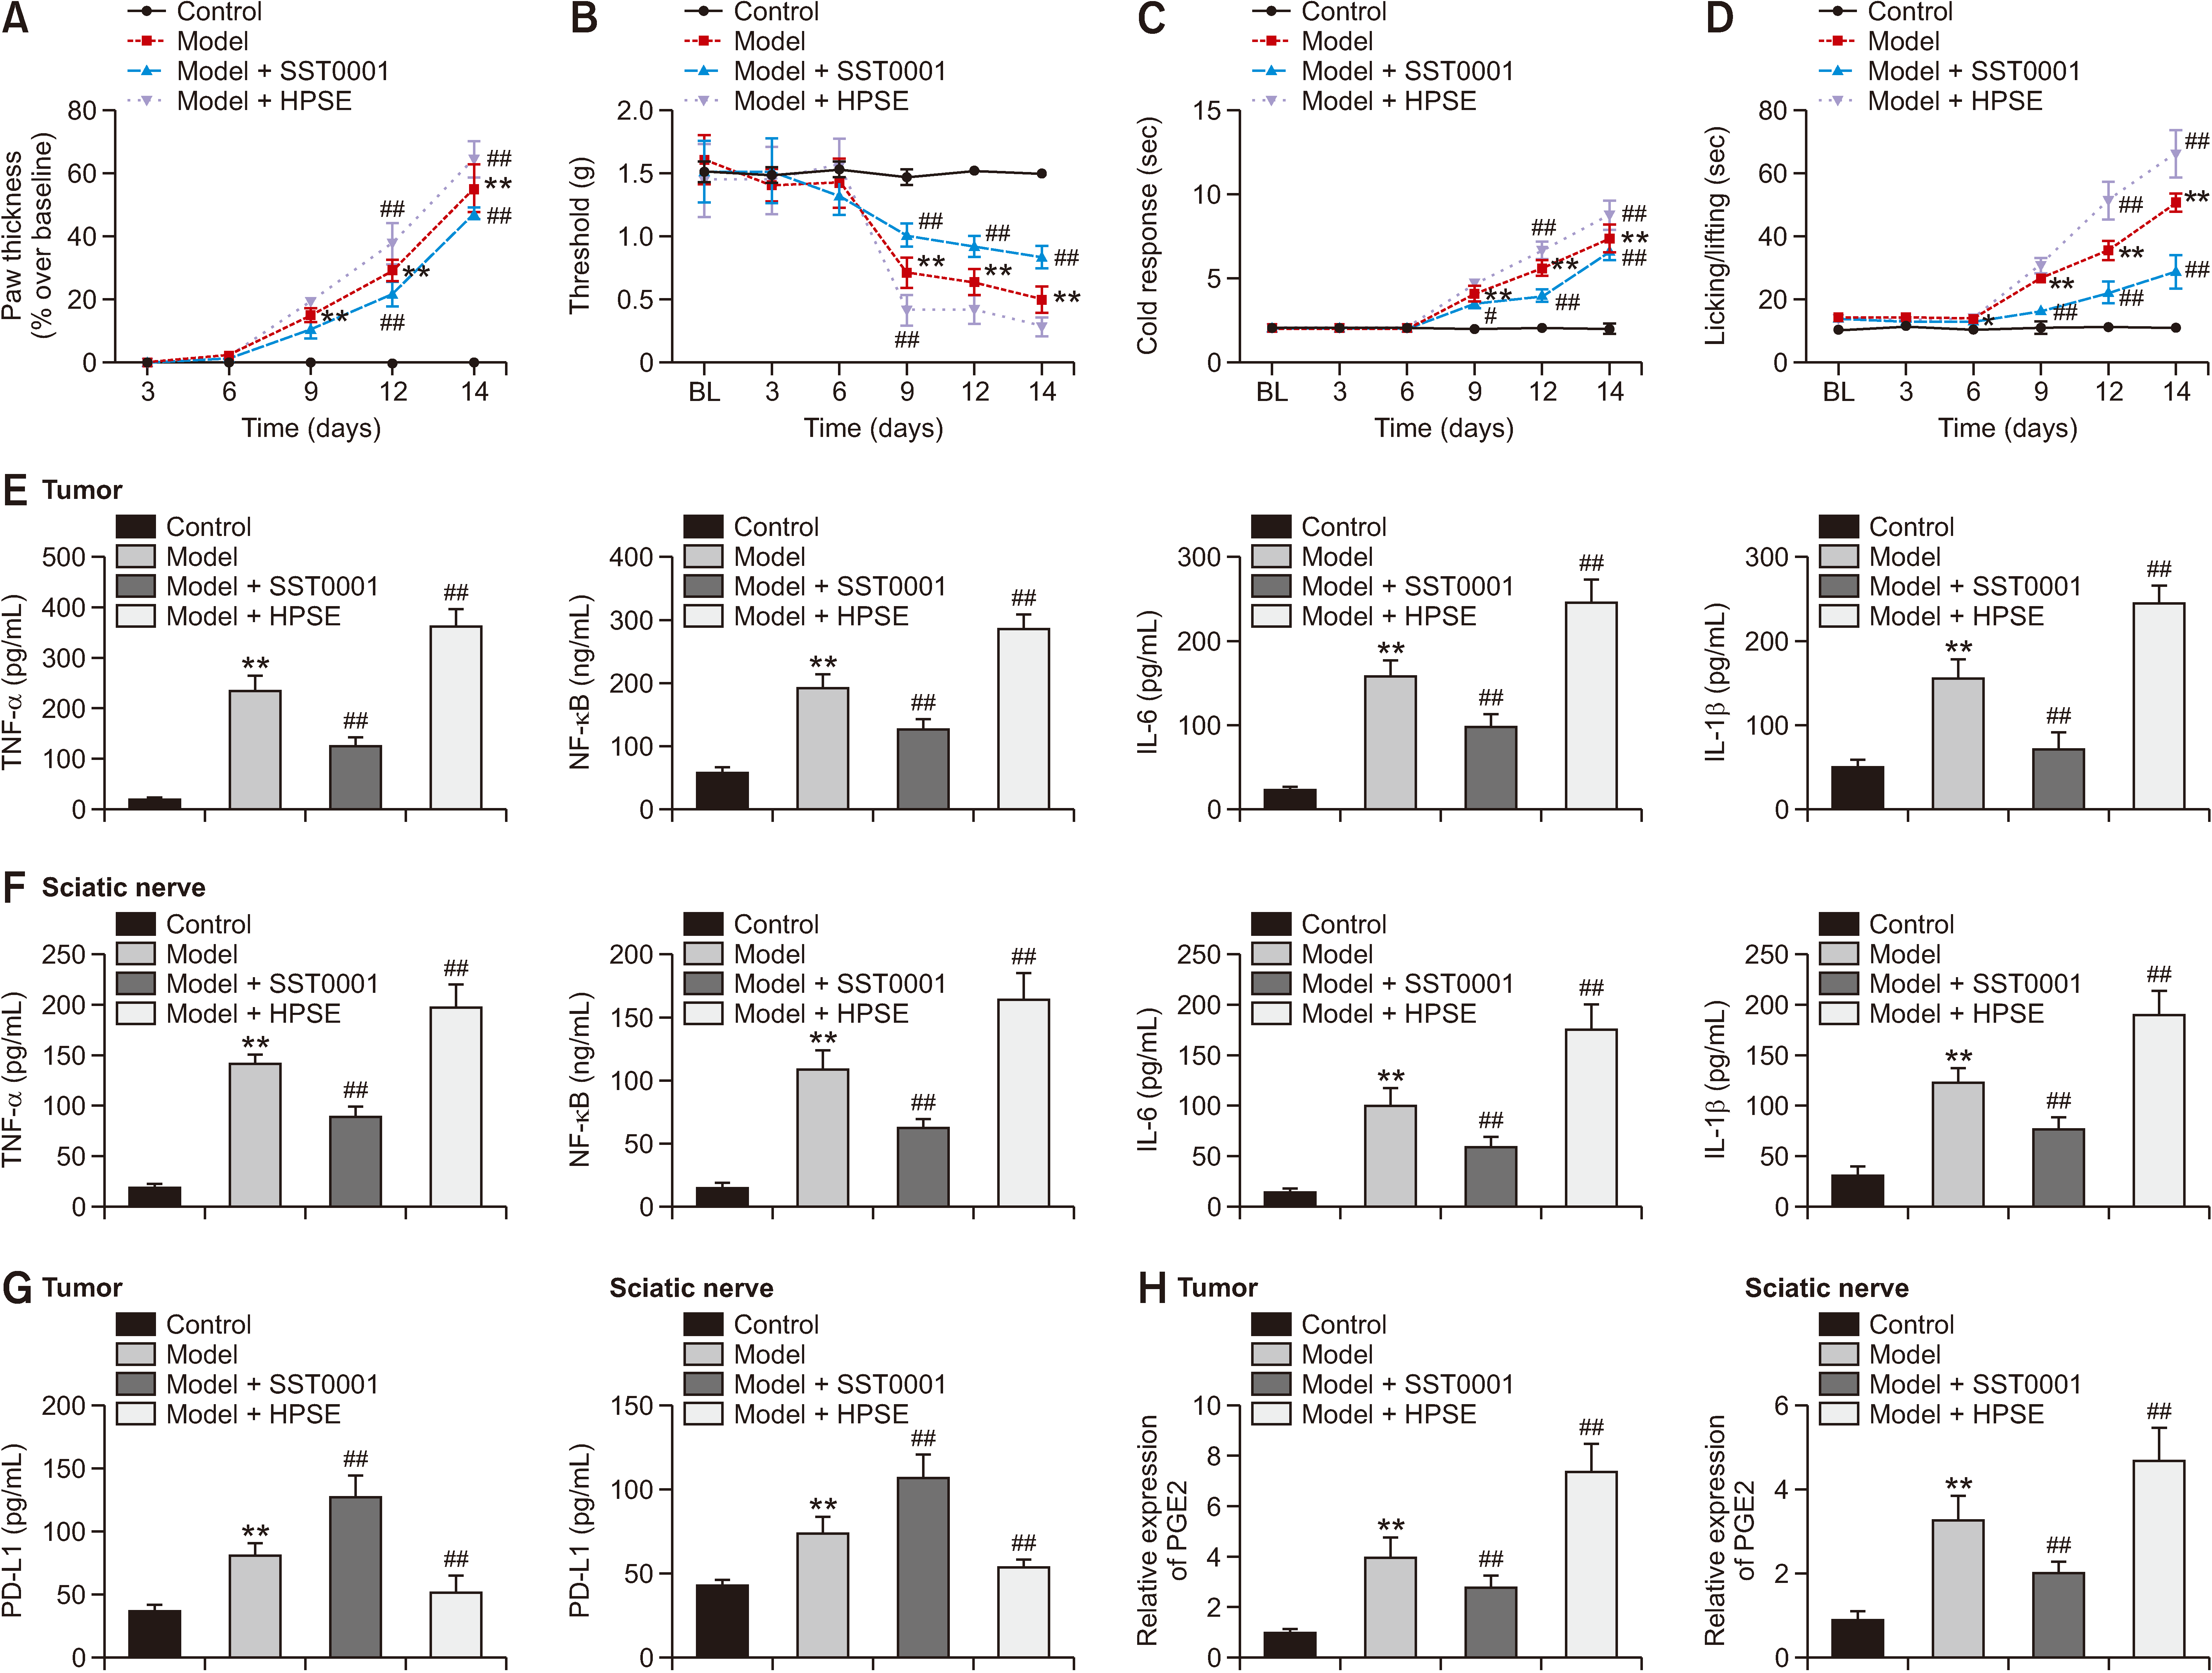 | Fig. 3Heparanase (HPSE) promotes cancer pain in mice. (A) Paw thickness. (B) Mechanical allodynia. (C) Cold response. (D) Spontaneous pain. (E–G) The content of TNF-α, NF-κB, IL-6, IL-1β, and PD-L1 were detected by ELISA assay. (H) PGE2 expression was detected by qRT-PCR. **P < 0.01 versus control. ##P < 0.01 versus model. The error bars indicate mean ± standard deviation. TNF-α: tumor necrosis factor-alpha, NF-κB: nuclear factor-κB, IL: interleukin, PD-L1: programmed death-ligand 1, PGE2: prostaglandin E2, ELISA: enzyme-linked immunosorbent assay, qRT-PCR: quantitative real-time polymerase chain reaction.
|
4. HPSE up-regulates NGF and is promoted by NGF feedback
The protein expression of NGF was significantly higher in the model mice than the controls (Fig. 4A, P < 0.001). In melanoma cells, HPSE treatment up-regulated the expression of NGF (Fig. 4B, C, P < 0.001). In addition, the efficiency of knockout or overexpression of NGF was detected by qRT-PCR (Fig. 4D, E, P < 0.010). HPSE was up-regulated after NGF overexpression (Fig. 4F, P < 0.010), while NGF silencing decreased the expression of HPSE (Fig. 4G, P < 0.010).
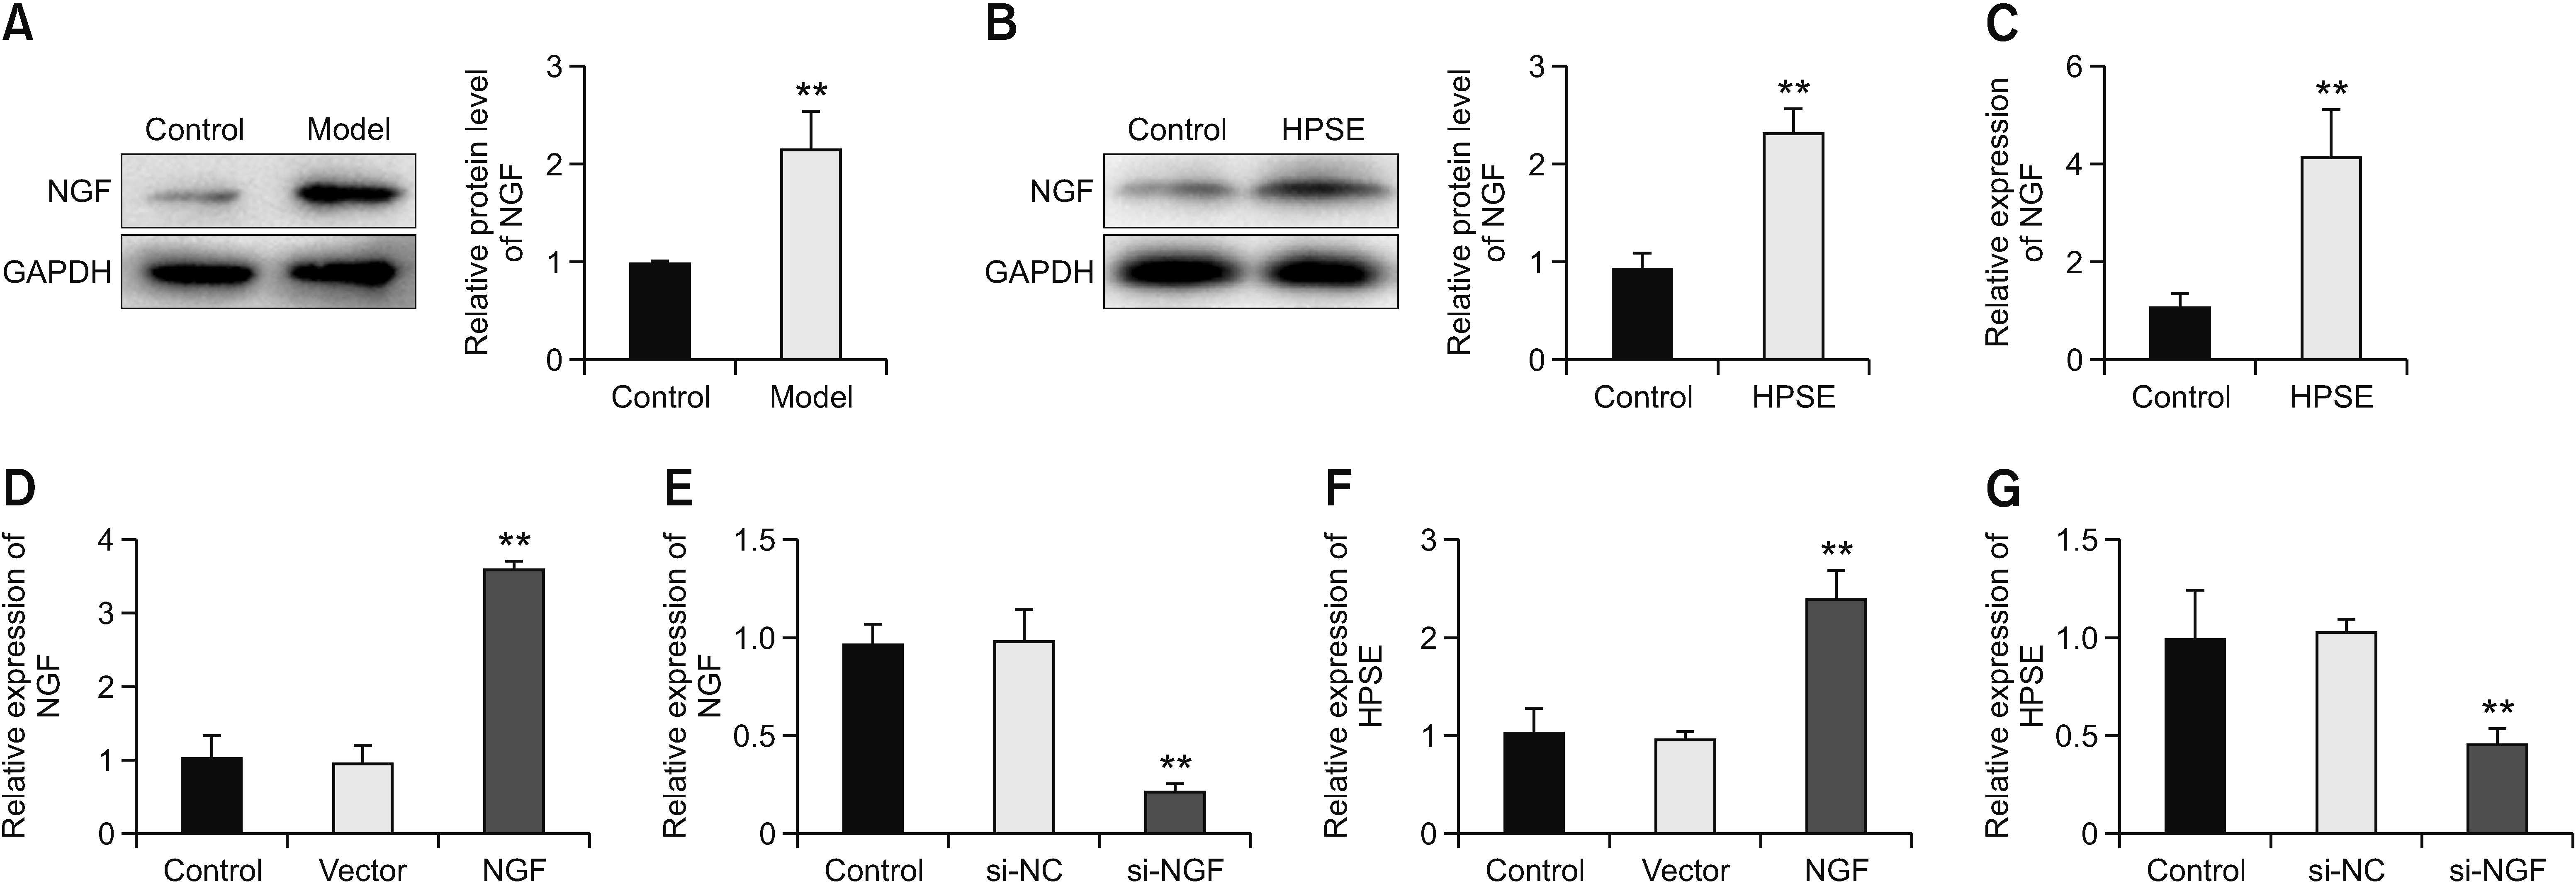 | Fig. 4Heparanase (HPSE) up-regulates nerve growth factor (NGF) and is promoted by NGF feedback. (A) The expression of NGF in the model and control mice was detected by western blot. (B, C) The expression of NGF was detected by western blot and qRT-PCR after HPSE treatment. **P < 0.01 versus control. (D) The expression of NGF was determined by qRT-PCR after NGF treatment. **P < 0.01 versus vector. (E) The expression of NGF was detected by qRT-PCR after NGF silencing. **P < 0.01 versus si-NC. (F) The expression of HPSE was detected by qRT-PCR after NGF treatment. **P < 0.01 versus vector. (G) The expression of HPSE was detected by qRT-PCR after NGF silencing.**P < 0.01 versus si-NC. The error bars indicate mean ± standard deviation. qRT-PCR: quantitative real-time polymerase chain reaction, si-NC: siRNA negative control.
|
5. High expression of NGF reverses the inhibition of SST0001 on the malignant phenotype of melanoma cells
To further explore the mechanism of HPSE on melanoma cells, cells were treated with exogenous NGF (100 ng/mL). The inhibition of SST0001 on cell viability and EdU-positive cells was reversed by NGF treatment (Fig. 5A, B, P < 0.010). Furthermore, high expression of NGF reversed the inhibition effect of SST0001 on migration and invasion of melanoma cells (Fig. 5C, P < 0.010).
 | Fig. 5High expression of nerve growth factor (NGF) reverses the inhibition of SST0001 on the malignant phenotype of melanoma cells. (A) Cell viability was measured by MTT assay in B16-F10 cells. (B) The proliferation of melanoma cells was detected by the EdU detection kit (200×, scale bar = 100 μm). (C) Transwell assay was used to determine cell migration and invasion (200×, scale bar = 200 μm). *P < 0.05, **P < 0.01 versus control. #P < 0.05, ##P < 0.01 versus SST0001. The error bars indicate mean ± standard deviation. MTT: 3-[4,5-dimethyl-2-thiazolyl]-2,5 diphenyl-2H-tetrazolium bromide, EdU: 5-Ethynyl-20-deoxyuridine.
|
6. HPSE promotes cancer pain in mice by interacting with SDC1
SST0001 treatment reduced the level of SDC1 (Fig. 6A, P < 0.001). A decreased expression of SDC1 was also observed by IHC in tumor tissues of SST0001-treated mice (Fig. 6B, P < 0.010). The injection of Ad-SDC1 significantly increased the mRNA expression of SDC1 in SST0001-treated model mice (Fig. 6C, P < 0.010). In addition, to explore the role of SDC1, SDC1-loaded adeno-associated virus (Ad-SDC1) was transplanted into mice. SDC1 reversed the effects of SST0001 on inhibiting cancer pain, evidenced by enhanced paw thickness, mechanical allodynia, cold response, and spontaneous pain (Fig. 6D–G, P < 0.010). The content of inflammatory cytokines in tumor tissue and the sciatic nerve was reduced by SST0001 treatment, while it was increased by SDC1 (Fig. 6H, I, P < 0.010). Furthermore, SDC1 reversed the effects of SST0001 on increasing PD-L1 level and decreasing PGE2 level in tumor tissue and the sciatic nerve (Fig. 6J, K, P < 0.010).
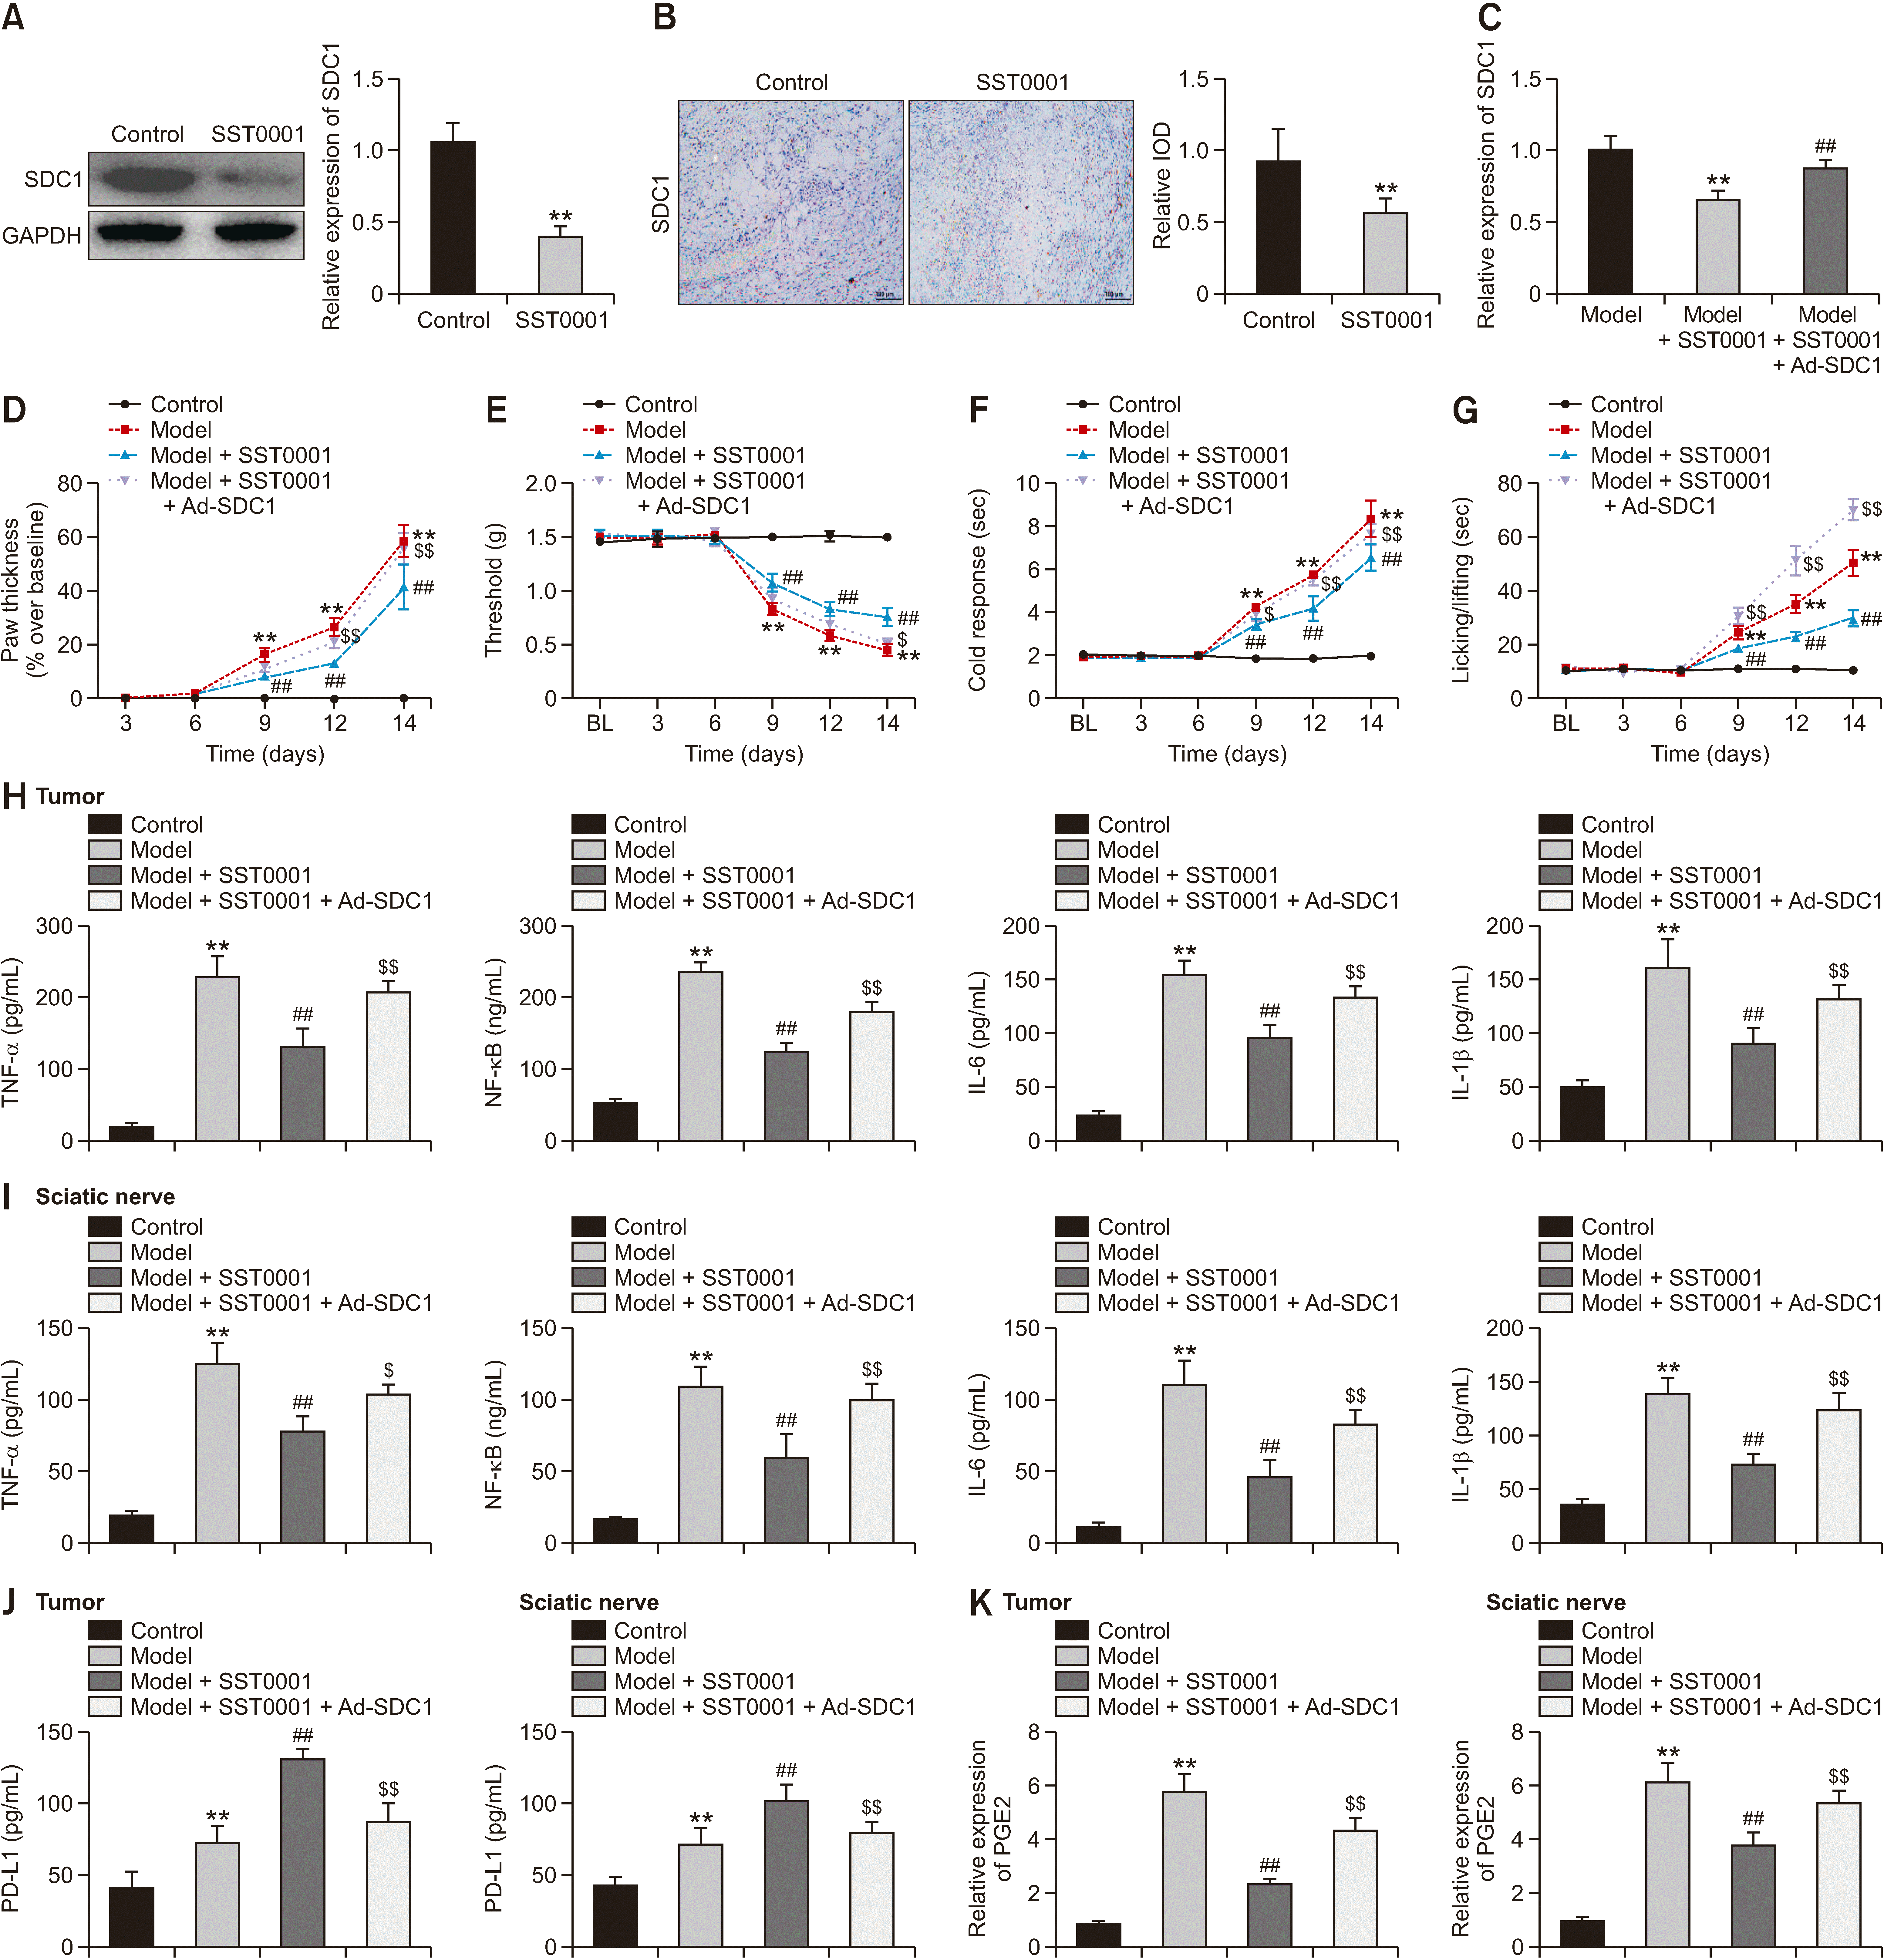 | Fig. 6Heparanase (HPSE) promotes cancer pain in mice by interacting with Syndecan-1 (SDC1). (A) The expression of SDC1 was detected by western blot after SST0001 treatment. (B) SDC1 in tumor tissues was detected by IHC (200×, scale bar = 100 μm). (C) The expression of SDC1 was detected by qRT-PCR after the treatment of Ad-SDC1 and/or SST0001. (D) Paw thickness. (E) Mechanical allodynia. (F) Cold response. (G) Spontaneous pain. (H–J) The content of TNF-α, NF-κB, IL-6, IL-1β, and PD-L1 were determined by ELISA assay. (K) PGE2 expression was detected by qRT-PCR. **P < 0.01 versus control. ##P < 0.01 versus model. $P < 0.05, $$P < 0.01 versus Model + SST0001. The error bars indicate mean ± standard deviation. IHC: immunohistochemical, qRT-PCR: quantitative real-time polymerase chain reaction, TNF-α: tumor necrosis factor-alpha, NF-κB: nuclear factor-κB, IL: interleukin, PD-L1: programmed death-ligand 1, PGE2: prostaglandin E2, ELISA: enzyme-linked immunosorbent assay, IOD: integrated optical density.
|
Go to :
DISCUSSION
Patients with cancer usually present spontaneous pain, allodynia, and hyperalgesia, which contribute to a lower quality of life [19]. The regulation of invasion, migration, and metastasis of cancer cells is closely related to innate immune signaling molecules and inflammatory factors [20]. In this study, the findings suggested that HPSE promoted the malignant development of melanoma cells, inflammatory response, and cancer pain by acting on NGF and SDC1.
Studies have shown that overexpression of HPSE helps promote tumor growth, metastatic spread, angiogenesis, and inflammation [21]. HPSE modulates gene expression and stimulates signal transduction pathways through enzymatic and non-enzymatic responses, thereby regulating inflammation, tumor survival, and growth by affecting various regulatory pathways [22–24]. HPSE regulates growth factors, which not only promote tumor growth, but can also up-regulate HPSE expression [25,26]. Knockdown or activity inhibition of HPSE prevents circulating tumor cell cluster formation and inhibits breast cancer metastasis, suggesting that targeting the function of HPSE in cancer cell dissemination may limit metastatic progression [27]. Knockout of HPSE or HPSE-inhibiting compound significantly attenuates tumor progression to treat tumor-bearing mice, suggesting anti-HPSE potential to treat multiple types of cancer [23]. Barash et al. [28] have reported that mesothelioma tumor growth is markedly attenuated by HPSE silencing and HPSE inhibitors. Clinically, HPSE levels can distinguish malignant from benign pleural effusion in a patient, and HPSE is associated with patient survival [28]. Amplified expression of HPSE in tumor cells leads to activation of NF-κB, thereby promoting chemotherapy resistance and aggressive tumor phenotype [29]. In this study, HPSE promoted cell viability, proliferation, migration, and the invasion of melanoma cells, as well as promoted tumor growth and cancer pain in the mouse model, while SST0001 treatment exhibited the opposite effect. Taken together, these findings suggested that inhibition of HPSE can inhibit melanoma development and cancer pain.
NGF has been reported to be a marker of tumor progression and may be a potential target for cancer therapy. NGF has been shown to stimulate the proliferation of pancreatic ductal adenocarcinoma cell lines, and NGF is important in promoting the growth and invasion of pancreatic ductal adenocarcinoma [30]. TNF-α activates Schwann cells which release pro-nociceptive mediators such as NGF, and NFG is associated with cancer proliferation, progression, and the pain of oral cancer [31]. The expression of NGF is markedly up-regulated in liver cancer and is involved in tumor cell motility and polarity, as well as apoptosis [32]. NGF and its receptor tropomyosin receptor kinase A are up-regulated in the progression of epithelial ovarian cancer, and they can promote cell proliferation, tumor formation, and metastasis [33]. Overexpressed NGF in cervical cancer is associated with an increased grade in cervical squamous cell carcinomas, suggesting that targeting NGF has potential therapeutic value in this cervical cancer subtype [34]. In this research, HPSE increased NGF expression, and silenced NGF down-regulated HPSE expression, suggesting this maintains a constant positive feedback loop. The inhibitory effects of SST0001 on the cell viability, proliferation, migration, and invasion of melanoma cells were reversed by exogenous NGF, indicating that HPSE promotes melanoma cell development by acting on NGF.
SDC1 has multiple functions in regulating cell migration, proliferation, and survival [35], SDC1 down-regulation promotes tumor growth in a mouse model of colitis-induced colon cancer [36]. Inhibition of SDC1 shedding from intestinal epithelial cells reduces intestinal inflammation by inhibiting the activation of NF-κB and down-regulating pro-inflammatory factors [37]. SDC1 knockdown reduces cytokines such as IL-6 and IL-8, and is a promising therapeutic target for inflammatory breast cancer [38]. SDC1 silencing significantly inhibits cell growth, migration, invasion, and tumor growth, thereby inhibiting the progression of pancreatic cancer [39]. In addition, the HPSE-1/SDC1 axis plays an important role in regulating tumorigenesis and progression [40]. HPSE-1 can degrade the heparan sulfate chain of SDC1, and the HPSE-1/SDC1 axis exerts a critical role in the lymphatic metastatic microenvironment during hepatocellular carcinogenesis [40]. In this study, SST0001 reduced SDC1 expression, while overexpression of SDC1 reversed the inhibitory effects of SST0001 on inflammatory factors and cancer pain. Therefore, the authors suggest that HPSE may regulate cancer pain by interacting with SDC1.
This study indeed has some limitations. First, the detail function of NGF on cancer pain is not explored. Second, whether the HPSE/SDC1/NGF axis is involved in the regulation of chemotherapy-induced neuropathic pain or radiotherapy-induced pain relief remains unclear. Third, in deep mechanisms of the HPSE/SDC1/NGF axis involving the transduction, transmission, modulation, and perception of cancer pain need to be further explored. Lastly, the regulatory role of the HPSE/SDC1/NGF axis in inflammation-mediated pathological changes and cachexia in cancer is still not clear. Further research in these fields is urgently needed.
In conclusion, exogenous HPSE may regulate cell viability, proliferation, migration, invasion, and tumor growth, as well as promote cancer pain in a mouse model, while SST0001 treatment inhibits this malignant development. Furthermore, HPSE up-regulated NGF, and NGF feedback promotes HPSE, and high expression of NGF reversed the inhibitory effect of HPSE down-regulation on cell phenotype deterioration. HPSE promoted cancer pain in mice by interacting with SDC1. These findings provide new insights into inhibiting melanoma development and relieving cancer pain.
Go to :
 XML Download