Journal List > J Korean Neurosurg Soc > v.66(1) > 1516080587

Jeong, Choi, Kim, and KNTDB Investigators: Comparison of Outcomes at Trauma Centers versus Non-Trauma Centers for Severe Traumatic Brain Injury

Abstract

Objective

Traumatic brain injury (TBI) is one of the most common injuries in patients with multiple trauma, and it associates with high post-traumatic mortality and morbidity. A trauma center was established to provide optimal treatment for patients with severe trauma. This study aimed to compare the treatment outcomes of patients with severe TBI between non-trauma and trauma centers based on data from the Korean Neuro-Trauma Data Bank System (KNTDBS).

Methods

From January 2018 to June 2021, 1122 patients were enrolled in the KNTDBS study. Among them, 253 patients from non-traumatic centers and 253 from trauma centers were matched using propensity score analysis. We evaluated baseline characteristics, the time required from injury to hospital arrival, surgery-related factors, neuromonitoring, and outcomes.

Results

The time from injury to hospital arrival was shorter in the non-trauma centers (110.2 vs. 176.1 minutes, p=0.012). The operation time was shorter in the trauma centers (156.7 vs. 128.1 minutes, p=0.003). Neuromonitoring was performed in nine patients (3.6%) in the non-trauma centers and 67 patients (26.5%) in the trauma centers (p<0.001). Mortality rates were lower in trauma centers than in non-trauma centers (58.5% vs. 47.0%, p=0.014). The average Glasgow coma scale (GCS) at discharge was higher in the trauma centers (4.3 vs. 5.7, p=0.011). For the Glasgow outcome scale-extended (GOSE) at discharge, the favorable outcome (GOSE 5–8) was 17.4% in the non-trauma centers and 27.3% in the trauma centers (p=0.014).

Conclusion

This study showed lower mortality rates, higher GCS scores at discharge, and higher rates of favorable outcomes in trauma centers than in non-trauma centers. The regional trauma medical system seems to have a positive impact in treating patients with severe TBI.

INTRODUCTION

Trauma is the third leading cause of death in South Korea and, in particular, the number one cause of death for people under 45 years, including the economically active population [17]. Accordingly, the Ministry of Health and Welfare carried out the regional trauma center selection project in 2012 to lower the preventable trauma death rate to the level of advanced countries. As of 2022, 17 regional trauma centers have been designated and operated. A regional trauma center was established to provide optimal treatment for patients with severe trauma with facilities, equipment, and human resources [19].
Traumatic brain injury (TBI) is defined as brain trauma with specific characteristics that include at least one of the following : loss of consciousness, post-traumatic amnesia, disorientation, confusion, or, in more severe cases, neurological signs [2]. TBI accounts for the highest proportion of severe trauma patients, with an injury severity score of 15 or higher [8]. Severe TBI is defined as a Glasgow coma scale (GCS) score ≤8; both primary and secondary brain injuries are significant causes of brain damage and death after severe TBI [9,16].
The Korea Neuro-Trauma Data Bank Committee collected 2617 TBI cases using the Korean Neuro-Trauma Data Bank System (KNTDBS), in which 23 university hospitals participated from 2010 to 2014 and reported the research results [6,10,23]. However, the study was conducted before trauma centers were established nationwide. For the follow-up study, KNTDBS collected data on patients with severe TBI from 2018 to 2021 from 18 hospitals across the country, including trauma centers.
We aimed to compare outcomes between non-trauma and trauma centers in patients with severe TBI based on data from the KNTDBS.

MATERIALS AND METHODS

This retrospective study was approved by the Clinical Research Ethics Review Committee of Gachon University Gil Medical Center (GBIRB2021-303). As this was a retrospective study, The Clinical Research Ethics Review Committee waived the need for informed consent. All methods were performed according to the relevant guidelines and regulations of the Declaration of Helsinki.

Patient selection

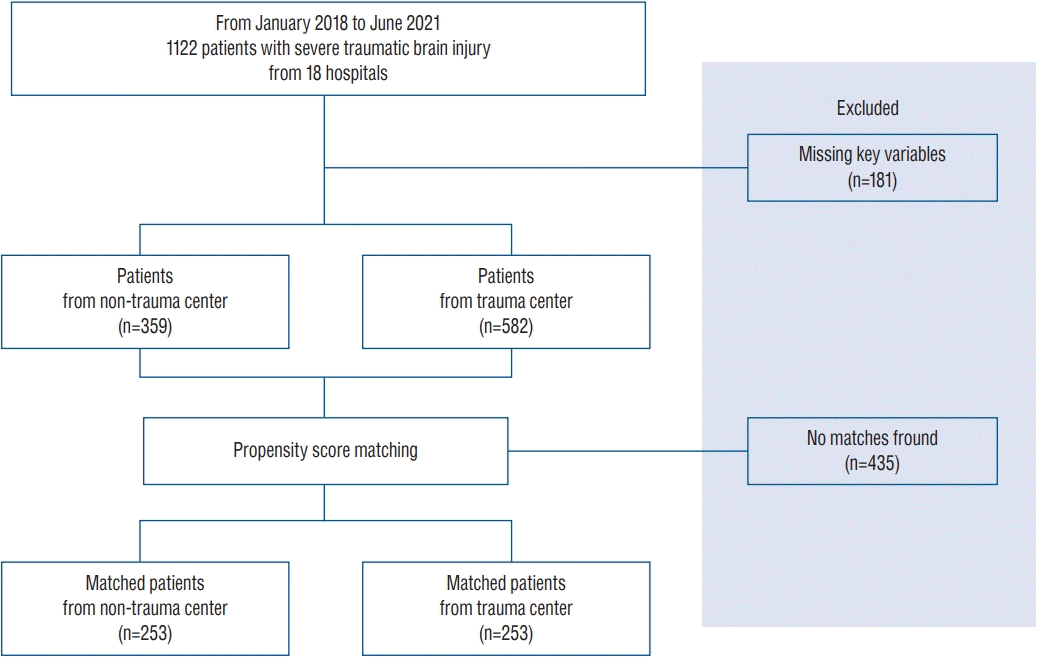
We performed a retrospective analysis of 1122 patients enrolled in KNTDBS from 18 hospitals between January 2018 and June 2021. Among patients with TBI, those with a GCS score of 8 or less and 19 years of age or older were included in the KNTDBS, and those who had previously undergone head surgery were excluded. Of the 1122 patients, 181 with insufficient data were excluded, and 359 patients from 11 non-trauma centers and 582 from seven trauma centers were included in the study. We performed propensity score matching to minimize differences in baseline characteristics between the non-trauma and trauma centers. We compared 253 patients from non-trauma centers and 253 from trauma centers, after excluding 435 patients who were not matched (Fig. 1).

Data analysis

Data on sex, age, injury mechanism, initial vital signs, initial GCS score, initial pupil response, diagnosis, and Rotterdam computed tomography (CT) score upon admission to the emergency room were collected to compare baseline characteristics. The vital signs included body temperature, systolic/ diastolic blood pressure, pulse rate, and respiratory rate. The most severe case was determined to be representative when a patient had multiple diagnoses. Representative diagnoses include subdural hematoma (SDH), epidural hematoma, intracerebral hemorrhage/contusion, subarachnoid hemorrhage (SAH), diffuse axonal injury, and skull fracture. The Rotterdam CT score is composed of a final score of 1–6 by adding 1 to the sum of scores for basal cisterns, midline shift, epidural mass lesions, and intraventricular blood or traumatic SAH [14].
In comparing the time required between both centers, the time from injury to hospital arrival and from hospital arrival to brain CT was evaluated for all subjects. The time from injury to surgery and hospital arrival to surgery was evaluated for patients who underwent surgery. The start time of surgery was measured based on the skin incision.
The operation type, operation time, estimated blood loss (EBL), blood transfusion, and postoperative complications were assessed as variables related to surgery. These variables were evaluated in patients who visited the emergency room and immediately underwent surgery, including craniectomy or craniotomy. The operation time was measured from the skin incision to skin closure. EBL was measured based on the anesthesiologist's record, and transfusion was measured in milliliters of red blood cells received during surgery. The occurrence of hemorrhage requiring surgery and surgical site infection (SSI) was evaluated as postoperative complications. Neuromonitoring was performed with respect to patient management. The neuromonitoring types included intracranial pressure (ICP) monitoring, transcranial Doppler, and electroencephalogram (EEG).
Hospital stay, mortality, GCS score at discharge, and Glasgow outcome scale-extended (GOSE) score at discharge were evaluated to compare outcomes. Unfavorable outcomes were defined as GOSE 1–4 points and favorable outcomes as GOSE 5–8 points.

Statistical analysis

Continuous variables were described using means, standard deviations, and ranges, while categorical variables were expressed as frequencies. Also, continuous variables were compared using independent and paired t-tests, while categorical variables were compared using Pearson's chi-square, McNemar, and McNemar-Bowker tests. All tests were performed using the statistical significance criterion of α=0.05. Propensity score matching analysis was performed to control for and minimize potential bias. Variables for propensity matching analysis included age, sex, initial vital signs, initial pupil response, initial GCS score, diagnosis, and Rotterdam CT score. Both groups, including the non-trauma and trauma center patients, were matched 1 : 1 based on the propensity score, with a standard caliper width of 0.1. Statistical analyses were performed using SPSS for Windows (version 23.0; IBM Corp., Armonk, NY, USA).

RESULTS

Baseline characteristics

The baseline characteristics were analyzed before and after propensity score matching. Before propensity score matching, variables including age, injury mechanism, body temperature, pulse rate, initial pupil response, initial GCS score, and diagnosis were significantly different between non-trauma and trauma centers. After propensity score matching, there were no differences in the baseline characteristics between the two groups. Slips were the most common injury mechanism in both centers, and more than half of the patients showed bilateral unreactive pupils. The average initial GCS score was 5.4, and the initial Rotterdam CT score was 4.1. The most common initial diagnosis when the patients visited the non-trauma or trauma centers was acute SDH (Table 1).

The time required

The time from injury to hospital arrival was significantly shorter in the non-trauma centers : 110.2 minutes for the non-trauma centers and 176.1 minutes for the trauma centers (p=0.012). There was no difference between the centers regarding the time from hospital arrival to brain CT. In the patients who underwent surgery, the time from injury to surgery was significantly shorter in the non-trauma centers : 270.2 minutes in the non-trauma centers and 389.8 in the trauma centers (p=0.006). The time from hospital arrival to surgery was shorter in the trauma centers : 181.1 minutes in the non-trauma centers and 147.9 in the trauma centers (p=0.051) (Table 2).

Surgery-related factors

After visiting the emergency room, 102 patients in the non-trauma centers and 104 patients in the trauma centers underwent emergency surgery; regarding the type of surgery, craniectomy accounted for >70% of the cases in both centers. The operation time was significantly shorter in the trauma centers : 156.7 minutes in the non-trauma centers and 128.1 in the trauma centers (p=0.003). EBL and transfusion did not differ between the centers. Postoperative complications, including hemorrhage occurrence and SSI, did not differ between centers (Table 3).

Neuromonitoring

Neuromonitoring was performed in nine patients (3.6%) in the non-trauma centers and 67 patients (26.5%) in the trauma centers (p<0.001). In the non-trauma centers, only ICP monitoring was performed in all nine patients. ICP monitoring was the most common in the trauma centers, with 27 patients (10.7%), followed by EEG (7.5%). Two or more types of neuromonitoring were performed in 5.6% of patients (Table 4).

Outcomes

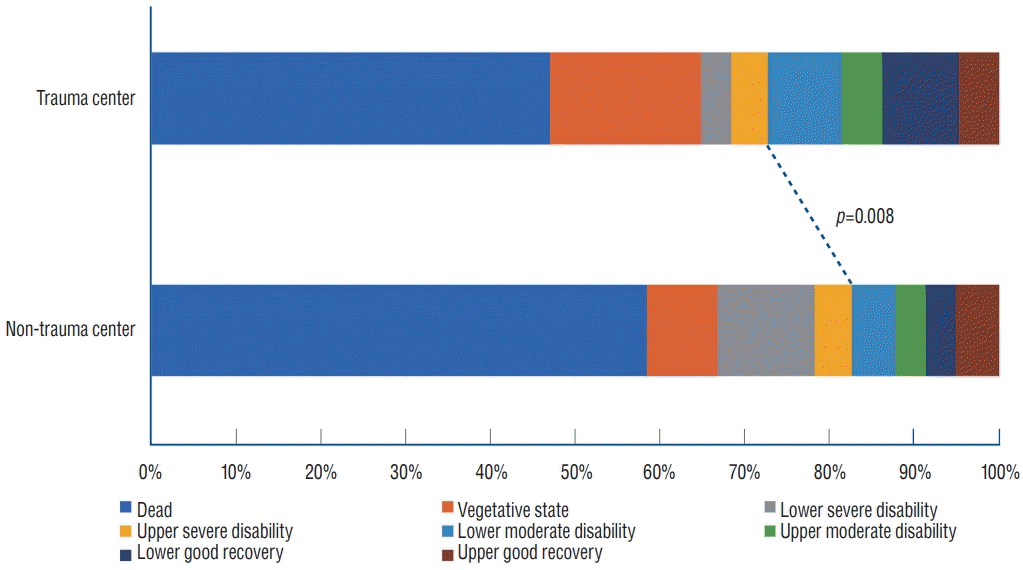
The hospital stay was 37.7 days in the non-trauma centers and 30.1 in the trauma centers; there was no difference between the centers. Mortality was significantly lower in the trauma centers (47.0%) than in the non-trauma centers (58.5%) (p=0.014). The average GCS score at discharge was significantly higher in the trauma centers : 4.3 in the non-trauma centers and 5.7 in the trauma centers (p=0.011). For GOSE at discharge, the unfavorable outcomes (GOSE 1–4) were 82.6% in the non-trauma centers and 72.7% in the trauma centers. Favorable outcomes (GOSE 5–8) accounted for 17.4% of cases in the non-trauma centers and 27.3% in the trauma centers (p=0.014) (Fig. 2 and Table 5).

DISCUSSION

Trauma centers in South Korea are distributed nationwide to enable patients with severe trauma to be treated within an hour anywhere in the country [19]. The advantages offered by trauma center care may be related to the treatment intensity, experience, or care coordination. Trauma centers have staff, resources, and protocols designed to care for injured patients [3,12]. At trauma centers, multidisciplinary treatment is provided by trauma specialists in various fields, including neurosurgery, emergency medicine, general surgery, and thoracic surgery. In addition, trauma centers in South Korea operate dedicated facilities for trauma, including a CT room, operating room, angiography room, and intensive care unit. And professional trauma personnel, including trauma nurse specialists and coordinators, participate in patient care and the construction of the national trauma system data.
Patients with severe TBI are treated according to established TBI guidelines [4,7,20]. However, there may be differences in clinical outcomes depending on the systematic differences between non-trauma and trauma centers. Several studies have compared the outcomes between both centers [3,9,12]. Kaufman et al. [12] analyzed the data of 62198 patients with severe and isolated head injuries. They reported that favorable discharge was 5.8% higher, and mortality of patients over 65 years was 3.4% lower in the trauma centers than in the non-trauma centers. DuBose et al. [5] compared the American College of Surgeons-designated level 1 and 2 trauma centers. They reported that level 2 centers showed higher mortality rates, higher rates of complications, and higher rates of progression of an initial neurological insult than level 1 centers. In our study, the trauma centers showed lower mortality rates, higher GCS scores at discharge, and higher rates of favorable outcomes than the non-trauma centers. Variables such as age, GCS, injury mechanism, and time to surgery have been reported to be related to outcomes in patients with TBI [1,18,24,25]. However, controllable factors are associated with pre-hospital and hospital care after injury. Analyzing and improving these factors is significant for lowering mortality and improving outcomes in patients with severe TBI. In this study, we evaluated controllable factors related to outcomes by comparing non-trauma and trauma centers and found that some variables were associated with outcomes.
Regarding the time required, the time from injury to hospital arrival was approximately an hour longer in the trauma center. Jung et al. [11] reported that the percentage of direct visits to all patients, including non-trauma and trauma centers, was 67.6%. Park [19] reported that the admission route to the trauma centers was 60.7% direct visits and 38.4% transfers. Based on these results, the ratio of transfers for the admission route was higher in trauma centers than in non-trauma centers. This may be the leading cause of increased time from injury to hospital arrival.
For the same reason, it is thought that the time from injury to surgery is longer in trauma centers. However, the time from hospital arrival to surgery was approximately 30 minutes shorter in the trauma centers. The trauma centers receive prior contact from paramedics for direct visits and from control centers for transfers. Therefore, immediate treatment can be initiated because trauma specialists stay in advance before the patient arrives at the trauma center. In addition, if surgery or angiography is needed, it can be rapidly performed because there are dedicated operating and angiography rooms for traumas available at all times. These factors can reduce the time from hospital arrival to surgery.
In patients who underwent surgery, the operation time was approximately 30 minutes shorter in the trauma centers than in the non-trauma centers. In trauma centers, trauma-specialized neurosurgeons perform surgery. In addition, a trauma team consisting of neurosurgeons, anesthesiologists, and nurses participated in the overall treatment of patients from the emergency room through surgery to the intensive care unit. Although there may be a bias according to the surgeon's experience, it is thought that the composition, teamwork, and collaboration of trauma-specialized human resources significantly influenced the reduction in operation time.
Neuromonitoring plays an important role in TBI management because it can assess multiple aspects of cerebral physiology and guide therapeutic interventions to prevent or minimize secondary injury [13,15,22]. Various monitoring techniques are available for clinical use, including ICP, cerebral oxygenation, cerebral autoregulation, cerebral blood flow, cerebral microdialysis, and electroencephalography [22]. In this study, the rate of neuromonitoring for the overall cohort was as low as 15%. However, various neuromonitoring procedures were performed in the trauma centers rather than non-trauma centers. Neuromonitoring of patients with severe TBI is mainly performed in the intensive care unit. This study showed that neuromonitoring could be performed actively in the trauma centers because various types of monitoring equipment related to trauma were more available in the trauma intensive care unit.

Study limitations

This study has some limitations. First, we could not identify the number of patients with TBI who were not registered in the KNTDBS database; therefore, we cannot rule out the possibility of a selection bias in our data. Further, we could not analyze only patients with isolated TBI because of the lack of evaluation of other injury sites. To get accurate results, the patients who injured other sites except the head should be excluded from the study because the patients with severe TBI often have multiple injuries, and severe damage to other sites can significantly affect the outcomes. Collecting data on damage to other sites in future data bank systems is necessary. Additionally, the items used to evaluate the outcomes were insufficient. Various items inf luencing TBI outcomes can be evaluated, such as the period of intensive care unit stay, period of ventilator use, disability rating scale score, and functional independence measure score [21]. This can provide diverse and accurate analyses of the outcomes of patients with severe TBI.

CONCLUSION

A trauma center was established to provide optimal treatment for patients with severe trauma based on facilities, equipment, and human resources. We found lower mortality rates, higher GCS scores at discharge, and higher rates of favorable outcomes in trauma centers than in non-trauma centers. There were also differences between non-trauma and trauma centers in terms of the operation time, application of neuromonitoring, and the time from injury to hospital arrival, injury to surgery, and hospital arrival to surgery. The regional trauma medical system seems to have a significant positive effect in treating patients with severe TBI.

Notes

Conflicts of interest

No potential conflict of interest relevant to this article was reported.

Informed consent

This type of study does not require informed consent.

Author contributions

Conceptualization : TSJ, DHC, KNTDB; Data curation : TSJ, DHC; Formal analysis : TSJ; Funding acquisition : TSJ; Methodology : TSJ; Project administration : KNTDB; Visualization : TSJ; Writing - original draft : TSJ; Writing - review & editing : TSJ, DHC, WKK

Data sharing

None

Preprint

None

ACKNOWLEDGMENTS

This work was supported by the Gachon University research fund of 2020 (GCU-2020-202005430001).
Authors are thankful to members of the KNTDB investigators : Jung Hwan Lee (Pusan National University Hospital), In Bok Chang (Hallym University Sacred Heart Hospital), Ki Seong Eom (Wonkwang University Hospital), Eun Sung Park (Wonkwang University Hospital), Jong Yeon Kim (Wonju Severance Christian Hospital), Min Kyun Na (Hanyang University Medical Center), Jeong Ho Lee (Daegu Fatima Hospital), Kwang Wook Jo (Bucheon St. Mary's Hospital), Han Seung Ryu (Chonnam National University Hospital), Kyung Hwan Kim (Chungnam National University Hospital), Yu Deok Won (Hanyang University Guri Hospital), Min Su Kim (Ulsan university hospital), Jin Gyu Choi (Yeouido St. Mary's Hospital), Sae Min Kwon (Keimyung University Hospital), Jae Sang Oh (Soonchunhyang University Hospital), and Soon O Hong (Seoul Medical Center).

References

1. Albanèse J, Leone M, Alliez JR, Kaya JM, Antonini F, Alliez B, et al. Decompressive craniectomy for severe traumatic brain injury: evaluation of the effects at one year. Crit Care Med. 31:2535–2538. 2003.
2. American Psychiatric Association. Diagnostic and statistical manual of mental disorders. ed 5. Arlington: American Psychiatric Association;2013.
3. ATLS Subcommittee; American College of Surgeons’ Committee on Trauma; International ATLS working group. Advanced trauma life support (ATLS®): the ninth edition. J Trauma Acute Care Surg. 74:1363–1366. 2013.
4. Carney N, Totten AM, O'Reilly C, Ullman JS, Hawryluk GW, Bell MJ, et al. Guidelines for the management of severe traumatic brain injury, fourth edition. Neurosurgery. 80:6–15. 2017.
5. DuBose JJ, Browder T, Inaba K, Teixeira PG, Chan LS, Demetriades D. Effect of trauma center designation on outcome in patients with severe traumatic brain injury. Arch Surg. 143:1213–1217. discussion 1217. 2008.
6. Eom KS. Epidemiology and outcomes of traumatic brain injury in elderly population : a multicenter analysis using Korean Neuro-Trauma Data Bank System 2010-2014. J Korean Neurosurg Soc. 62:243–255. 2019.
7. Finfer SR, Cohen J. Severe traumatic brain injury. Resuscitation. 48:77–90. 2001.
8. Han SS, Jung K, Kwon J, Kim J, Choi SC, Lee KJ. Problems with transferring major trauma patients to emergency medical center of a university hospital from another medical center. J Trauma Inj. 24:118–124. 2011.
9. Hesdorffer DC, Ghajar J. Marked improvement in adherence to traumatic brain injury guidelines in United States trauma centers. J Trauma. 63:841–847. discussion 847-848. 2007.
10. Jeong HW, Choi SW, Youm JY, Lim JW, Kwon HJ, Song SH. Mortality and epidemiology in 256 cases of pediatric traumatic brain injury: Korean Neuro-Trauma Data Bank System (KNTDBS) 2010-2014. J Korean Neurosurg Soc. 60:710–716. 2017.
11. Jung K, Kim I, Park SK, Cho H, Park CY, Yun JH, et al. Preventable trauma death rate after establishing a national trauma system in Korea. J Korean Med Sci. 34:e65. 2019.
12. Kaufman EJ, Ertefaie A, Small DS, Holena DN, Delgado MK. Comparative effectiveness of initial treatment at trauma center vs neurosurgerycapable non-trauma center for severe, isolated head injury. J Am Coll Surg. 226:741–751.e2. 2018.
13. Kirkman MA, Smith M. Multimodality neuromonitoring. Anesthesiol Clin. 34:511–523. 2016.
14. Maas AI, Hukkelhoven CW, Marshall LF, Steyerberg EW. Prediction of outcome in traumatic brain injury with computed tomographic characteristics: a comparison between the computed tomographic classification and combinations of computed tomographic predictors. Neurosurgery. 57:1173–1182. discussion 1173-1182. 2005.
15. Makarenko S, Griesdale DE, Gooderham P, Sekhon MS. Multimodal neuromonitoring for traumatic brain injury: a shift towards individualized therapy. J Clin Neurosci. 26:8–13. 2016.
16. Marshall LF. Head injury: recent past, present, and future. Neurosurgery. 47:546–561. 2000.
17. Park CY, Yu B, Kim HH, Hwang JJ, Lee J, Cho HM, et al. PARK index for preventable major trauma death rate. J Trauma Inj. 28:115–122. 2015.
18. Park JH, Park JE, Kim SH, Lim YC, You NK, Ahn YH, et al. Outcomes of ultra-early decompressive craniectomy after severe traumatic brain injury-treatment outcomes after severe TBI. Korean J Neurotrauma. 10:112–118. 2014.
19. Park JM. Outcomes of the support services for the establishment of regional level 1 trauma centers. J Korean Med Assoc. 59:923–930. 2016.
20. Rosenfeld JV, Maas AI, Bragge P, Morganti-Kossmann MC, Manley GT, Gruen RL. Early management of severe traumatic brain injury. Lancet. 380:1088–1098. 2012.
21. Shukla D, Devi BI, Agrawal A. Outcome measures for traumatic brain injury. Clin Neurol Neurosurg. 113:435–441. 2011.
22. Smith M. Multimodality neuromonitoring in adult traumatic brain injury: a narrative review. Anesthesiology. 128:401–415. 2018.
23. Song SY, Lee SK, Eom KS; KNTDB Investigators. Analysis of mortality and epidemiology in 2617 cases of traumatic brain injury : Korean Neuro-Trauma Data Bank System 2010-2014. J Korean Neurosurg Soc. 59:485–491. 2016.
24. Ucar T, Akyuz M, Kazan S, Tuncer R. Role of decompressive surgery in the management of severe head injuries: prognostic factors and patient selection. J Neurotrauma. 22:1311–1318. 2005.
25. Wilberger JE Jr, Harris M, Diamond DL. Acute subdural hematoma: morbidity, mortality, and operative timing. J Neurosurg. 74:212–218. 1991.

Fig. 1.
Patient selection.
jkns-2022-0163f1.tif
Fig. 2.
Comparison of Glasgow outcome scale-extended at discharge.
jkns-2022-0163f2.tif
Table 1.
Baseline characteristics (before and after propensity score matching)
Before propensity score matching
After propensity score matching
Non-trauma center (n=359) Trauma center (n=582) p-value Non-trauma center (n=253) Trauma center (n=253) p-value
Age (years) 62.7±16.6 57.0±17.8 <0.001 62.2±17.1 62.6±15.8 0.773
Sex, female 86 (24.0) 142 (24.4) 0.878 60 (23.7) 64 (25.3) 0.764
Injury mechanisms <0.001 0.935
Slip down 134 (37.3) 94 (16.2) 93 (36.8) 89 (35.2)
Fall 43 (12.0) 152 (26.1) 33 (13.0) 28 (11.1)
Traffic accident 94 (26.2) 272 (46.7) 77 (30.4) 81 (32.0)
Assault 5 (1.4) 8 (1.4) 5 (2.0) 4 (1.6)
Etc. 24 (6.7) 5 (0.9) 5 (2.0) 5 (2.0)
Unknown 59 (16.4) 51 (8.8) 40 (15.8) 46 (18.2)
Initial vital sign
Body temperature 36.4±0.9 36.1±0.9 <0.001 36.4±0.8 36.4±0.9 0.913
Systolic blood pressure 142.9±34.9 139.0±40.5 0.118 142.8±36.3 143.5±38.9 0.819
Diastolic blood pressure 82.9±21.1 84.6±22.8 0.244 83.1±20.8 83.0±20.8 0.967
Pulse rate 90.5±23.1 95.6±26.0 0.002 89.0±21.8 88.4±23.5 0.789
Respiratory rate 20.5±5.1 21.0±14.7 0.393 20.5±5.3 20.4±14.8 0.904
Initial pupil response 0.011 0.583
Reactive pupils 129 (35.9) 212 (36.4) 98 (38.7) 95 (37.5)
Unilateral unreactive pupils 27 (7.5) 78 (13.4) 21 (8.3) 16 (6.3)
Bilateral unreactive pupils 197 (54.9) 289 (49.7) 131 (51.8) 139 (54.9)
Uncheckable 6 (1.7) 3 (0.5) 3 (1.2) 3 (1.2)
Initial GCS 5.4±1.8 5.1±1.7 0.007 5.4±1.8 5.4±1.7 0.811
Diagnosis <0.001 0.764
aSDH 236 (65.7) 335 (57.6) 164 (64.8) 161 (63.6)
EDH 37 (10.3) 43 (7.4) 25 (9.9) 27 (10.7)
ICH/contusion 32 (8.9) 53 (9.1) 24 (9.5) 21 (8.3)
SAH 43 (12.0) 69 (11.9) 33 (13.0) 40 (15.8)
DAI 9 (2.5) 64 (11.0) 6 (2.4) 3 (1.2)
Skull fracture 2 (0.6) 18 (3.1) 1 (0.4) 1 (0.4)
Initial Rotterdam CT score 4.1±1.2 4.1±1.4 0.691 4.1±1.2 4.2±1.4 0.795

Values are presented as the mean±standard deviation or number (%). GCS : Glasgow coma scale, aSDH : acute subdural hematoma, EDH : epidural hematoma, ICH : intracerebral hemorrhage, SAH : subarachnoid hemorrhage, DAI : diffuse axonal injury, CT : computed tomography

Table 2.
Comparison of time required
All patients
Patients who underwent surgery
Non-trauma center (n=253) Trauma center (n=253) p-value Non-trauma center (n=102) Trauma center (n=104) p-value
Time from injury to hospital arrival (minutes) 110.2±136.8 176.1±387.3 0.012
Time from hospital arrival to brain CT (minutes) 37.6±63.8 44.3±119.0 0.434
Time from injury to surgery (minutes) 270.2±153.3 389.8±404.5 0.006*
Time from hospital arrival to surgery (minutes) 181.1±162.1 147.9±45.2 0.051

Values are presented as the mean±standard deviation. CT : computed tomography

Table 3.
Comparison of patients who underwent surgery
Non-trauma center (n=102) Trauma center (n=104) p-value
Operation type 0.719
 Craniectomy 77 (75.5) 82 (78.8)
 Craniotomy 25 (24.5) 22 (21.2)
Operation time (minutes) 156.7±68.4 128.1±61.3 0.003
Estimated blood loss (mL) 1466.5±1229.7 1277.0±1379.3 0.352
Transfusion (mL) 857.6±991.5 819.7±1260.2 0.850
Postoperative complications
 Occurrence of hemorrhage* 18 (17.6) 16 (15.4) 0.710
 Surgical site infection 3 (2.9) 0 (0.0) 0.250

Values are presented as the mean±standard deviation or number (%).

* Hemorrhages including subdural hematoma, epidural hematoma, and intracerebral hemorrhage requiring surgery

Table 4.
Neuromonitoring
Non-trauma center (n=253) Trauma center (n=253) p-value
Neuromonitoring <0.001
 No 244 (96.4) 186 (73.5)
 Yes 9 (3.6) 67 (26.5)
  TCD 0 (0.0) 7 (2.7)
  EEG 0 (0.0) 19 (7.5)
  ICP monitor 9 (3.6) 27 (10.7)
  TCD + EEG 0 (0.0) 10 (4.0)
  TCD + ICP monitor 0 (0.0) 3 (1.2)
  TCD + ICP monitor + EEG 0 (0.0) 1 (0.4)

Values are presented as numbers (%). TCD : transcranial Doppler, EEG : electroencephalogram, ICP : intracranial pressure

Table 5.
Comparison of outcomes
Non-trauma center (n=253) Trauma center (n=253) p-value
Hospital stay (days) 37.7±78.0 30.1±49.3 0.189
Death 0.014
 No 105 (41.5) 134 (53.0)
 Yes 148 (58.5) 119 (47.0)
GCS at discharge 4.3±5.7 5.7±6.2 0.011
GOSE at discharge 0.014
 Unfavorable outcome (GOSE 1–4) 209 (82.6) 184 (72.7)
 Favorable outcome (GOSE 5–8) 44 (17.4) 69 (27.3)

Values are presented as the mean±standard deviation or number (%). GCS : Glasgow coma scale, GOSE : Glasgow outcome scale-extended

TOOLS
Similar articles