

 PDF
PDF Citation
 Print
Print


Introduction
Radiotherapy reduces recurrence and improves overall survival in patients with an advanced abdominopelvic malignancy [1]. However, the toxicity of radiation treatment restricts the maximum dose that can be given. Exposure of the intestine to ionizing radiation (IR) induces inflammation and results in the rapid apoptosis of stem cells [2]. Crypt disturbance results from the destruction of these stem cells. At high doses, damage to the crypt results in functional abnormalities, which have the clinical phenotypes of acute bowel reactions [3]. In particular, tumor treatment may be complicated by IR-induced complications in the gastrointestinal tract. Radiotherapy as a treatment for malignant abdominopelvic disease frequently results in acute radiation-induced enterocolitis [4]. Despite the high incidence of these IR-associated problems, there are no well-established preventive or therapeutic strategies.
Rebamipide, an amino acid derivative of 2(1H)-quinolinone, is widely used as a gastric mucosal protective agent. Rebamipide has been shown to have anti-inflammatory properties; it is a free radical scavenger, suppresses proinflammatory cytokine production, inhibits inflammatory cell migration, and promotes mucus and prostaglandin production [5]. However, the detailed molecular mechanisms underlying its protective effects against intestinal inflammation remain unclear. Sucralfate is thought to act by upregulating endogenous prostaglandin and/or by a mucosal coating effect. In addition, sucralfate has been reported to have a protective effect on acute radiation-induced colitis [6], but its mechanisms of action remain to be determined.
Scientists developing radioprotective agents for the small intestine have primarily focused on modifiers of inflammation, antioxidants, regulators of intestinal epithelial cell (IEC) apoptosis, and growth factors. However, according to recent evidence, manipulation of the intestinal microbiota may provide prophylactic effects on radiation enterocolitis. Therefore, antibiotics have been considered as a treatment option for radiation enterocolitis [7]. However, the mechanism of the interaction between the intestinal microbiota and radiation therapy remains to be clarified. Rifaximin is not absorbed in the gastrointestinal mucosa; rather, a high concentration is observed in the lumen of the gastrointestinal tract [8]. Therefore, rifaximin has been a potential therapeutic candidate for radiation enterocolitis.
It is clear that IR affects the normal tissues of the intestine; however, few studies have investigated drugs and their regulatory pathways that could potentially protect intestinal tissues against IR-induced inflammation and apoptosis. Our aims in this study were therefore to evaluate whether rebamipide, sucralfate, or rifaximin have suppressive effects on acute IR-induced inflammation and apoptosis in the large and small intestines of a mouse model of IR-induced intestinal injury and to determine the underlying mechanisms [9,10].
Go to : 
Methods
Ethics statements: This study was approved by the Institutional Animal Care and Use Committee of Kosin University College of Medicine, Busan, Korea (2009-11-17).
1. Chemicals
Sodium carbonate (Na2CO3), sodium chloride (NaCl), potassium chloride (KCl), naphthylethylenediamine dihydrochloride (NED), ethanol, and methanol were purchased from Merck (Merck KGaA, Darmstadt, Germany). Visfatin, ethylenediaminetetraacetic acid (EDTA), sodium phosphate monobasic (NaH2PO4), sodium phosphate dibasic (Na2HPO4), dimethyl sulfoxide (DMSO), 4,5-diaminofluorescein (DAF-2), 3-morpholinosydnonimine hydrochloride (SIN-1), diethylenetriamine-pentaacetic acid (DTPA), Tris base, and trichloroacetic acid (TCA) were obtained from Sigma Chemical Co. (St. Louis, MO, USA). Agarose and Coomassie brilliant blue R-250 were purchased from Promega (Madison, WI, USA). The CellTiter 96 colorimetric assay kit was from Promega. The NucBuster and PROPREP protein extraction kits were from Novagen (Darmstadt, Germany). Protein extraction solution was supplied by Intron Biotechnology (Seongnam, Korea). The polyvinylidene fluoride membrane and ECL kit were from Amersham Pharmacia Biotech (Buckinghamshire, UK). Mouse PGE2, TNF-α, IL-1β, IL-6, and human major capsid protein (MCP)-1 enzyme-linked immunosorbent assay (ELISA) kits were purchased from Endogen (Thermo Fisher Scientific Inc., Rockford, IL, USA). Anti-ICAM-1, goat anti-rabbit IgG-HRP, goat anti-mouse IgG-HRP, and donkey anti-goat IgG antibody were purchased from Santa Cruz Biotechnology (Santa Cruz, CA, USA). Anti-NAMPT, anti-SIRT, anti-iNOS, anti-COX, anti-ERK1/2, anti-phospho-ERK1/2, anti-JNK, anti-phospho-JNK, anti-p38, anti-phospho-p38, anti-Bax, anti-c-Myc, anti-Bcl-2, anti-Bcl-xL, anti-cytochrome C, anti-caspase-3, anti-caspase-7, and anti-β-actin antibodies were purchased from Cell Signaling Technology (Beverly, MA, USA). All other chemicals used were of analytical grade.
2. Animals
Thirty-six, 7-week-old male ICR mice (30 g; Daehan Bio Link, Eumseong, Korea) were kept in groups of three per cage in a temperature-controlled (24°C) vivarium under a 12-hour light/dark cycle (lights on from 7 am to 9 pm) and allowed formula M07 (Daehan Bio Link) and tap water ad libitum. Animals were housed in the Laboratory Animal Center of Kosin University College of Medicine. Food was removed 45 hours before sham or true irradiation, but water was still available. All animals were kept in a specific pathogen-free facility at the Animal Center in accordance with the rules and regulations of the Institutional Animal Care and Use Committee of our institute.
Thirty-six mice were randomly divided into six groups (n=6 per group): a control group vehicle-treated before sham irradiation (C) that received oral administration of 1 mL of vehicle only, a control group vehicle-treated before irradiation (RC) that received an oral administration of 1 mL of vehicle, a group rebamipide-treated before irradiation (RM) that received orally administered rebamipide at a dose of 320 mg/kg of body weight, a group sucralfate-treated before irradiation (RU) that received orally administered sucralfate at a dose of 500 mg/kg of body weight, a group rifaximin-treated before irradiation (RN) that received orally administered rifaximin at a dose of 100 mg/kg of body weight, and a control group rebamipide-treated before sham irradiation (M) that received orally administered rebamipide at a dose of 320 mg/kg of body weight.
All the prescribed doses of reagents were dissolved in normal saline (vehicle). Mice were gavaged with a 1 mL suspension per dose five times every 10 hours before the sham or true irradiation. Rebamipide was kindly provided by Otsuka Pharmaceutical Co., Ltd. (Seoul, Korea), rifaximin was provided by Alfa Wassermann S.p.A. (Alanno, Italy), and sucralfate was provided by Fuji Chemical Industry Co., Ltd. (Toyama, Japan).
This study protocol was approved by the Ethical Review Committee of our institute, and experimental procedures in this study adhered to the Declaration of Helsinki for the care and use of laboratory animals.
After removal of the intestines, the tissue samples were flushed briefly with ice-cold saline and placed on filter paper. The large and small intestines were prepared, weighed, and snap-frozen in liquid nitrogen. Samples were stored at –80°C until analysis.
3. Irradiation
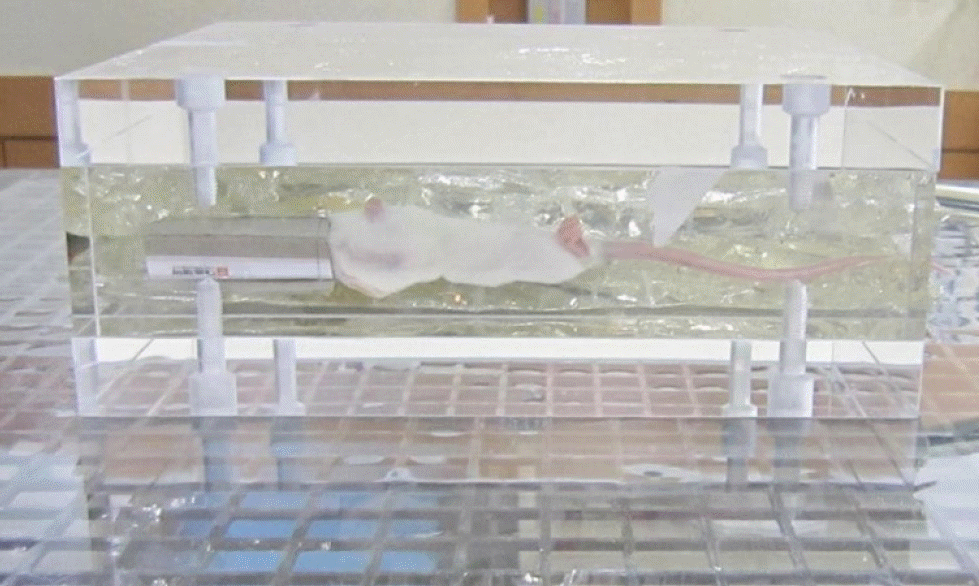
Irradiation was performed between 12:00 pm and 1:00 pm. Thirty-six mice were anesthetized with 7.5 mg ketamine hydrochloride (Yuhan Corporation, Seoul, Korea) and 2.5 mg xylazine hydrochloride (Bayer Korea Ltd., Seoul, Korea) per 100 g body weight by intraperitoneal injection. Sham-irradiated mice were also anesthetized under the same conditions. Three mice at a time were fixed in a supine position in the center of a specially designed, box-shaped, acrylic phantom containing two inner jelly-filled-bags to ensure density homogeneity (Fig. 1). A 6 MV photon beam from a Linac system (ClinaciX; Varian Medical Systems, Inc., Palo Alto, CA, USA) was delivered in the anterior to the posterior and the posterior to the anterior directions of the entire phantom after treatment planning to deliver a 4-Gy dose of radiation to the abdomen and pelvic region containing the large and small intestines in a uniform manner (Eclipse 8.1; Varian Medical Systems, Inc.).
4. NO production
The nitrite concentrations in the IR-treated mice were measured as an indicator of nitric oxide (NO) production using the Griess reagent system. A nitrite standard curve was made by making serial dilutions of nitrite solution with phosphate buffered saline (PBS) buffer. Fifty microliters of supernatant were added to wells and mixed with 50 μL of sulfanilamide solution, followed by a 5- to 10-minute incubation at room temperature in the dark. The same volume of NED (Merck KGaA) solution was added to all wells, followed by another 5 to 10 minutes incubation at room temperature in the dark. The absorbance of the mixture was measured at 540 nm with a microplate plate reader (Molecular Devices, Sunnyvale, CA, USA).
5. Enzyme-linked immunosorbent assays
The amounts of TNF-α, IL-1β, IL-6, PGE2, and MCP-1 were measured using the appropriate ELISA kits according to the manufacturer’s instructions for each kit.
6. Immunoblot analysis
Proteins were isolated from whole mice intestines using lysis buffer (PBS containing 0.05% Triton X-100, 0.15 M NaCl, 2 mM EDTA, 1 mM phenylmethylsulfonylfluoride, and 20 μg aprotinin/mL) for immunoblotting. Protein concentrations were determined using a commercial protein assay kit (Bio-Rad). Equal protein concentrations were subjected to 7.5%–12.5% sodium dodecyl sulfate-polyacrylamide gel electrophoresis and transferred onto polyvinylidene fluoride (PVDF) membranes (Amersham Pharmacia Biotech). After blocking the membranes with PBS containing 5% non-fat dry milk for 1 hour at room temperature, each membrane was incubated with a specific primary antibody overnight at 4℃. After washing twice with PBS containing 0.1% Tween-20 (PBST), each membrane was immunoblotted with horseradish peroxidase-conjugated anti-mouse, anti-rabbit, or anti-goat IgG antibodies (Santa Cruz Biotechnology) for 1 hour at room temperature, followed by washing three times in PBST and visualization by enhanced ECL (Amersham Pharmacia Biotech). Vision Works Image Software (UVP, Cambridge, UK) was used to measure band intensities.
7. Nuclear protein extraction and electrophoretic mobility shift assays
Nuclear proteins were extracted with slight modifications of the protocol described by Dignam et al. [11]. A portion of the large and small intestines was homogenized in buffer containing 0.6% IGEPAL, 0.15 M NaCl, 10 mM Tris-HCl (pH 7.9), 1 mM EDTA, and 0.1% protein inhibitor cocktail; vortexed; kept on ice for 5 minutes; and centrifuged at 500 ×g for 5 minutes at 4℃. Pelleted nuclei were resuspended in 60 mL of extraction buffer (10 mM Hepes [pH 7.9], 0.1 mM EDTA, 1.5 mM MgCl2, 420 mM NaCl, 25% glycerol, 1 mM dithiothreitol, and 0.33% protein inhibitor cocktail). Following gentle mixing and incubation on ice for 20 minutes, samples were centrifuged at 500 ×g for 5 minutes at 4℃. The supernatant was transferred to new tubes and stored at –70℃. The protein concentrations of the samples were determined using a commercial protein assay kit (Bio-Rad). For the electrophoretic mobility shift assay (EMSA), we end-labeled NF-κB-specific oligonucleotide with [γ-32P]-ATP using T4 polynucleotide kinase (Promega) and purified using a microspinG-25 column (Amersham Inc., Piscataway, NJ, USA). An EMSA was performed according to the accompanying instruction manual provided by Promega. Ten mg of nuclear protein and 2 to 4 mL of binding buffer were mixed and incubated for 10 minutes once. Then 1 mL of 32P-labeled NF-κB and 2 mL of loading buffer were added to the nuclear protein mixtures, followed by a 30-minute incubation at room temperature. DNA-protein complexes were separated from the unbound DNA probe by electrophoresis through 4% polyacrylamide gels using 0.5X Tris-borate-EDTA buffer (pH 8.0) as the running buffer. The gels were dried and exposed to an X-ray film for 2 hours at room temperature, and the bands were quantitated using Vision Works Image Software (UVP).
8. Statistical analysis
All experiments were performed at least three times by conducting each assay in triplicate. Data were analyzed using SPSS version 20.0 for Windows (IBM Corp., Armonk, NY, USA), and are expressed as the mean±standard deviation. The significance of differences between groups was evaluated using analysis of variance (Tukey test), and p<0.05 was considered to be statistically significant.
Go to :
Results
1. NAMPT expression
We investigated the patterns of expression of nicotinamide phosphoribosyltransferase (NAMPT) in the large and small intestines of mice in response to IR treatment and rebamipide, sucralfate, or rifaximin administration. As shown in Fig. 2, protein expression of NAMPT was decreased after IR treatment compared to that of control mice, whereas the administration of rebamipide, sucralfate, and rifaximin attenuated the IR-induced decrease in NAMPT expression (all p<0.05).
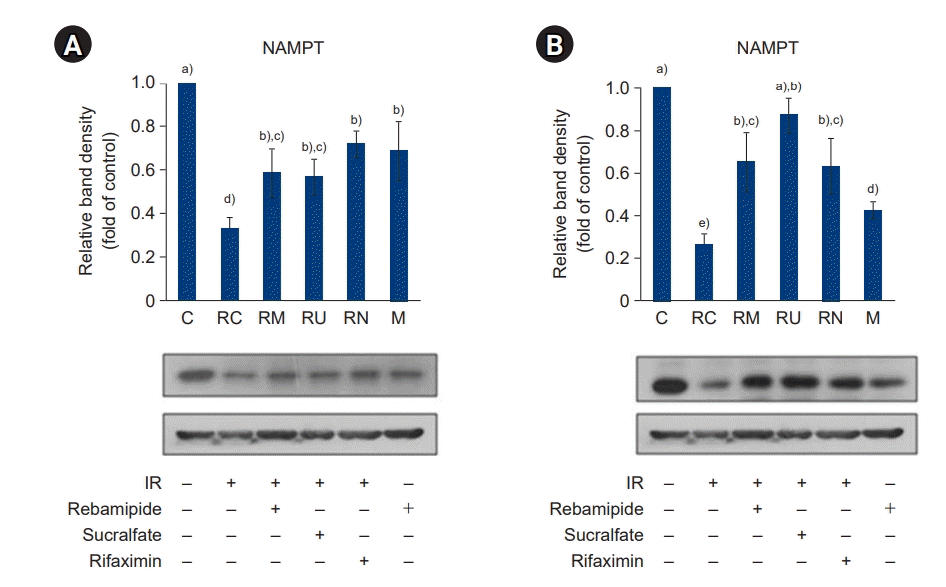 | Fig. 2.Effects of rebamipide, sucralfate, and rifaximin on the ionizing radiation (IR)-induced expression of nicotinamide phosphoribosyltransferase (NAMPT) in the large intestine (A) and small intestine (B). The expression of NAMPT was measured by immunoblotting. Bands were quantified using densitometry, and band intensities were compared with controls. Values are presented as mean±standard deviation (n=6). A vehicle-treated control group before sham irradiation (C); a vehicle-treated control group before irradiation (RC); a rebamipide-treated group before irradiation (RM); a sucralfate-treated group before irradiation (RU); a rifaximin-treated group before irradiation (RN); a rebamipide-treated control group before sham irradiation (M). a)-e) Bars with different letters are significantly different at p<0.05 according to the Tukey test.
|
2. NAMPT increases Sirt1 expression and decreases PARP-1 expression
Next, we evaluated how down- and upregulation of NAMPT by IR treatment and administration of rebamipide, sucralfate, and rifaximin, affected silent information regulator factor 2-related enzyme (Sirt) 1 (Fig. 3), poly-ADP-ribose polymerase (PARP)-1 (Fig. 4), and peroxisome proliferator-activated receptor (PPAR)γ (Fig. 5) expression in the large and small intestines of mice. Downregulation of NAMPT by IR treatment caused a significant decrease in Sirt1 expression and an increase in PARP-1 expression; however, the relative increase in NAMPT levels induced by the administration of rebamipide, sucralfate, and rifaximin significantly increased Sirt1 expression and decreased PARP-1 expression compared to IR treatment only (p<0.05). These results indicate that NAMPT plays an important role in the upregulation of Sirt1 and the downregulation of PARP-1.
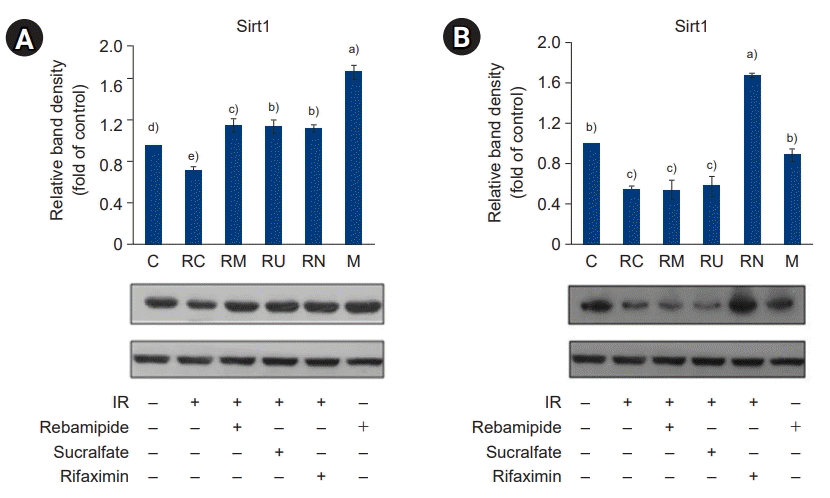 | Fig. 3.Effects of rebamipide, sucralfate, and rifaximin on the ionizing radiation (IR)-induced expression of silent information regulator factor 2-related enzyme (Sirt)1 in the large intestine (A) and small intestine (B). The expression of Sirt1 was measured by immunoblotting. Bands were quantified using densitometry, and band intensities were compared with controls. Values are presented as mean± standard deviation (n=6). A vehicle-treated control group before sham irradiation (C); a vehicle-treated control group before irradiation (RC); a rebamipide-treated group before irradiation (RM); a sucralfate-treated group before irradiation (RU); a rifaximin-treated group before irradiation (RN); a rebamipide-treated control group before sham irradiation (M). a)-e)Bars with different letters are significantly different at p<0.05 according to the Tukey test.
|
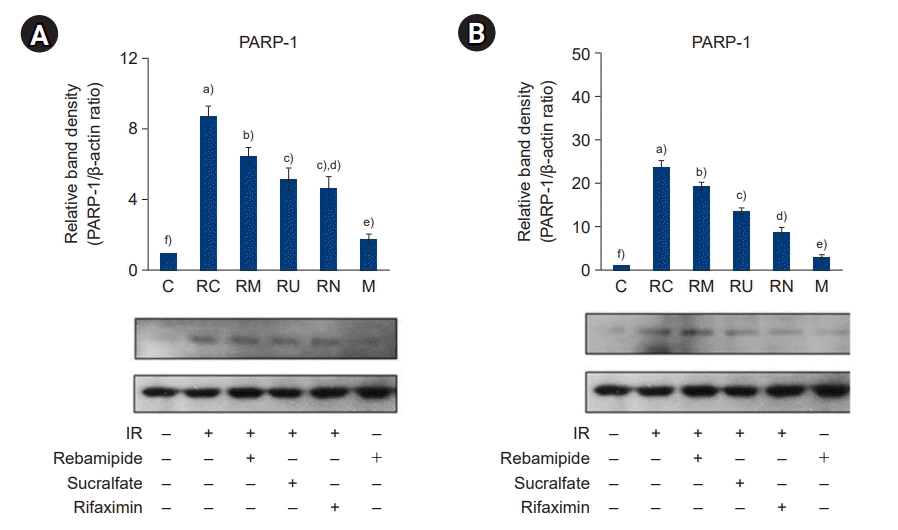 | Fig. 4.Effects of rebamipide, sucralfate, and rifaximin on the ionizing radiation (IR)-induced expression of poly-ADP-ribose polymerase (PARP)-1 in the large intestine (A) and small intestine (B). The expression of PARP-1 was measured by immunoblotting. Bands were quantified using densitometry, and band intensities were compared with controls. Values are presented as mean±standard deviation (n=6). A vehicle-treated control group before sham irradiation (C); a vehicle-treated control group before irradiation (RC); a rebamipide-treated group before irradiation (RM); a sucralfate-treated group before irradiation (RU); a rifaximin-treated group before irradiation (RN); a rebamipide-treated control group before sham irradiation (M). a)-f)Bars with different letters are significantly different at p<0.05 according to the Tukey test.
|
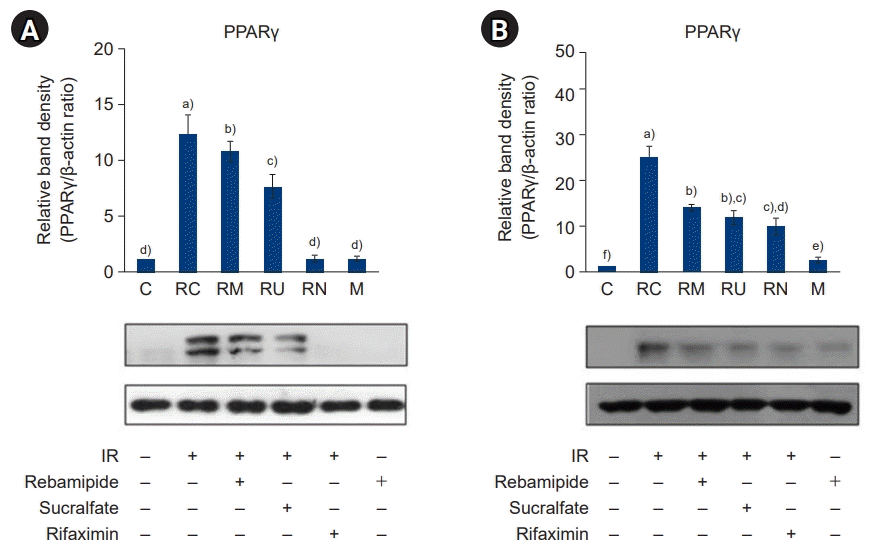 | Fig. 5.Effects of rebamipide, sucralfate, and rifaximin on the ionizing radiation (IR)-induced expression of peroxisome proliferator-activated receptor (PPAR)γ in the large intestine (A) and small intestine (B). The expression of PPARγ was measured by immunoblotting. Bands were quantified using densitometry, and band intensities were compared with controls. Values are presented as mean±standard deviation (n=6). A vehicle-treated control group before sham irradiation (C); a vehicle-treated control group before irradiation (RC); a rebamipide-treated group before irradiation (RM); a sucralfate-treated group before irradiation (RU); a rifaximin-treated group before irradiation (RN); a rebamipide-treated control group before sham irradiation (M). a)-f)Bars with different letters are significantly different at p<0.05 according to the Tukey test.
|
3. Upregulation of Sirt1 and downregulation of PARP-1 by NAMPT
Because downregulation of Sirt1 and upregulation of PARP-1 by IR induced a proinflammatory response, we examined how IR treatment and administration of rebamipide, sucralfate, or rifaximin affected the activation of NF-κB and phosphorylation of mitogen-activated protein kinases (MAPKs), which are key signaling mediators of inflammation in the large and small intestines. Compared to the controls, activation of NF-κB (Fig. 6) and phosphorylation of MAPKs (Fig. 7) were significantly induced by IR treatment; in contrast, levels of these signaling molecules were effectively attenuated following the administration of rebamipide, sucralfate, or rifaximin (all p<0.05). Taken together, these results suggest that upregulation of Sirt1 and downregulation of PARP-1 following the administration of rebamipide, sucralfate, and rifaximin reduced the expression of key mediators of the inflammatory signaling pathway, potentially by suppressing the expression of inflammatory cytokines via inhibition of NF-κB and MAPK signaling in the large and small intestines.
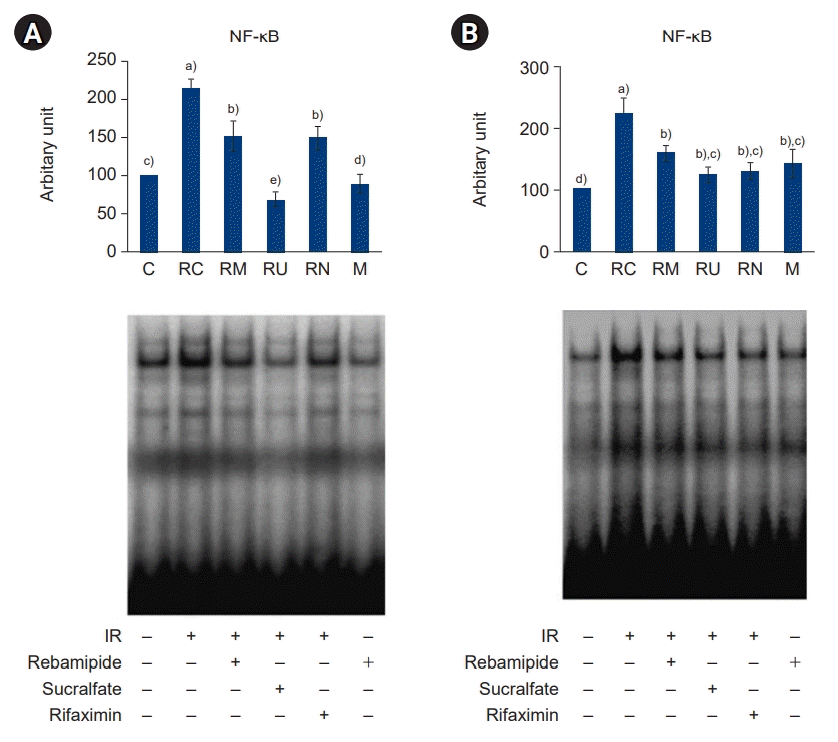 | Fig. 6.Effects of rebamipide, sucralfate, and rifaximin on the ionizing radiation (IR)-induced DNA binding activity of NF-κB in the large intestine (A) and small intestine (B) as determined by electrophoretic mobility shift assay analysis. The intensities of the bands were determined by densitometry analysis and are expressed as relative radioactive intensities. Values are presented as mean±standard deviation (n=6). A vehicle-treated control group before sham irradiation (C); a vehicle-treated control group before irradiation (RC); a rebamipide-treated group before irradiation (RM); a sucralfate-treated group before irradiation (RU); a rifaximin-treated group before irradiation (RN); a rebamipide-treated control group before sham irradiation (M). a)-c)Bars with different letters are significantly different at p<0.05 according to the Tukey test.
|
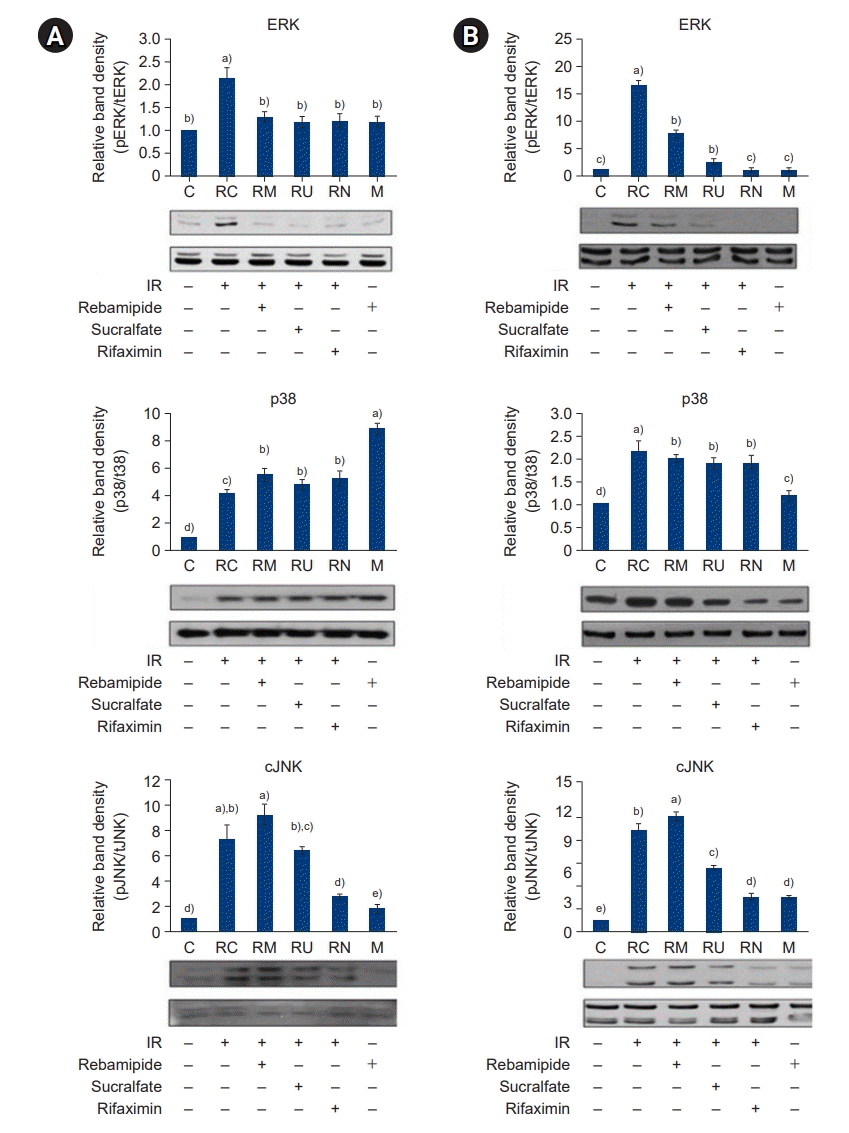 | Fig. 7.Effects of rebamipide, sucralfate, and rifaximin on the ionizing radiation (IR)-induced mitogen-activated protein kinase (MARK) activation in the large intestine (A) and small intestine (B). The activation of MAPKs was measured by immunoblotting. Bands were quantified using densitometry, and band intensities were compared with controls. Values are presented as mean±standard deviation (n=6). A vehicle-treated control group before sham irradiation (C); a vehicle-treated control group before irradiation (RC); a rebamipide-treated group before irradiation (RM); a sucralfate-treated group before irradiation (RU); a rifaximin-treated group before irradiation (RN); a rebamipide-treated control group before sham irradiation (M). a)-e)Bars with different letters are significantly different at p<0.05 according to the Tukey test.
|
4. Downregulation of NF-κB and MAPK signaling by NAMPT
To examine the effect of IR treatment and rebamipide, sucralfate, and rifaximin administration on NF-κB and MAPK signaling-mediated inflammation, we next examined the expression of the proinflammatory cytokines TNF-α, IL-1β, and IL-6; the chemokine MCP-1; the metabolic proteins iNOS, COX-2, and PGE2; and the intercellular adhesion molecule 1 (ICAM-1) in the large and small intestines (Figs. 8-11). The production of TNF-α, IL-1β, and IL-6 was increased by IR treatment, while the administration of rebamipide, sucralfate, or rifaximin significantly attenuated their expression to levels similar to those of control mice (p<0.05) (Fig. 8). The pattern of expression of the chemokine MCP-1 was similar to that observed for the proinflammatory cytokines (Fig. 9). The expression and production of metabolic proteins iNOS, COX-2, and PGE2 were significantly induced by IR treatment, while administration of rebamipide, sucralfate, or rifaximin markedly attenuated the IR-induced increase in expression of these proteins (p<0.05) (Figs. 10, 11). The expression of the adhesion molecule ICAM-1 followed a similar pattern (Fig. 12). Taken together, our results indicate that IR-stimulated activation of the NF-κB and MAPK signaling pathways plays a crucial role in inflammation, and downregulation of NF-κB and MAPK signaling by administration of rebamipide, sucralfate, and rifaximin may ameliorate IR-induced proinflammatory responses in the large and small intestines.
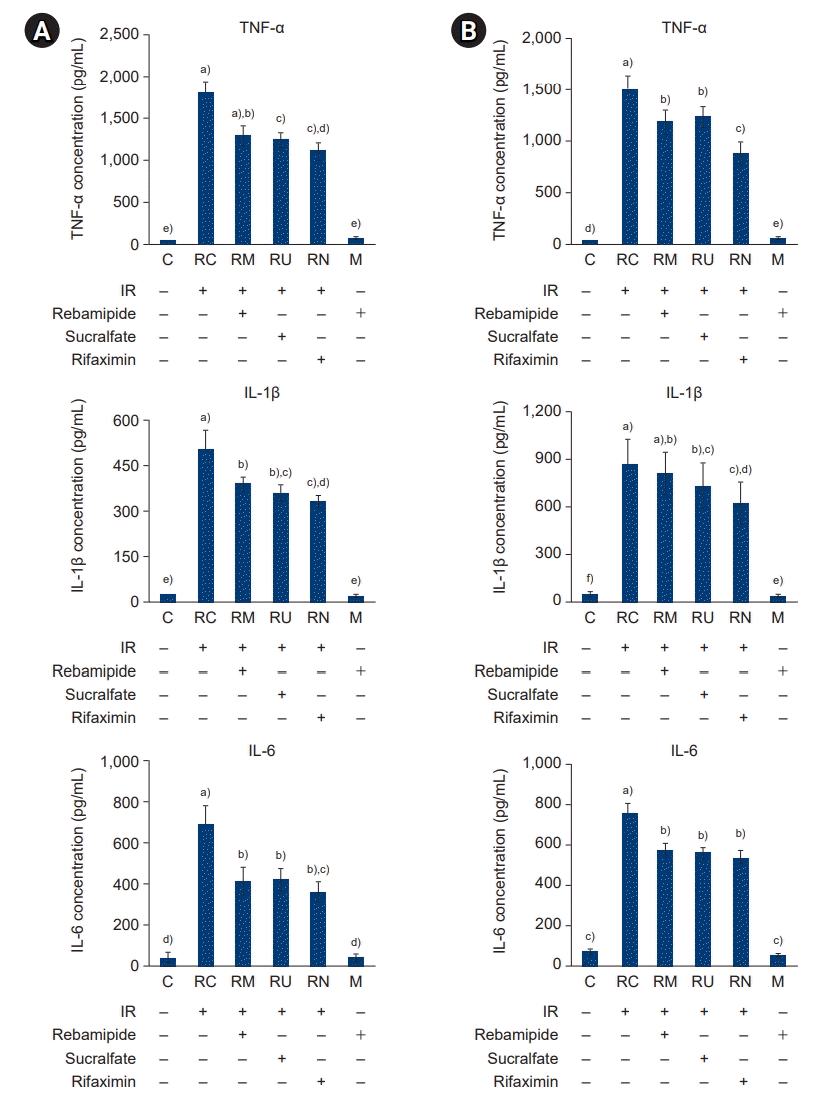 | Fig. 8.Effects of rebamipide, sucralfate, and rifaximin on the ionizing radiation (IR)-induced production of TNF-α, IL-1β, and IL-6 in the large intestine (A) and small intestine (B). The production of TNF-α, IL-1β, and IL-6 was measured using enzyme-linked immunosorbent assay kits according to the manufacturer’s instructions. Values are presented as mean±standard deviation (n=6). A vehicle-treated control group before sham irradiation (C); a vehicle-treated control group before irradiation (RC); a rebamipide-treated group before irradiation (RM); a sucralfate-treated group before irradiation (RU); a rifaximin-treated group before irradiation (RN); a rebamipide-treated control group before sham irradiation (M). a)-f)Bars with different letters are significantly different at p<0.05 according to the Tukey test.
|
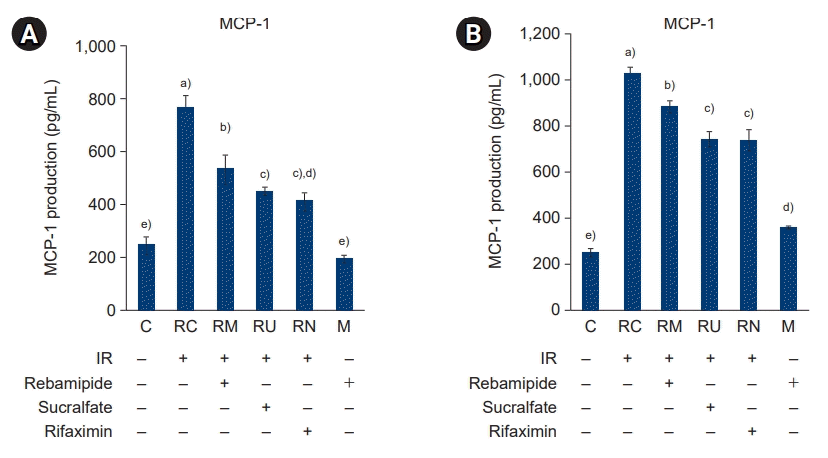 | Fig. 9.Effects of rebamipide, sucralfate, and rifaximin on the ionizing radiation (IR)-induced production of major capsid protein (MCP)-1 in the large intestine (A) and small intestine (B). The production of MCP-1 was measured using an enzyme-linked immunosorbent assay kit according to the manufacturer’s instructions. Values are presented as mean±standard deviation (n=6). A vehicle-treated control group before sham irradiation (C); a vehicle-treated control group before irradiation (RC); a rebamipide-treated group before irradiation (RM); a sucralfate-treated group before irradiation (RU); a rifaximin-treated group before irradiation (RN); a rebamipide-treated control group before sham irradiation (M). a)-e)Bars with different letters are significantly different at p<0.05 according to the Tukey test.
|
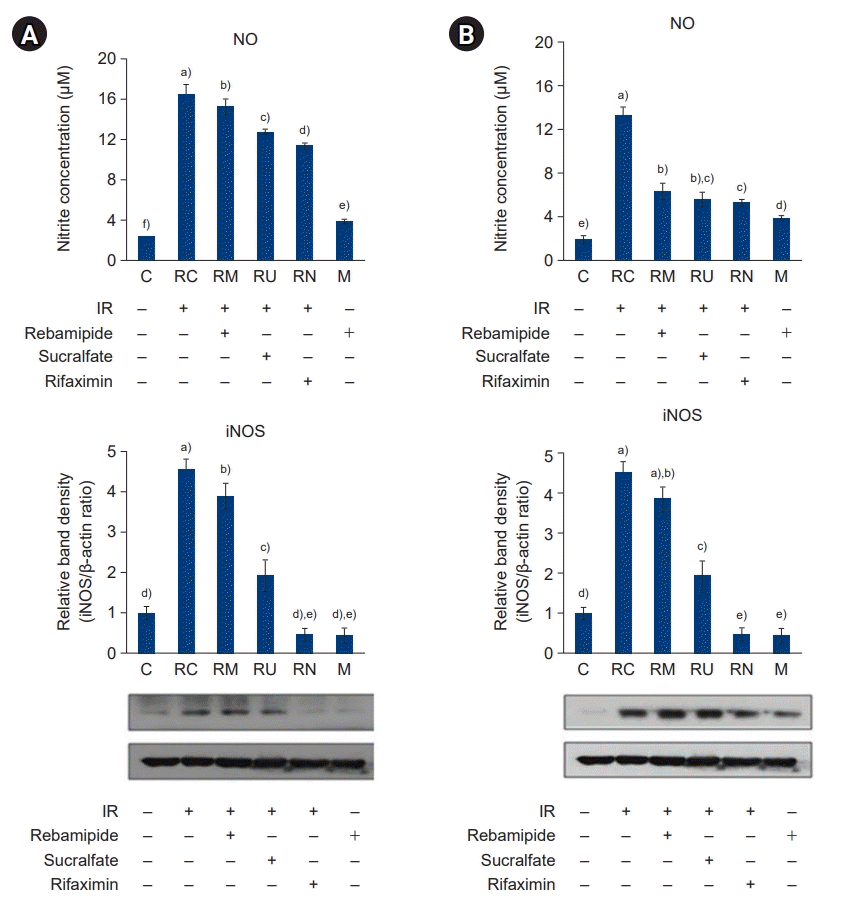 | Fig. 10.Effects of rebamipide, sucralfate, and rifaximin on the ionizing radiation (IR)-induced production of nitric oxide (NO) and expression of inducible NO synthase (iNOS) in the large intestine (A) and small intestine (B). The production of NO and expression of iNOS were measured using the Griess reagent system and an immunoblotting assay, respectively. Bands were quantified using densitometry, and band intensities were compared with controls. Values are presented as mean±standard deviation (n=6). A vehicle-treated control group before sham irradiation (C); a vehicle-treated control group before irradiation (RC); a rebamipide-treated group before irradiation (RM); a sucralfate-treated group before irradiation (RU); a rifaximin-treated group before irradiation (RN); a rebamipide-treated control group before sham irradiation (M). a)-f)Bars with different letters are significantly different at p<0.05 according to the Tukey test.
|
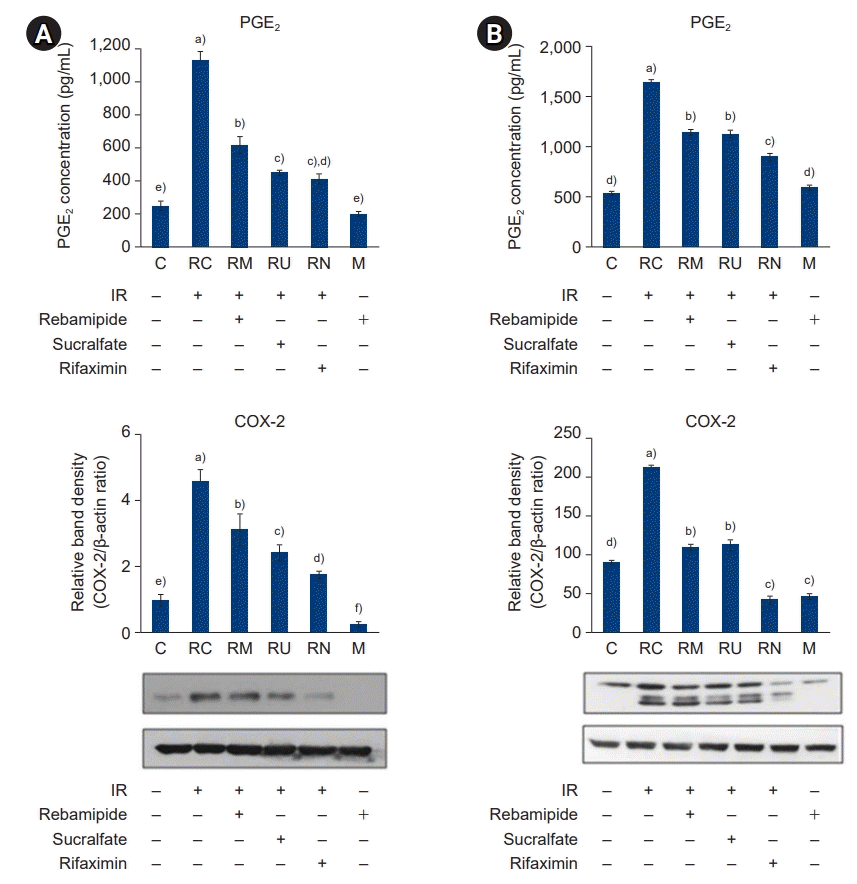 | Fig. 11.Effects of rebamipide, sucralfate, and rifaximin on the ionizing radiation (IR)-induced production of PGE2 and expression of COX-2 in the large intestine (A) and small intestine (B). The production of PGE2 and expression of COX-2 were measured using an enzyme-linked immunosorbent assay kit according to the manufacturer’s instructions and an immunoblotting assay, respectively. Bands were quantified using densitometry, and band intensities were compared with controls. Values are presented as mean±standard deviation (n=6). A vehicle-treated control group before sham irradiation (C); a vehicle-treated control group before irradiation (RC); a rebamipide-treated group before irradiation (RM); a sucralfate-treated group before irradiation (RU); a rifaximin-treated group before irradiation (RN); a rebamipide-treated control group before sham irradiation (M). a)-f)Bars with different letters are significantly different at p<0.05 according to the Tukey test.
|
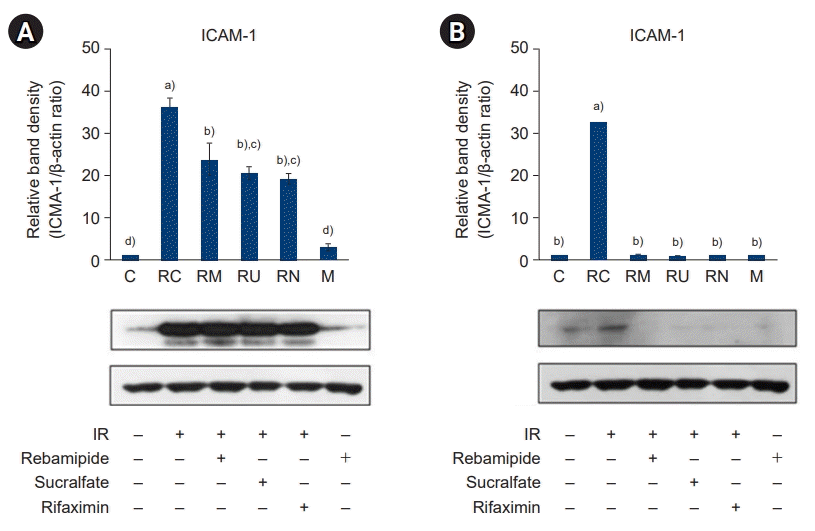 | Fig. 12.Effects of rebamipide, sucralfate, and rifaximin on the ionizing radiation (IR)-induced expression of intercellular adhesion molecule 1 (ICAM-1) in the large intestine (A) and small intestine (B). The expression of ICAM-1 was measured by immunoblotting. Bands were quantified using densitometry, and band intensities were compared with controls. Values are presented as mean±standard deviation (n=6). A vehicle-treated control group before sham irradiation (C); a vehicle-treated control group before irradiation (RC); a rebamipide-treated group before irradiation (RM); a sucralfate-treated group before irradiation (RU); a rifaximin-treated group before irradiation (RN); a rebamipide-treated control group before sham irradiation (M). a)-d)Bars with different letters are significantly different at p<0.05 according to the Tukey test.
|
5. [Ca2+] oscillations
Because downregulation of the inflammatory response inhibits cell apoptosis, we hypothesized that the rebamipide, sucralfate, or rifaximin-induced downregulation of the inflammatory response would protect the large and small intestines from IR-induced apoptosis. Ca2+ is known to coordinate endoplasmic reticulum-mitochondrial interactions that regulate apoptosis. We examined the expression of proapoptotic and antiapoptotic genes in response to [Ca2+] oscillations in IR-treated large and small intestines. As shown in Fig. 13, [Ca2+] oscillations were significantly increased by IR treatment but attenuated by the administration of rebamipide, sucralfate, or rifaximin. Furthermore, expression of the proapoptotic genes Bax and c-Myc and the antiapoptotic genes Bcl-2 and Bcl-xL was potently suppressed and induced, respectively, by the administration of rebamipide, sucralfate, or rifaximin (Figs. 14, 15). These results suggest that downregulation of the inflammatory response by NAMPT positively regulates apoptosis in IR-treated large and small intestines.
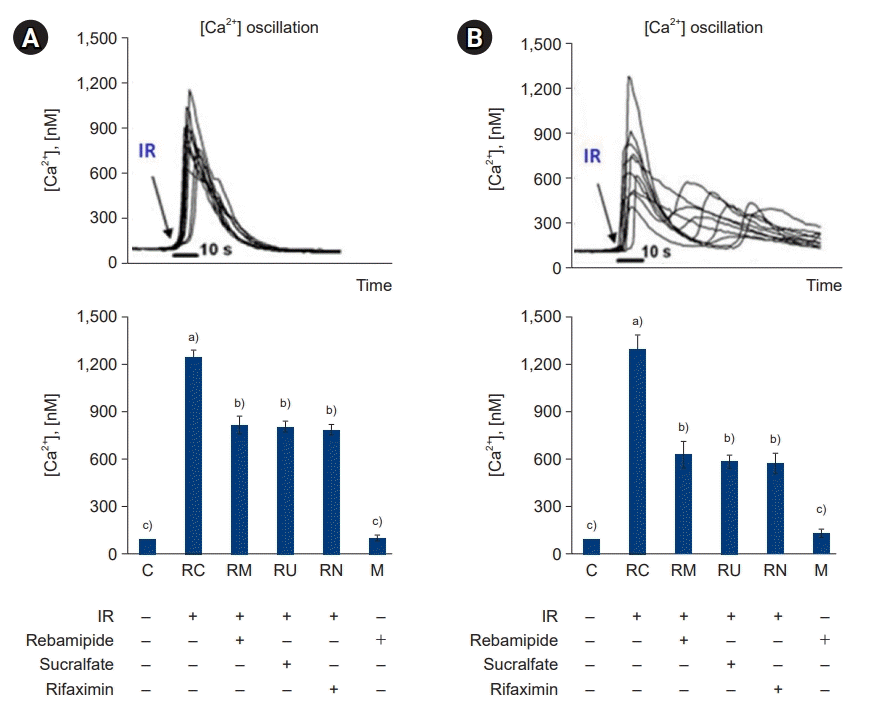 | Fig. 13.Effects of rebamipide, sucralfate, and rifaximin on the ionizing radiation (IR)-induced [Ca2+] oscillations in the large intestine (A) and small intestine (B). IR induced an increase in [Ca2+] in the colons and small intestines of mice. Tissue cells were freshly isolated and stained with fluo-3 acetoxymethyl ester, attached to glass slides, and placed under a confocal microscope. The changes in fluorescence were monitored every 1.1 seconds for 100 seconds. The results are representative of 10 randomly chosen cells. Values are presented as mean±standard deviation (n=6). A vehicle-treated control group before sham irradiation (C); a vehicle-treated control group before irradiation (RC); a rebamipide-treated group before irradiation (RM); a sucralfate-treated group before irradiation (RU); a rifaximin-treated group before irradiation (RN); a rebamipide-treated control group before sham irradiation (M). a)-c)Bars with different letters are significantly different at p<0.05 according to the Tukey test.
|
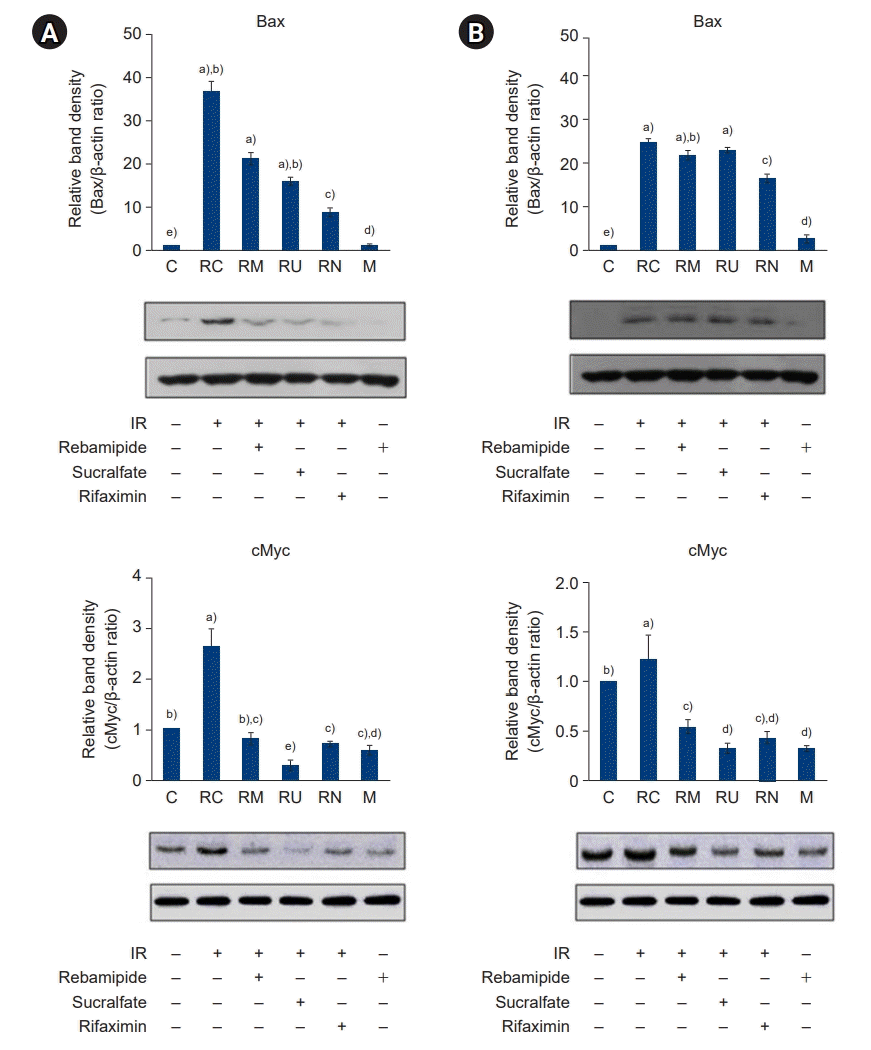 | Fig. 14.Effects of rebamipide, sucralfate, and rifaximin on the ionizing radiation (IR)-induced expression of Bax and c-Myc in the large intestine (A) and small intestine (B). The expression of Bax and c-Myc was measured by immunoblotting. Bands were quantified using densitometry, and band intensities were compared with controls. Values are presented as mean±standard deviation (n=6). A vehicle-treated control group before sham irradiation (C); a vehicle-treated control group before irradiation (RC); a rebamipide-treated group before irradiation (RM); a sucralfate-treated group before irradiation (RU); a rifaximin-treated group before irradiation (RN); a rebamipide-treated control group before sham irradiation (M). a)-e)Bars with different letters are significantly different at p<0.05 according to the Tukey test.
|
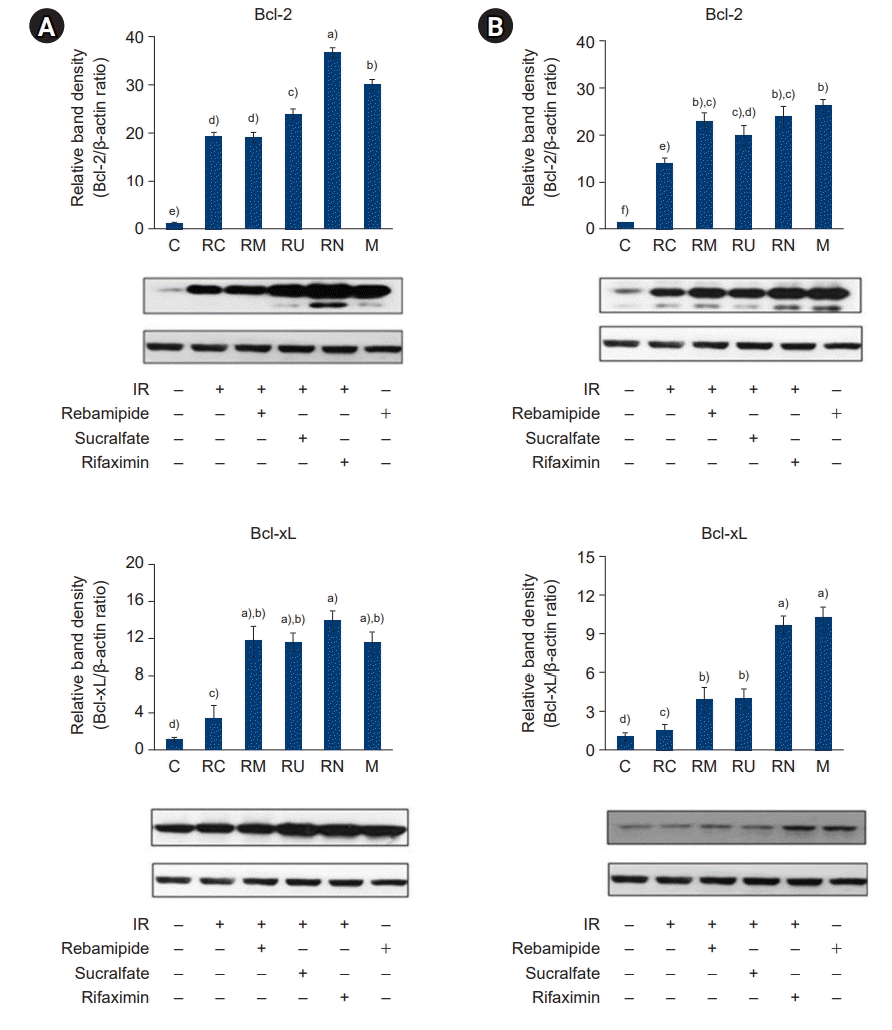 | Fig. 15.Effects of rebamipide, sucralfate, and rifaximin on the ionizing radiation (IR)-induced expression of Bcl-2 and Bcl-xL in the large intestine (A) and small intestine (B). The expression of Bcl-2 and Bcl-xL was measured by immunoblotting. Bands were quantified using densitometry, and band intensities were compared with controls. Values are presented as mean±standard deviation (n=6). A vehicle-treated control group before sham irradiation (C); a vehicle-treated control group before irradiation (RC); a rebamipide-treated group before irradiation (RM); a sucralfate-treated group before irradiation (RU); a rifaximin-treated group before irradiation (RN); a rebamipide-treated control group before sham irradiation (M). a)-f)Bars with different letters are significantly different at p<0.05 according to the Tukey test.
|
6. Inhibition of cytochrome C release and the caspase cascade
Downregulation of NAMPT induces apoptosis, which is an energy-consuming process. To investigate the effect of NAMPT on IR-induced apoptosis, we evaluated the release of cytochrome C and the expression of caspase 3 and caspase 7. The release of cytochrome C was significantly increased by IR treatment, while it was markedly attenuated by the administration of rebamipide, sucralfate, or rifaximin to levels similar to those of control mice (p<0.05) (Fig. 16). In addition, expression of caspase 3 and caspase 7 was significantly elevated by IR treatment compared to that of the control group; however, administration of rebamipide, sucralfate, or rifaximin decreased the IR-induced increase in expression of these caspases (p<0.05) (Fig. 17). These results further demonstrate that NAMPT is an effective protectant against IR-stimulated large and small intestine damage and that the underlying mechanism of NAMPT-mediated protection involves downregulation of cytochrome C and the caspase cascade at the protein level.
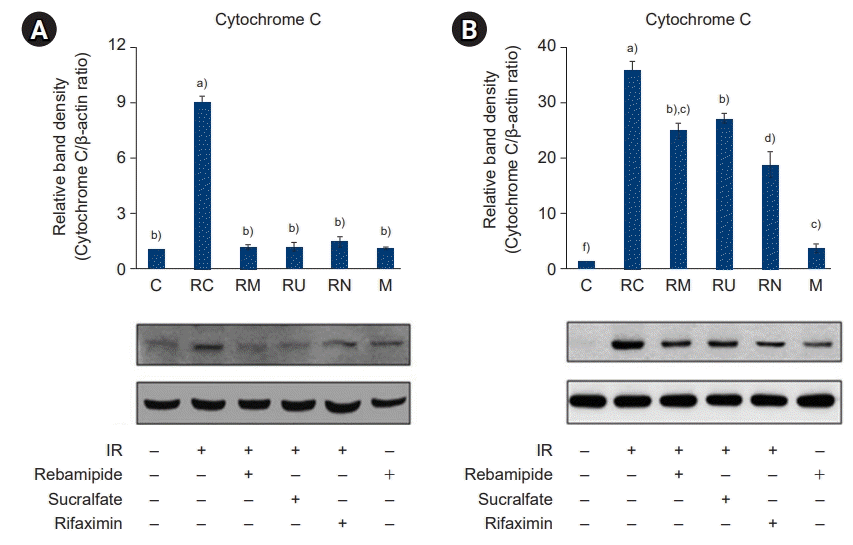 | Fig. 16.Effects of rebamipide, sucralfate, and rifaximin on the ionizing radiation (IR)-induced expression of cytochrome C in the large intestine (A) and small intestine (B). The expression of cytochrome C was measured by immunoblotting. Bands were quantified using densitometry, and band intensities were compared with controls. Values are presented as mean±standard deviation (n=6). A vehicle-treated control group before sham irradiation (C); a vehicle-treated control group before irradiation (RC); a rebamipide-treated group before irradiation (RM); a sucralfate-treated group before irradiation (RU); a rifaximin-treated group before irradiation (RN); a rebamipide-treated control group before sham irradiation (M). a)-f)Bars with different letters are significantly different at p<0.05 according to the Tukey test.
|
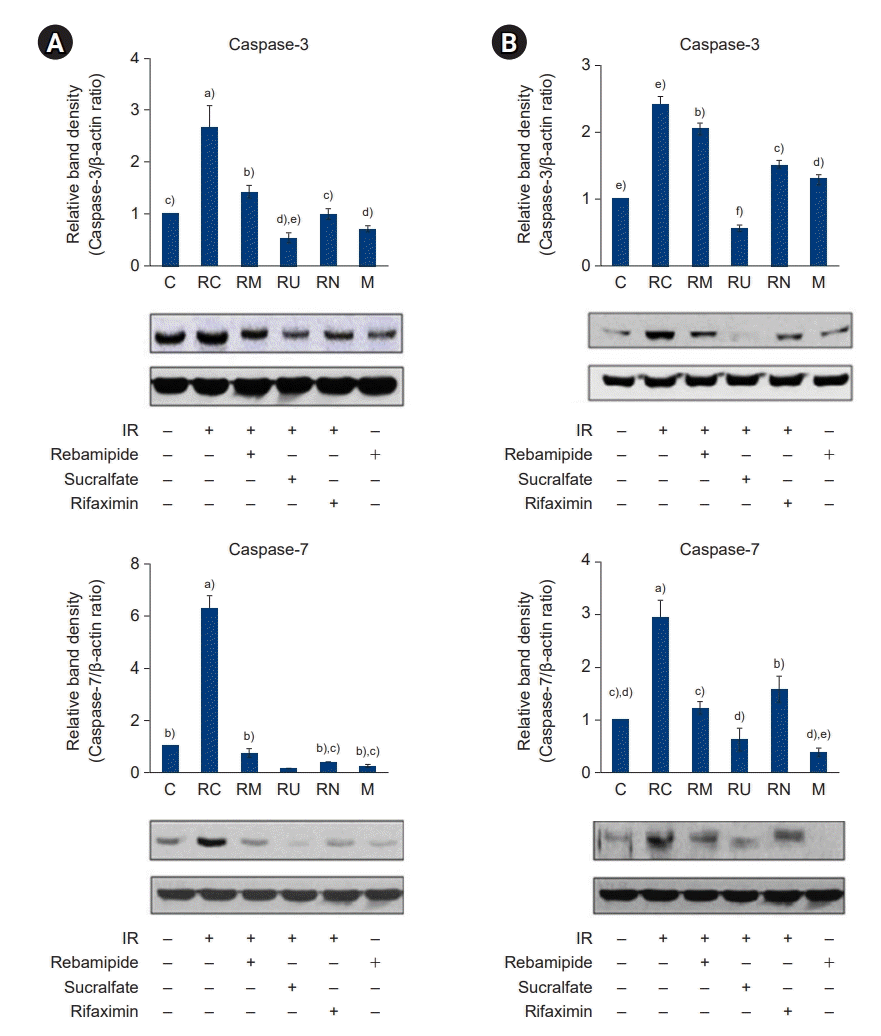 | Fig. 17.Effects of rebamipide, sucralfate, and rifaximin on the ionizing radiation (IR)-induced expression of caspase-3 and caspase-7 in the large intestine (A) and small intestine (B). The expression of caspase-3 and caspase-7 was measured by immunoblotting. Bands were quantified using densitometry, and the intensity of bands was compared with controls. Values are presented as mean±standard deviation (n=6). A vehicle-treated control group before sham irradiation (C); a vehicle-treated control group before irradiation (RC); a rebamipide-treated group before irradiation (RM); a sucralfate-treated group before irradiation (RU); a rifaximin-treated group before irradiation (RN); a rebamipide-treated control group before sham irradiation (M). a)-f)Bars with different letters are significantly different at p<0.05 according to the Tukey test.
|
Go to :
Discussion
There is an association between NAD metabolism and cell inflammation [12]. Genotoxic damage induced by IR activates cellular responses to repair DNA damage and restore cellular viability. An adipocytokine is a secreted form of NAMPT, known as PBEF or visfatin [13]. NAMPT has been implicated in many biological processes involving inflammation and apoptosis. For example, NAMPT promotes macrophage survival via an IL-6/STAT3 signaling mechanism [14].
We were interested in determining whether NAMPT plays a role in IR-induced inflammation and apoptosis in the intestine. Our findings indicate that NAMPT does play a role in IR-induced inflammation and apoptosis; furthermore, our findings suggest that rebamipide, sucralfate, and rifaximin attenuate IR-induced damage in the large and small intestines of mice by attenuating the IR-induced decrease in NAMPT expression.
Sirtuins coordinate cell cycle regulation, gene expression, response to DNA damage, metabolism, apoptosis, autophagy, and aging [15]. Sirt1 is associated with the RelA/p65 subunit of NF-κB and deacetylates a site, the lys310 residue of RelA/p65, for NF-κB transcriptional activity [16]. Sirt1 is involved in the regulation of inflammation and could be a potential target for various chronic inflammatory diseases. Sirt1 can also regulate the activity of PPARγ, PPARγ-coactivator 1α, and the p300/CREB-binding protein [17]. Sirt1 can repress inflammatory responses via inhibition of NF-κB signaling, a key regulator of inflammation. Because NF-κB is a direct target of Sirt1, suppression of NF-κB signaling via induction of Sirt1 expression may play an important role in the inflammatory process.
PARP-1 is involved in the immediate cellular response to DNA damage. PARP-1 has been known to facilitate DNA repair with a protective role against moderate genotoxic stress. However, sustained PARP-1 activation promotes a non-apoptotic form of cell death and inflammation [18].
Collectively, our data indicate that NAMPT induces Sirt1 expression and suppresses PARP-1 expression; increased expression of NAMPT by administration of rebamipide, sucralfate, and rifaximin could potentially attenuate the IR-induced inflammatory response.
NF-κB regulates the expression of genes involved in inflammation. The activation of NF-κB is associated with increased transcription of adhesion molecules, cytokines, and chemokines [19]. Linard et al. [20] reported that abdominal irradiation activated NF-κB in the ileal muscularis layer of rats, which was modulated by subdiaphragmatic vagotomy and NF-κB inhibitors. Ostrau et al. [21] showed that lovastatin attenuated IR-induced normal tissue damage via suppression of the NF-κB signaling pathway in vivo. Hong et al. [22] showed that IR-mediated downregulation of Sirt1 induced cellular senescence. MAPKs integrate and process various extracellular signals, control the expression of cytokines, and organize cellular responses to stress [23]. According to numerous studies, radiotherapy activates MAPK pathways in different tissues, which play key roles in transmitting cellular stress stimuli, such as irradiation, by protein phosphorylation [23]. NF-κB and MAPKs therefore play critical roles in regulating intestinal inflammation and the epithelial barrier during IR treatment. However, the anti-inflammatory effects of rebamipide, sucralfate, and rifaximin in IR-treated large and small intestines have not been previously investigated.
We found that rebamipide, sucralfate, and rifaximin suppressed the activation of NF-κB and the phosphorylation of MAPKs at pharmacological concentrations by upregulating the expression of Sirt1 and downregulating the expression of PARP-1 in the IR-treated large and small intestines of mice. Our results suggest that the anti-inflammatory activities of rebamipide, sucralfate, and rifaximin are mediated by NAMPT-mediated NAD+ biosynthesis; these compounds could potentially be used to prevent and treat the IR-related inflammatory response in the small and large intestines.
TNF-α is associated with inflammatory disease and has a broad spectrum of biologic effects. TNF-α induces inflammation by inducing the expression of adhesion molecules and cytokines in epithelial and endothelial cells, as well as inflammatory cells. TNF-α produces and activates proinflammatory cytokines and factors associated with intestinal inflammation [24].
IL-1β is changed to its active form by proteolytic enzymes such as caspase-1 [24]. IL-6 induces B-cell growth and differentiation and acts as a mediator of C-reactive protein. It also contributes to the activation and/or proliferation of T-cells [25].
MCP-1 regulates the infiltration of monocytes and macrophages, and it is mediated by CC chemokine receptor 2 (CCR2). MCP-1 is expressed by a variety of cell types in response to IL-1β and TNF-α. The expression of MCP-1 is dependent on the activation of NF-κB [26]. However, upregulation of MCP-1 in IR-treated intestines is not well understood.
Cytokines stimulate the expression of the iNOS isoform and the production of NO. NO is synthesized from L-arginine by NO synthases (NOS) [27]. A recent study demonstrated that nitrosative stress might play a role in methotrexate-induced intestinal damage [28]. However, no previous study has evaluated the specific role of the inducible form of NOS and the effect of NOS inhibitors in IR-treated large and small intestines.
PGE2 is a local chemical messenger that is used as a marker of inflammation in colon cancer. IECs in the colon are the first host defense against various toxins and pathogens. For example, bacterial infection of IECs results in the upregulation of NF-κB-dependent proinflammatory cytokines including PGE2, TNF-α, granulocyte macrophage-colony stimulating factor, IL-6, NO, and IL-1β [29]. COX-2, in contrast, is highly induced in response to proinflammatory stimuli, cytokines, and mitogens, resulting in high levels of PGE2 release [30]. Among the eicosanoids, the role of PGE2 is to control excessive inflammation and induce mucosal cytoprotection. A major function of PGE2 in response to mucosal damage is to induce epithelial proliferation [31]. However, aberrant PGE2 levels from the sustained overexpression of COX-2 have also been implicated in the development of colorectal cancers [32]. Indeed, it has been recently shown that COX-2 protects the rat stomach from mild irritation [33]. However, no previous study has investigated the expression of COX-2 or PGE2 in IR-treated intestines.
The function of ICAM-1 via interaction with the integrins expressed on their cell surfaces is to recruit and traffic leucocytes. ICAM-1 is expressed in IEC lines, and it is enhanced by bacterial infections, proinflammatory cytokines, and pathogen-associated molecular patterns. Molla et al. [34] investigated the roles of VCAM-1 and ICAM-1 in a radiation-induced intestinal inflammation model. NF-κB can be activated by extracellular stimuli, including the cytokine TNF-α, and regulates the expression of ICAM-1. Overall, we demonstrated that downregulation of NF-κB and MAPK signaling by NAMPT inhibited the expression of cytokines, chemokines, metabolic proteins, and adhesion molecules, which contributed to a reduction in IR-associated inflammation.
[Ca2+] is a fundamental second messenger in cell signaling. [Ca2+] levels within the cell cytosol and the nucleus are increased by the stimulation of cells by [Ca2+]-linked signaling agents. This can modulate numerous [Ca2+]-regulated enzymes that have different subcellular localizations, thereby creating a wide range of spatial and temporal signals. [Ca2+] metabolism plays a crucial role in the propagation of apoptosis. However, the role of [Ca2+] in inducing apoptosis is controversial in view of the fact that in different systems, Ca2+ has been observed to either support survival or induce apoptosis. For instance, high K+ depolarization and subsequent Ca2+ entry into the cytosol helped to sustain the survival of granule cells [35]. The Bcl-2 family can be divided into antiapoptotic members and proapoptotic members. Among the proapoptotic members, Bak and Bax have been classified as the last gateway of cytochrome C release [36]. Overall, IR-associated inflammation is affected by proapoptotic signals such as [Ca2+] oscillations, which determine the expression of proapoptotic genes and the release of cytochrome C.
In the execution of apoptosis, the role of downstream caspases was demonstrated in caspase-7−/− and caspase-3−/− and double-mutant mice. These mice showed strong apoptosis-deficient phenotypes [37]. Collectively, our data suggest that downregulation of proapoptotic signals by NAMPT could attenuate apoptosis through the inhibition of cytochrome C and the caspase cascade.
Conclusively, our results demonstrate that rebamipide, sucralfate, and rifaximin suppress acute IR-induced inflammation and apoptosis via upregulation of Sirt1 expression through NAMPT-mediated NAD+ biosynthesis and downregulation of the NF-κB/MAPK signaling pathway in the large and small intestines of mice. These findings suggest that the administration of rebamipide, sucralfate, or rifaximin prior to radiation therapy may prevent or attenuate acute radiation-induced enterocolitis.
Go to :
 XML Download