Introduction
Methods
1. Precisions for the AMR group, the MDP group, and QC materials
2. Mean difference between automated system and manual system
3. Bland-Altman analysis for the two systems
Results
1. Precisions for the AMR group, the MDP group, and QC materials
Table 1.
Table 2.
Table 3.
2. Mean differences in the AMR group, the MDP group, and QC materials
Table 4.
3. Bland-Altman analysis
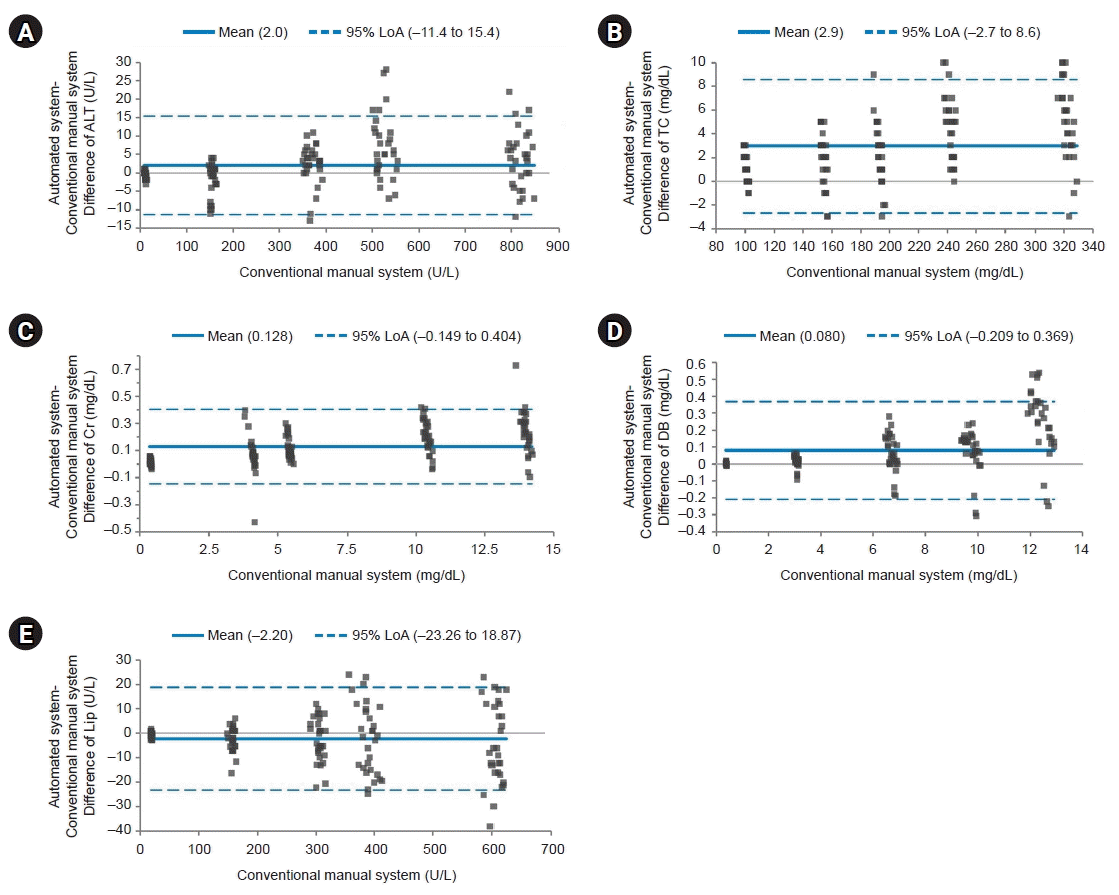
 | Fig. 1.Bland-Altman plot for the analytical measurement range group. The solid line indicates the difference in the mean values of the tested items between an automated system and a conventional manual system. The dotted line indicates the 95% limits of agreement (LoA). Most points on the Bland-Altman plot are scattered within the 95% LoA. Although the majority of points in direct bilirubin (DB) are above the mean line, there seems to be no consistent bias between the values of the two systems. Most points with the lowest values are scattered below the mean line except for lipase (Lip). However, all values are within the 95% LoA. (A) Difference of alanine aminotransferase (ALT). (B) Difference of total cholesterol (TC). (C) Difference of creatinine (Cr). (D) Difference of DB. (E) Difference of Lip. |
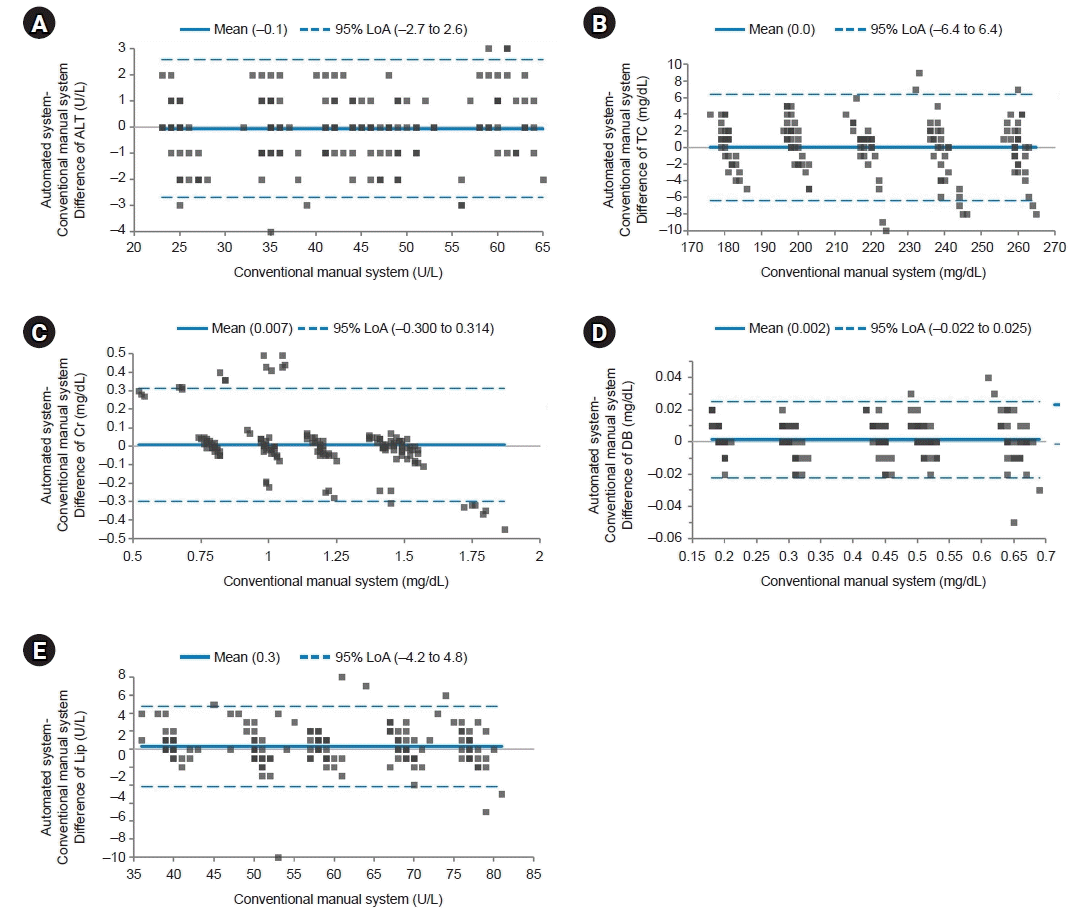
 | Fig. 2.Bland-Altman plot for the medical decision point group. The solid line indicates the difference in the mean values of the tested items between an automated system and a conventional manual system. Most points on the Bland-Altman plot are scattered within the 95% limits of agreement (LoA). There seems to be no consistent bias between the values of the two systems. (A) Difference of alanine aminotransferase (ALT). (B) Difference of total cholesterol (TC). (C) Difference of creatinine (Cr). (D) Difference of direct bilirubin (DB). (E) Difference of lipase (Lip). |
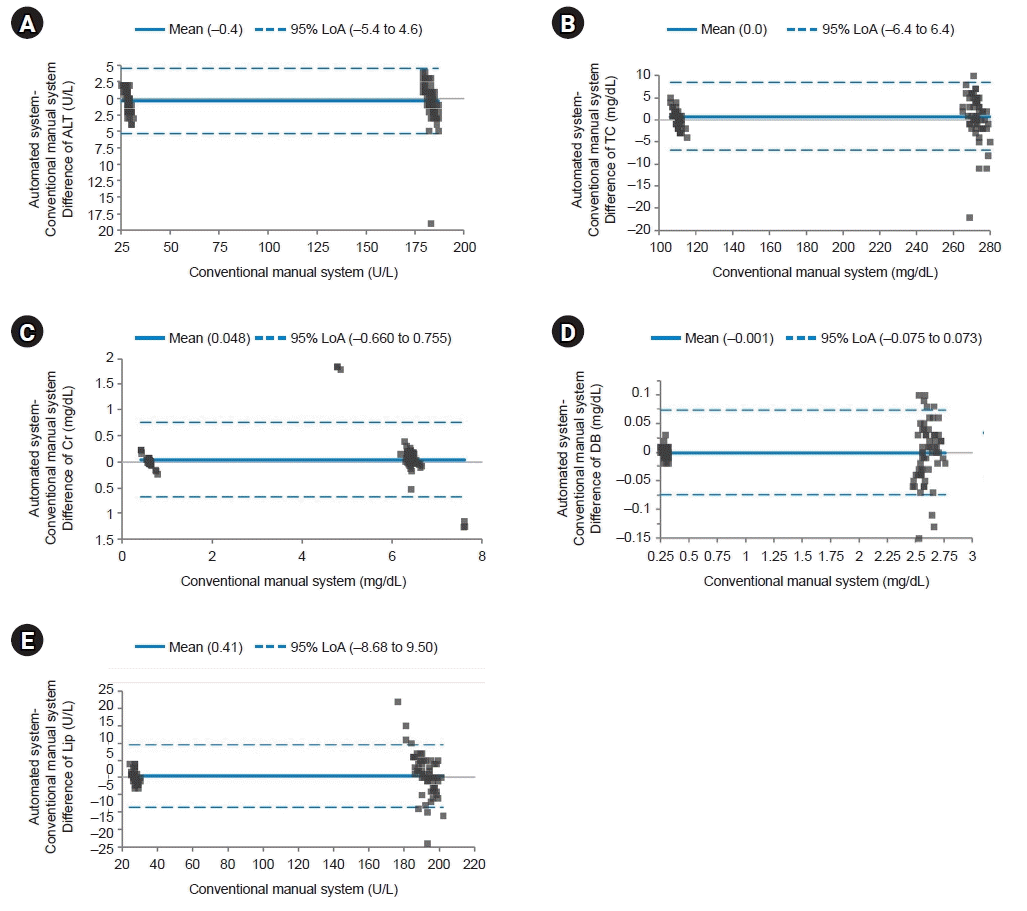
 | Fig. 3.Bland-Altman plot for quality control materials. The solid line indicates the difference in the mean values of the tested items between an automated system and a conventional manual system. Most points on the Bland-Altman plot are scattered within the 95% limits of agreement (LoA). There seems to be no consistent bias between the values of the two systems. (A) Difference of alanine aminotransferase (ALT). (B) Difference of total cholesterol (TC). (C) Difference of creatinine (Cr). (D) Difference of direct bilirubin (DB). (E) Difference of lipase (Lip). |


 PDF
PDF Citation
 Print
Print


 XML Download