

 PDF
PDF Citation
 Print
Print


INTRODUCTION
The pharmaceutical market for gastric acid secretion inhibitors can be categorized as H2 receptor antagonists (H2 blockers), proton pump inhibitors (PPIs), and new potassium-competitive acid blockers (P-CABs). In September 2019, the Ministry of Food and Drug Safety in Korea ordered that the manufacture, import, and sales of ranitidine were to be immediately discontinued; all products using ranitidine were recalled, and prescriptions were also banned [1,2]. This was because N-nitrosodimethylamine (NDMA), a carcinogen designated by the international agency for research on cancer was detected in the raw materials of seven types of ranitidine and finished products (269 items) using ranitidine [3-8]. In Korea and other countries, the sale of ranitidine was banned and the sold drugs were recalled. Valsartan and metformin were also removed from the market for the same reason in 2018 and 2020, respectively [9-17]. This event had a major impact on the pharmaceutical market for gastric acid secretion inhibitors because ranitidine, the most prescribed single agent from 2010 to 2018, was withdrawn from the market. However, there is no concrete evidence regarding how ranitidine withdrawal affects the gastric acid secretion inhibitor market. What would happen if, one day, the drug with the largest market shares suddenly disappeared? It can be inferred that another drug in the same H2 blocker class would be prescribed. For example, it is desirable to change the prescription to same-type drugs such as cimetidine, famotidine, lafutidine, and nizatidine. However, there is always the possibility that prescriptions can be switched to PPIs or P-CABs, which are drugs that are not in the same class.
The purpose of this study was to investigate how the gastric acid secretion inhibitor market changed after ranitidine withdrawal. We also investigated which drug replaced ranitidine and showed the greatest increase in prescriptions.
Go to : 
METHODS
1. Data sources, study design, and population
The National Health Insurance Service (NHIS) in Korea claim database was utilized to investigate changes in the total number of prescriptions and expenditure on gastric acid secretion inhibitors, including all H2 blockers, PPIs, and P-CABs. We used a retrospective, observational, time-series study design. The study population included gastric acid secretion inhibitors, including H2 blockers, PPIs, and P-CABs, which were approved and covered from 2010 to 2021 by the NHIS.
2. Statistical analysis
For the 12 years from January 2010 to December 2021, the prescription amount and drug cost of gastric acid secretion inhibitors were calculated by month. The market share was calculated by dividing the prescription volume market share by the drug cost market share and was expressed as a percentage. To investigate the effect of ranitidine withdrawal on the gastric acid secretion inhibitor market, we developed a time-series autoregressive model using data from January 2010 to October 2019. In addition, to estimate the difference before and after the withdrawal of ranitidine, the P-value was calculated by interrupted time series analysis using the data date between 2010 and 2021 (interrupted time: October 2019). The change in overall market share after the ban on ranitidine prescription was analyzed by dividing it into prescription volume and pharmaceutical expenditures, and subgroup analysis was performed by dividing it into tertiary hospitals, general hospitals, hospitals, and local clinics.
All statistical analyses were performed using the SAS Enterprise Guide 7.1 (SAS Institute INC., Cary, NC, USA) Statistical significance was defined as a two-tailed P-value <0.05.
3. Ethics statement
he Institutional Review Board (IRB) of Cheongju University approved the study protocol (IRB No. 1041107-202206-HR-007-01) and waived the requirement for informed consent because anonymized national health insurance data were used.
Go to :
RESULTS
1. Time series changes in prescription volumes and pharmaceutical costs from 2010 to 2021
The total number of prescriptions for gastric acid secretion inhibitors in 2010 was 1,343 million, which increased by 1.7-fold to 2,250 million in 2018; in terms of pharmaceutical costs, it increased 2.1 times from 377.4 billion won in 2010 to 807.1 billion won in 2018. However, as ranitidine was banned from prescription in September 2019, the total prescriptions fell by 28.2% to 1,615 million in 2020, from 2,250 million in 2018; however, the pharmaceutical cost was 792.9 billion won, a decrease of only 5.2% compared to that in 2018. The prescription amount in the gastric acid secretion inhibitor market has plummeted, and the increase in drug costs has slowed significantly (Table 1, Figure 1).
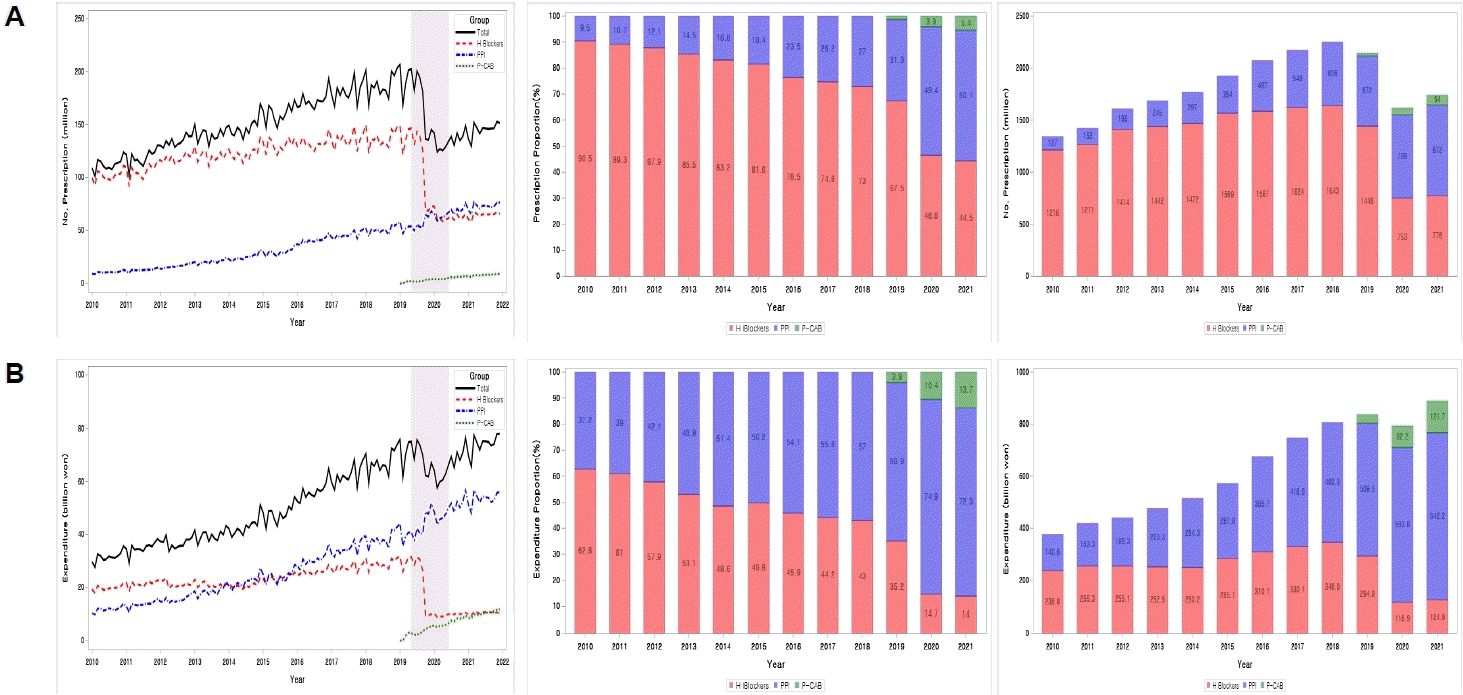 | Fig. 1.Changes in prescription volume and pharmaceutical expenditures in gastric acid secretion inhibitors from 2010 to 2021. (A) Prescriptions. (B) Expenditure. P-CAB, potassium-competitive acid blockers; PPI, proton pump inhibitors.
|
Table 1.
Changes in prescription volume and pharmaceutical expenditures in gastric acid secretion inhibitors from 2010 to 2021
![]()
2. Time series changes in market shares among H2 blockers, PPIs, and P-CABs from 2010 to 2021
In 2010, H2 blockers had a market share of 90.5% based on prescription volume and 62.8% based on drug cost, and PPI had a market share of 9.5% and 37.2%, respectively. However, PPIs increased their market share every year until they hit 27% in terms of prescription volume and 57% in terms of drug costs in 2018; and the market share of H2 blockers, which previously dominated the market, declined to 73% and 43%, respectively. This trend accelerated since ranitidine was withdrawn from the market in September 2019. In 2021, PPIs had a market share of 50.1% based on prescription volume and 72.3% based on drug cost, and H2 blockers had shrunk to 44.5% and 14.0%, respectively. In addition, P-CABs, which were launched in 2019, are increasing their market share every year, with market shares of 5.4% and 13.7% in 2021, respectively (Table 1, Figure 1).
3. Time-series changes in ranitidine prescription volume and its expenditures
In 2010, the most commonly prescribed gastric acid secretion inhibitors were cimetidine (38.3%) and ranitidine (38.9%). Pharmaceutical expenditure accounted for 6.6% and 45.9%, respectively. Ranitidine expanded its market share every year until it was banned from sale in 2019, and in 2018, it occupied 49.8% of the prescription volume and 35.6% of the pharmaceutical cost. However, cimetidine gradually lost its market share by 12.1% in 2018; even after the ranitidine prescription ban in 2019, cimetidine's market share continued to decline, dropping to 4.1% in 2021 (Table 1).
4. Ranitidine withdrawal effects on H2 blockers and all gastric acid secretion inhibitor market
Figure 2 shows how the prescription share within the H2 blocker group changed after the ban on ranitidine prescriptions. Ranitidine has been replaced by famotidine and lafutidine. However, the prescribed amount of ranitidine was not absorbed to 100% (Table 2).
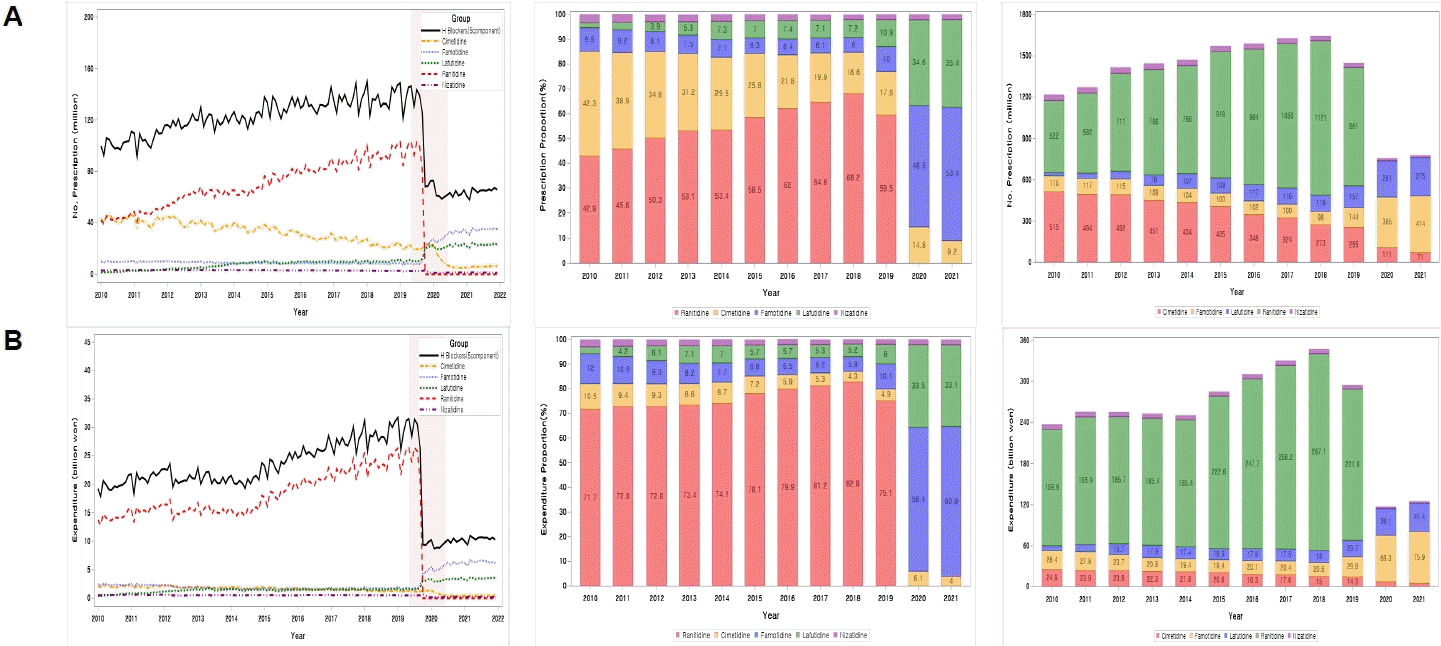 | Fig. 2.Changes in prescription volume and pharmaceutical expenditures in H2 blockers from 2010 to 2021. (A) Prescriptions. (B) Expenditure.
|
Table 2.
Ranitidine withdrawal effects on gastric acid secretion inhibitor market
| 2018 |
2021 |
2018 vs. 2021 proportion difference %p (times) |
P-valueb (pre vs. post) | ||||||||
|---|---|---|---|---|---|---|---|---|---|---|---|
| Observations | Predicted valuea |
95% prediction intervala |
Difference value (O-P) | Crude analysis | Time adjusted analysis | ||||||
| Lower | Upper | ||||||||||
| The number of prescriptions (million) | |||||||||||
| Total | 2,250 (100.0) | 1,648 (100.0) | 2,434 (100.0) | 2,040 | 2,827 | -1,365 | <0.0001 | ||||
| H2 blockers | 1,643 (73.0) | 776 (47.1) | 1,784 (73.3) | 1,546 | 2,022 | -1,008 | -26.0 (0.6) | 0.3 (1.0) | <0.0001 | ||
| Cimetidine | 273 (12.1) | 71 (4.3) | 199 (8.2) | 132 | 265 | -128 | -7.8 (0.4) | -4.0 (0.7) | 0.4318 | ||
| Famotidine | 98 (4.4) | 414 (25.1) | 91 (3.8) | 79 | 104 | 323 | 20.8 (5.8) | -0.6 (0.9) | <0.0001 | ||
| Lafutidine | 119(5.3) | 275 (16.7) | 137 (5.6) | 99 | 176 | 137 | 11.4 (3.2) | 0.4 (1.1) | <0.0001 | ||
| Ranitidine | 1,121 (49.8) | - | 1,327 (54.5) | 1,213 | 1,442 | -1,327 | -49.8 (-) | 4.7 (1.1) | <0.0001 | ||
| Nizatidine | 32 (1.4) | 16 (1.0) | 29 (1.2) | 24 | 35 | -13 | -0.5 (0.7) | -0.2 (0.9) | 0.0003 | ||
| PPI | 606 (27.0) | 872 (52.9) | 649 (26.7) | 494 | 805 | 223 | 26.0 (2.0) | -0.3 (1.0) | <0.0001 | ||
| Total expenditure (billion won) | |||||||||||
| Total | 807.1 (100.0) | 767.1 (100.0) | 907.5 (100.0) | 774.0 | 1,041.0 | -140.4 | <0.0001 | ||||
| H2 blockers | 346.9 (43.0) | 124.9 (16.3) | 355.2 (39.1) | 287.4 | 423.0 | -230.4 | -26.7 (0.4) | -3.8 (0.9) | <0.0001 | ||
| Cimetidine | 15.0 (1.9) | 5.1 (0.7) | 12.3 (1.4) | 9.0 | 15.5 | -7.2 | -1.2 (0.4) | -0.5 (0.7) | 0.3627 | ||
| Famotidine | 20.6 (2.6) | 75.9 (9.9) | 22.7 (2.5) | 17.0 | 28.4 | 53.2 | 7.3 (3.9) | 0.0 (1.0) | <0.0001 | ||
| Lafutidine | 18.0 (2.2) | 41.4 (5.4) | 20.9 (2.3) | 14.6 | 27.2 | 20.5 | 3.2 (2.4) | 0.1 (1.0) | <0.0001 | ||
| Ranitidine | 287.1 (35.6) | - | 293.5 (32.3) | 241.8 | 345.1 | -293.5 | -35.6 (-) | -3.2 (0.9) | <0.0001 | ||
| Nizatidine | 6.2 (0.8) | 2.5 (0.3) | 5.9 (0.7) | 5.0 | 6.8 | -3.4 | -0.4 (0.4) | -0.1 (0.9) | 0.0002 | ||
| PPI | 460.3 (57.0) | 642.2 (83.7) | 552.3 (60.9) | 486.6 | 618.0 | 89.9 | 26.7 (1.5) | 3.8 (1.1) | 0.6368 | ||
![]()
Table 2 shows the estimated and actual prescription volumes and pharmaceutical costs for each drug in 2021 if the market share followed the time series trend from 2010 to 2019, assuming that ranitidine has not been withdrawn from the market. Overall, the predicted prescription amount for the entire gastric acid secretion inhibitor market in 2021 was 2,434 million; however, the actual prescription amount was 1,648 million, a 32.3% decrease. In terms of pharmaceutical expenditures, the difference between predicted costs (907.5 billion won; 95% prediction interval: 774.0, 1041.0) and actual costs (767.1) was 140 billion won, a 15.5% cost reduction.
Famotidine, lafutidine, and PPIs showed positive trends, which means that they absorbed much of the former ranitidine prescription volume. Famotidine’s relative increase was 323 million, followed by PPIs (223 million) and lafutidine (137 million). Regarding pharmaceutical expenditures, PPIs are estimated to show the largest increase, as high as 89.9 billion won, followed by famotidine (53.2 billion won) and lafutidine (20.5 billion won). These results were statistically significant (P<0.0001). However, cimetidine and nizatidine had little effect on the prescription-shifting effect of ranitidine and decreased faster than expected.
Ranitidine prescription-shifting effects according to the type of medical institution. It was estimated that the prescription volume of ranitidine had shifted to famotidine, lafutidine, and PPIs. However, the proportions were different for each type of medical institution. In tertiary and general hospitals, the prescribed amount increased in the order of famotidine, lafutidine, and PPIs, and in hospitals and clinics, the prescriptions increased in the order of famotidine, PPIs, and lafutidine. We confirmed that all medical institutions decreased the prescription of cimetidine and nizatidine (Table 3).
Table 3.
Ranitidine withdrawal effects on gastric acid secretion inhibitor market according to the type of medical institutions
| 2018 |
2021 |
2018 vs. 2021 proportion difference %p (times) |
P-valueb (pre vs. post) | |||||||||
|---|---|---|---|---|---|---|---|---|---|---|---|---|
| Observations | Predicted valuea |
95% prediction intervala |
Difference value (O-P) | Crude analysis | Time adjusted analysis | |||||||
| Lower | Upper | |||||||||||
| Tertiary hospitals | ||||||||||||
| The number of prescriptions (million) | ||||||||||||
| Total | 229 (100.0) | 230 (100.0) | 267 (100.0) | 218 | 316 | -36 | <0.0001 | |||||
| H2 blockers | 132 (57.7) | 99 (43.0) | 148 (55.5) | 115 | 181 | -49 | -14.7 (0.7) | -2.2 (1.0) | <0.0001 | |||
| Cimetidine | 6 (2.8) | 1 (0.6) | 6 (2.2) | 4 | 8 | -4 | -2.2 (0.2) | -0.6 (0.8) | 0.5307 | |||
| Famotidine | 20 (8.8) | 52 (22.7) | 23 (8.6) | 19 | 27 | 30 | 14.0 (2.6) | -0.2 (1.0) | <0.0001 | |||
| Lafutidine | 22 (9.8) | 45 (19.5) | 29 (10.9) | 22 | 36 | 16 | 9.7 (2.0) | 1.2 (1.1) | <0.0001 | |||
| Ranitidine | 83 (36.0) | - | 90 (33.6) | 71 | 109 | -90 | -36.0 (-) | -2.4 (0.9) | - | |||
| Nizatidine | 1 (0.3) | 0.4 (0.2) | 0.6 (0.2) | 0.04 | 1 | -0.2 | -0.2 (0.5) | -0.1 (0.7) | 0.3033 | |||
| PPI | 97 (42.3) | 131 (57.0) | 119 (44.5) | 102 | 135 | 13 | 14.7 (1.3) | 2.2 (1.1) | 0.0272 | |||
| Total expenditure (billion won) | ||||||||||||
| Total | 104.4 (100.0) | 113.9 (100.0) | 123.1 (100.0) | 106.1 | 140.1 | -9.2 | 0.0215 | |||||
| H2 blockers | 31.9 (30.5) | 19.3 (17.0) | 34.5 (28.0) | 26.4 | 42.6 | -15.2 | -13.6 (0.6) | -2.5 (0.9) | <0.0001 | |||
| Cimetidine | 0.4 (0.4) | 0.1 (0.1) | 0.4 (0.3) | 0.3 | 0.5 | -0.3 | -0.3 (0.3) | -0.1 (0.8) | 0.9794 | |||
| Famotidine | 6.0 (5.7) | 12.5 (11.0) | 7.2 (5.8) | 5.5 | 8.9 | 5.4 | 5.3 (1.9) | 0.1 (1.0) | <0.0001 | |||
| Lafutidine | 3.3 (3.2) | 6.6 (5.8) | 4.4 (3.6) | 2.6 | 6.2 | 2.2 | 2.6 (1.8) | 0.4 (1.1) | 0.0011 | |||
| Ranitidine | 22.1 (21.2) | - | 22.5 (18.2) | 18.1 | 26.8 | 22.5 | -21.2 (-) | -2.9 (0.9) | - | |||
| Nizatidine | 0.1 (0.1) | 0.1 (0.0) | 0.1 (0.1) | 0 | 0.2 | 0 | -0.1 (0.5) | 0.0 (0.7) | 0.1724 | |||
| PPI | 72.5 (69.5) | 94.6 (83.0) | 88.6 (72.0) | 79.7 | 97.5 | 6.0 | 13.6 (1.2) | 2.5 (1.0) | 0.5448 | |||
| General hospitals | ||||||||||||
| The number of prescriptions (million) | ||||||||||||
| Total | 462 (100.0) | 374 (100.0) | 494 (100.0) | 398 | 589 | -120 | <0.0001 | |||||
| H2 blockers | 284 (61.5) | 142 (37.9) | 292 (59.2) | 237 | 347 | -150 | -23.6 (0.6) | -2.3 (1.0) | <0.0001 | |||
| Cimetidine | 18 (3.8) | 4 (1.0) | 15 (3.1) | 10 | 20 | -11 | -2.8 (0.3) | -0.8 (0.8) | 0.8642 | |||
| Famotidine | 20 (4.4) | 59 (15.8) | 22 (4.4) | 19 | 25 | 37 | 11.4 (3.6) | 0.0 (1.0) | <0.0001 | |||
| Lafu lidine | 34 (7.3) | 76 (20.3) | 41 (8.3) | 31 | 50 | 35 | 13.0 (2.8) | 1.0 (1.1) | <0.0001 | |||
| Ranitidine | 209 (45.2) | - | 211 (42.7) | 174 | 247 | -211 | -45.2 (-) | -2.5 (0.9) | <0.0001 | |||
| Nizatidine | 4 (0.9) | 3 (0.8) | 4 (0.8) | 3 | 5 | -1 | -0.1 (0.9) | -0.1 (0.9) | 0.0089 | |||
| PPI | 178 (38.5) | 232 (62.1) | 202 (40.8) | 161 | 242 | 30 | 23.6 (1.6) | 2.3 (1.1) | <0.0001 | |||
| Total expenditure (billion won) | ||||||||||||
| Total | 202.4 (100.0) | 199.1 (100.0) | 237.2 (100.0) | 207.2 | 267.1 | -38.1 | <0.0001 | |||||
| H2 blockers | 67.7 (33.5) | 27.8 (13.9) | 73.1 (30.8) | 61.2 | 85.0 | -45.4 | -19.5 (0.4) | -2.6 (0.9) | <0.0001 | |||
| Cimetidine | 1.2 (0.6) | 0.5 (0.2) | 1.1 (0.5) | 0.8 | 1.4 | -0.6 | -0.3 (0.4) | -0.1 (0.8) | 0.686 | |||
| Famotidine | 6.6 (3.2) | 15.8 (7.9) | 8.0 (3.4) | 6.4 | 9.6 | 7.8 | 4.7 (2.4) | 0.1 (1.0) | <0.0001 | |||
| Lafutidine | 4.9 (2.4) | 11.1 (5.6) | 6.1 (2.6) | 3.3 | 8.8 | 5.0 | 3.1 (2.3) | 0.1 (1.1) | 0.0576 | |||
| Ranitidine | 54.5 (26.9) | - | 57.5 (24.2) | 50.4 | 64.6 | -57.5 | -26.9 (-) | -2.7 (0.9) | <0.0001 | |||
| Nizatidine | 0.6 (0.3) | 0.4 (0.2) | 0.6 (0.2) | 0.4 | 0.7 | -0.2 | -0.1 (0.7) | -0.1 (0.8) | 0.0083 | |||
| PPI | 134.7 (66.5) | 171.3 (86.1) | 164.0 (69.2) | 146.0 | 182.0 | 7.3 | 19.5 (1.3) | 2.6 (1.0) | 0.8225 | |||
| Hospitals | ||||||||||||
| The number of prescriptions (million) | ||||||||||||
| Total | 300 (100.0) | 168 (100.0) | 316 (100.0) | 253 | 379 | -148 | <0.0001 | |||||
| H2 blockers | 233 (77.7) | 69 (41.4) | 232 (73.3) | 178 | 285 | -162 | -36.3 (0.5) | -4.4 (0.9) | <0.0001 | |||
| Cimetidine | 23 (7.5) | 5 (2.8) | 16 (5.1) | 12 | 21 | -11 | -4.7 (0.4) | -2.4 (0.7) | 0.5031 | |||
| Famotidine | 5 (1.6) | 45 (27.1) | 4 (1.3) | 2 | 6 | 41 | 25.4 (16.8) | -0.3 (0.8) | <0.0001 | |||
| Lafutidine | 7 (2.4) | 18 (10.7) | 8 (2.4) | 5 | 10 | 10 | 8.3 (4.5) | 0.0 (1.0) | <0.0001 | |||
| Ranitidine | 195 (65.1) | - | 201 (63.6) | 157 | 245 | 201 | -65.1 (-) | -1.5 (1.0) | <0.0001 | |||
| Nizatidine | 3 (1.0) | 1 (0.7) | 3 (0.9) | 2 | 4 | -2 | -0.3 (0.7) | -0.1 (0.9) | 0.0021 | |||
| PPI | 67 (22.3) | 98 (58.6) | 84 (26.7) | 75 | 94 | 14 | 36.3 (2.6) | 4.4 (1.2) | <0.0001 | |||
| Total expenditure (billion won) | ||||||||||||
| Total | 108.1 (100.0) | 84.5 (100.0) | 126.8 (100.0) | 111.6 | 142.0 | -42.3 | <0.0001 | |||||
| H2 blockers | 56.4 (52.1) | 84.5 (100.0) | 64.1 (50.5) | 56.1 | 72.1 | 20.4 | 47.9 (1.9) | -1.6 (1.0) | <0.0001 | |||
| Cimetidine | 1.5 (1.4) | 0.6 (0.7) | 1.3 (1.0) | 1.0 | 1.5 | -0.7 | -0.7 (0.5) | -0.4 (0.7) | 0.3615 | |||
| Famotidine | 0.9 (0.9) | 9.2 (10.8) | 1.2 (1.0) | 0.5 | 2.0 | 7.9 | 10.0 (12.5) | 0.1 (1.1) | <0.0001 | |||
| Lafutidine | 1.1 (1.0) | 2.7 (3.2) | 1.1 (0.9) | 0.8 | 1.5 | 1.6 | 2.2 (3.2) | -0.1 (0.9) | 0.0135 | |||
| Ranitidine | 52.2 (48.3) | - | 59.9 (47.2) | 53.5 | 66.3 | -59.9 | -48.3 (-) | -1.0 (1.0) | <0.0001 | |||
| Nizatidine | 0.7 (0.6) | 71.8 (85.0) | 0.6 (0.4) | 0.3 | 0.8 | 71.3 | 84.4 (139.7) | -0.2 (0.7) | 0.0003 | |||
| PPI | 51.8 (47.9) | 0.2 (0.2) | 62.7 (49.5) | 55.5 | 69.9 | -62.5 | -47.6 (0.0) | 1.6 (1.0) | 0.0077 | |||
| Local clinics | ||||||||||||
| The number of prescriptions (million) | ||||||||||||
| Total | 1,212 (100.0) | 810 (100.0) | 1,295 (100.0) | 1,066 | 1,524 | -485 | <0.0001 | |||||
| H2 blockers | 953 (78.7) | 416 (51.4) | 977 (75.5) | 790 | 1,165 | -561 | -27.2 (0.7) | -3.2 (1.0) | <0.0001 | |||
| Cimetidine | 219 (18.0) | 54 (6.7) | 158 (12.2) | 94 | 223 | -104 | -11.4 (0.4) | -5.8 (0.7) | 0.1869 | |||
| Famotidine | 51 (4.2) | 219 (27.1) | 44 (3.4) | 37 | 51 | 175 | 22.9 (6.5) | -0.8 (0.8) | <0.0001 | |||
| Lafutidine | 55 (4.5) | 132 (16.3) | 57 (4.4) | 36 | 77 | 75 | 11.8 (3.6) | -0.1 (1.0) | <0.0001 | |||
| Ranitidine | 606 (50.0) | - | 697 (53.8) | 606 | 787 | -697 | -50.0 (-) | 3.8 (1.1) | <0.0001 | |||
| Nizatidine | 23 (1.9) | 11 (1.3) | 22 (1.7) | 16 | 27 | -11 | -0.6 (0.7) | -0.2 (0.9) | 0.0002 | |||
| PPI | 259 (21.3) | 393 (48.6) | 317 (24.5) | 276 | 359 | 76 | 27.2 (2.3) | 3.2 (1.1) | 0.0001 | |||
| Total expenditure (billion won) | ||||||||||||
| Total | 380.0 (100.0) | 354.2 (100.0) | 398.9 (100.0) | 309.0 | 488.8 | -44.7 | <0.0001 | |||||
| H2 blockers | 182.8 (48.1) | 60.4 (17.0) | 172.7 (43.3) | 121.2 | 224.3 | -112.3 | -31.0 (0.4) | -4.8 (0.9) | <0.0001 | |||
| Cimetidine | 11.6 (3.0) | 3.3 (0.9) | 9.1 (2.3) | 5.9 | 12.3 | -5.9 | -2.1 (0.3) | -0.8 (0.8) | 0.2226 | |||
| Famotidine | 6.8 (1.8) | 35.0 (9.9) | 5.9 (1.5) | 3.4 | 8.3 | 29.1 | 8.1 (5.5) | -0.3 (0.8) | <0.0001 | |||
| Lafutidine | 8.5 (2.2) | 20.3 (5.7) | 10.1 (2.5) | 8.0 | 12.2 | 10.3 | 3.5 (2.6) | 0.3 (1.1) | <0.0001 | |||
| Ranitidine | 151.4 (39.8) | - | 143.2 (35.9) | 100.1 | 186.3 | -143.2 | -39.8 (-) | -3.9 (0.9) | <0.0001 | |||
| Nizatidine | 4.5 (1.2) | 1.8 (0.5) | 4.4 (1.1) | 3.8 | 5.1 | -2.6 | -0.7 (0.4) | -0.1 (0.9) | 0.0001 | |||
| PPI | 197.2 (51.9) | 293.8 (83.0) | 226.2 (56.7) | 187.9 | 264.5 | 67.7 | 31.0 (1.6) | 4.8 (1.1) | 0.4732 | |||
![]()
Go to :
DISCUSSION
This study has great significance as it examined how the drug market was reorganized after ranitidine, which had the largest market share, disappeared from the market. To the best of our knowledge, this is the first study on the impact of ranitidine withdrawal on the gastric acid secretion inhibitor market. This study confirmed that the market share expansion of PPIs accelerated due to the withdrawal of ranitidine. The ranitidine prescription was partially transferred to the same H2 blockers such as famotidine and lafutidine, and there was also a significant transfer to PPIs.
When ranitidine was banned, many people wondered how much of the ranitidine prescription would be taken over by H2 blockers, PPIs, or P-CABs. If we simply compare the prescription volume and pharmaceutical expenditures of gastric acid secretion inhibitors in 2018, the year before the ranitidine prescription ban, to those in 2021, the most recent year, famotidine, lafutidine, and PPIs seem to have absorbed the decrease in ranitidine prescriptions, and P-CABs, newly introduced in 2019, seem to have expanded the market. However, this simple comparative analysis does not reflect the time trends. Therefore, we developed and compared a time series autoregressive model that reflected the prescription volume trend of each drug from 2010 to 2021. In other words, if ranitidine remained in the market without being withdrawn and was prescribed according to the previous trend, it was possible to estimate the predicted prescription amount for each drug in 2021. The difference between this predicted value and the actual value could be defined as an additional prescription volume owing to the withdrawal of ranitidine. Thus, famotidine, lafutidine, and PPIs absorbed the prescribed dose of ranitidine, which was statistically significant. Although the time series autoregressive model enables more sophisticated analysis compared to the simple comparative analysis method, we should exclude the P-CAB effect from the modeling. If P-CABs are included in the analysis model, the increase in the amount will be overestimated because P-CABs have been prescribed since 2019. In addition, the model assumption should reflect the time trend from 2010; however, since this is not the case, P-CABs are excluded from the analysis model. Therefore, in the case of P-CABs, only the results of a simple comparative analysis between 2018 and 2021 can be presented.
As a result, famotidine's increased prescription volume compared to the predicted volume was estimated to be 323 million, that of PPIs was 223 million, and that of lafutidine was 137 million. In other words, it was confirmed that a portion of the ranitidine prescription volume was absorbed by H2 blockers; however, a portion was transferred to the PPI. Theoretically, because ranitidine is an H2 blocker, it may be desirable to replace it with another drug in the same group when it is banned. Moreover, from an economic point of view, since drugs belonging to PPIs are more expensive than H2 blockers, there is a possibility that the patient's co-payment and health insurance expenses will increase. In our study, how much additional financial burden was caused by such over-prescriptions? PPIs were 89.9 billion won, famotidine at 53.2 billion won, and lafutidine at 20.5 billion won. Famotidine and lafutidine are the same class of H2 blockers; therefore, even if it is an unavoidable choice, the amount of prescription change to PPIs is a matter to be considered. Although there are various reasons for the prescription change, it may not be desirable for a significant portion of the ranitidine prescription volume to be changed to PPIs. A comparative study is needed to determine whether this phenomenon occurred only in Korea or in other major advanced countries also.
This study had some limitations. First, this study estimated the ranitidine ban effect through a trend analysis. Therefore, we could not define the specific cause of the increase or decrease in drug prescriptions. For example, the predicted prescription amount for cimetidine differed significantly from the actual prescription amount. The main reason is that cimetidine was naturally withdrawn from the market, and this decrease was larger than that predicted by the statistical model. Second, P-CABs are rapidly expanding their market share, but our research model did not analyze their effects. This is because they entered the market in 2019, and because of the short period, overestimation may have occurred if they were included in the analysis. It will take several more years to analyze the market-entry effect of P-CABs. Nevertheless, this study presented important results in the absence of reliable studies on the withdrawal effect of ranitidine.
In conclusion, we suggest that further studies should be carried out on this subject matters. This study evaluated only the short-term effects of ranitidine withdrawal. It will be necessary to explore long-term trends, patterns of market changes, and factors affecting market share. It is needed to identify why prescription patterns differ according to the type of healthcare organization, such as tertiary hospitals, hospitals, and local clinics.
Go to :
 XML Download