Journal List > Endocrinol Metab > v.37(6) > 1516080399

Kwon, Park, Park, Cho, Lee, Lee, and Kim: Aldosterone Immunoassay-Specific Cutoff Value for Seated Saline Suppression Test for Diagnosing Primary Aldosteronism

Abstract

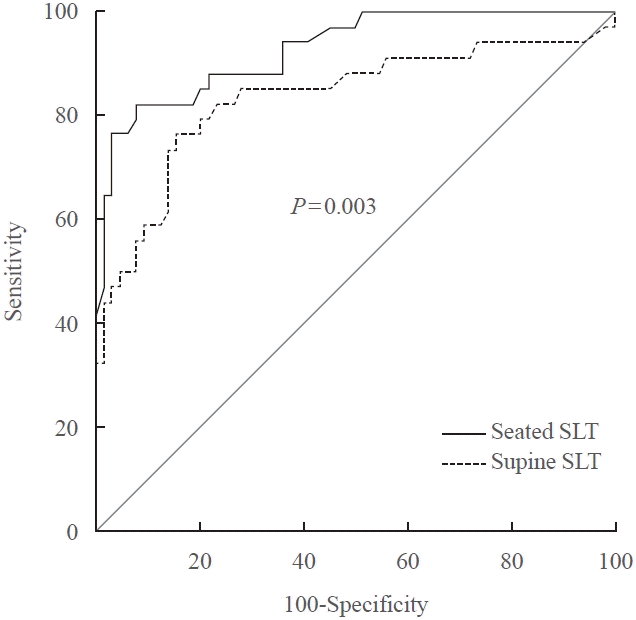
A seated saline loading test (SLT) using liquid chromatography-tandem mass spectrometry (LC-MS/MS) is one of the most accepted confirmatory tests of primary aldosteronism. However, LC-MS/MS is time-consuming and is not widely available in diagnostic laboratories compared to immunoassay. With immunoassay, it is unknown whether SLT in the seated position is more accurate than that of the supine position, and a cutoff value of post-seated SLT plasma aldosterone concentration (PAC) must be established in the Korean population. Ninety-eight patients underwent SLT in both positions, and post-SLT PAC was measured by LC-MS/MS and radioimmunoassay. We confirmed primary aldosteronism if post-seated SLT PAC by LC-MS/MS exceeded 5.8 ng/dL. The area under the receiver operating characteristic curve was greater for seated than supine SLT (0.928 vs. 0.834, P=0.003). The optimal cutoff value of post-seated SLT by radioimmunoassay was 6.6 ng/dL (sensitivity 83.3%, specificity 92.2%).

INTRODUCTION

Primary aldosteronism (PA) is the most prevalent endocrine etiology of secondary hypertension [1,2] and is associated with a higher risk of cardiovascular and renal complications [3,4]. Treatment with mineralocorticoid receptor antagonists or surgical intervention is efficient in reducing these morbidities [1,5,6]. Thus, implementing a trustworthy diagnostic test for PA is crucial.
Saline loading test (SLT) is the most utilized diagnostic test for PA and is highly accurate, particularly in the sitting compared to the traditional supine position [7]. Following SLT, plasma aldosterone concentration (PAC) is quantified by either immunoassay or liquid chromatography-tandem mass spectrometry (LC-MS/MS). Recent studies evaluated the diagnostic performance of seated SLT using immunoassay and LC-MS/MS, finding that immunoassay has a lesser degree of specificity than LC-MS/MS [7,8]. Furthermore, immunoassay has performance variability among different laboratories compared to LC-MS/MS [7-9]. However, LC-MS/MS is more time-consuming and is not commonly accessible in most laboratories [10,11]. Since the diagnostic accuracy of seated SLT and the PAC cutoff measured by immunoassay for Korean populations have not been determined [8,12], we aimed to evaluate the diagnostic performances and the cutoff value of both supine and seated SLT assessed by radioimmunoassay (RIA).

METHODS

We retrospectively reviewed data from patients who underwent screening and confirmatory tests for PA from January 2018 through November 2021 at Samsung Medical Center (Supplemental Fig. S1 ). A total of 253 patients was screened, and 143 patients who were positive for screening test using RIA (plasma renin activity <1.0 ng/mL/hr and PAC ≥15.0 ng/dL, or aldosterone/renin ratio [ARR] ≥20.0 ng/dL per ng/mL/hr) were hospitalized for SLT and adrenal vein sampling (AVS). When these patients were admitted, there was no Korean data on the RIA cutoff of seated SLT. Although we confirmed PA by seated SLT using LC-MS/MS (PAC >5.8 ng/dL) [7], LC-MS/MS assay was time-consuming and yielded no result during the hospital stay. Therefore, all patients underwent both supine and seated SLTs on different days, and a positive result of supine SLT (PAC >5 ng/dL) was used as the criterion for performing AVS.
After administrating 2 L of intravenous normal saline over 4 hours, PAC was measured using LC-MS/MS (only after seated SLT; reference range of 0 to 30.0 ng/dL, and the inter- and intra-assay coefficients of variations [CVs] were below 7.0%), and RIA (after seated and supine SLT; by Beckman Coulter analyzer [Beckman Coulter, Brea, CA, USA] with reference range of 4.1 to 33.5 ng/dL, and the inter-assay CVs of 10.2% at PAC 20.5 ng/dL and 8.1% at 43.2 ng/dL and the intra-assay CVs of 8.6% at 21.3 ng/dL and 4.5% at 43 ng/dL). Among hospitalized patients, 35 and 10 patients did not undergo supine and seated SLT, respectively. Thus, 98 patients were included in the final analysis.
An independent t test and the chi-square test were used to compare the data between PA-confirmed and PA-excluded groups. A paired t test was used to compare PAC by LC-MS/MS and RIA. The Pearson correlation and Bland-Altman analysis assessed the correlation and agreement between PAC by LC-MS/MS and RIA. The diagnostic performances and optimal cutoff values of seated and supine SLT were evaluated using the receiver operating characteristic (ROC) curves and Youden’s index method. Analyses were performed using MedCalc 20 (MedCalc Software, Ostend, Belgium).
The study protocol was approved by the Institutional Review Board (IRB) of Samsung Medical Center. The need for informed consent was waived (IRB No. 2022-05-084) because the study was retrospective and analyzed de-identified data.

RESULTS

The PA-confirmed group (n=34) showed higher baseline PAC, ARR, and post-SLT PAC with a lower potassium level than the PA-excluded group (n=64) (Table 1). In both groups, the PACs measured by RIA were statistically higher than that of LC-MS/MS (17% higher in the PA-confirmed group, P<0.001; 29% higher in the PA-excluded group, P=0.007).
A strong correlation between PAC by RIA and that by LC-MS/MS was shown, as in Supplemental Fig. S2A (r=0.864, P<0.001), and the linear regression-derived equation between the two assays was y=0.739x+0.849. Bland-Altman analysis demonstrated a mean difference of 2.7 ng/dL (95% confidence interval [CI], –9.1 to 14.4) (Supplemental Fig. S2B).
When the PAC was measured by RIA, the area under the curve (AUC) for seated SLT (0.928; 95% CI, 0.857 to 0.970) was significantly greater than that for supine SLT (0.834; 95% CI, 0.754 to 0.901; P=0.003) (Fig. 1). The Youden index revealed 6.6 ng/dL as the optimal cutoff for seated SLT measured by RIA (sensitivity 83.3%, specificity 92.2%). To assess the most clinically relevant cutoff of seated SLT, we calculated the sensitivities and specificities of different PAC cutoff levels (Supplemental Table S1).
In supine SLT measured by RIA, the Youden index indicated that 5.1 ng/dL was the optimal cutoff (sensitivity 83.3%, specificity 74.3%). Compared to seated SLT, the optimal cutoff of supine SLT showed the same sensitivity (83.3%) but lower specificity (74.3% for supine SLT vs. 92.2% for seated SLT). In this ROC analysis of supine SLT, the traditional cutoff levels of 5.0 and 10.0 ng/dL showed sensitivities of 83.3% and 52.8% and specificities of 72.9% and 91.4%, respectively.

DISCUSSION

In this analysis, PAC measured by RIA and LC-MS/MS showed a strong correlation (r=0.864, P<0.001). In the PA-confirmed group, PAC by RIA demonstrated a 17% higher value than that by LC-MS/MS. Several studies reported that immunoassay might overestimate PAC due to its cross-reactivity with aldosterone metabolites, lowering its specificity [13,14]. Despite this disadvantage, our study demonstrated that RIA could be a reliable alternative (AUC of seated SLT=0.928) when LC-MS/MS is unavailable or when fast results are needed.
In our study, the diagnostic performance of seated SLT was superior to that of supine SLT (AUC 0.928 vs. 0.834, P=0.003). At the PAC cutoff of 6.6 ng/dL after seated SLT, specificity (92.2%) was higher than the optimal cutoff (5.1 ng/dL; specificity 74.3%) of supine SLT. These results are in line with the considerable number of PA patients exhibiting aldosterone response to the upright position, resulting in decreased PAC in the supine position [7].
According to guidelines, post-supine SLT PAC less than 5.0 ng/dL indicates a low probability of PA, PAC greater than 10 ng/dL indicates a very high likelihood of PA, and PAC between 5.0 and 10.0 ng/dL is uncertain [1]. On the other hand, in this study, seated SLT had only a single-point cutoff (6.6 ng/dL). The sensitivity (83.3%) and specificity (92.2%) of this cutoff level of 6.6 ng/dL were not inferior to the sensitivity of the supine SLT cutoff value of 5.0 (83.3%) and specificity of supine SLT cutoff value 10.0 (91.4%).
The limitation of this study is that it was a single-center study with a small number of participants. Since the performance of immunoassays is known to have variability among kits and laboratories [9,15], validation of our study results is required in different settings. However, this study was the first to validate a cutoff value of SLT for the Korean population.
In summary, this study suggests that immunoassay is a reliable alternative analytical method when LC-MS/MS is not available. Compared to supine SLT, a post-seated SLT cutoff of 6.6 ng/dL has enough specificity to avoid unnecessary diagnostic procedures such as AVS or surgical treatment.

Supplementary Material

Supplemental Table S1.

The Sensitivities and Specificities of Different PAC Cutoff Values of Seated Saline Loading Test
enm-2022-1535-suppl1.pdf

Supplemental Fig. S1.

Study flow chart. PA, primary aldosteronism; ARR, aldosterone/renin ratio; RIA, radioimmunoassay; PRA, plasma renin activity; PAC, plasma aldosterone concentration; SLT, saline loading test; LC-MS/MS, liquid chromatography-tandem mass spectrometry.
enm-2022-1535-suppl2.pdf

Supplemental Fig. S2.

(A) Scatter plot between plasma aldosterone concentration (PAC) measured by radioimmunoassay (RIA) and PACs measured by liquid chromatography-tandem mass spectrometry (LC-MS/MS), and linear regression line. (B) Bland-Altman plot of the difference (PAC measured by RIA-PAC measured by LC-MS/MS) against the mean of the PACs measured by the two assays (full line, mean of the difference; dotted lines, 95% upper and lower bounds of the difference). PA, primary aldosteronism.
enm-2022-1535-suppl3.pdf

Notes

CONFLICTS OF INTEREST

No potential conflict of interest relevant to this article was reported.

AUTHOR CONTRIBUTIONS

Conception or design: S.Y.K., J.H.K. Acquisition, analysis, or interpretation of data: S.Y.K., J.P., S.H.P., S.H.C., Y.B.L., S.Y.L. Drafting the work or revising: S.Y.K., J.H.K. Final approval of the manuscript: J.H.K.

REFERENCES

1. Funder JW, Carey RM, Mantero F, Murad MH, Reincke M, Shibata H, et al. The management of primary aldosteronism: case detection, diagnosis, and treatment: an Endocrine Society Clinical Practice Guideline. J Clin Endocrinol Metab. 2016; 101:1889–916.
crossref
2. Kayser SC, Dekkers T, Groenewoud HJ, van der Wilt GJ, Carel Bakx J, van der Wel MC, et al. Study heterogeneity and estimation of prevalence of primary aldosteronism: a systematic review and meta-regression analysis. J Clin Endocrinol Metab. 2016; 101:2826–35.
crossref
3. Monticone S, Sconfienza E, D’Ascenzo F, Buffolo F, Satoh F, Sechi LA, et al. Renal damage in primary aldosteronism: a systematic review and meta-analysis. J Hypertens. 2020; 38:3–12.
4. Wu X, Yu J, Tian H. Cardiovascular risk in primary aldosteronism: a systematic review and meta-analysis. Medicine (Baltimore). 2019; 98:e15985.
5. Catena C, Colussi G, Lapenna R, Nadalini E, Chiuch A, Gianfagna P, et al. Long-term cardiac effects of adrenalectomy or mineralocorticoid antagonists in patients with primary aldosteronism. Hypertension. 2007; 50:911–8.
crossref
6. Hartmann I, Hruska F, Vaclavik J, Kocianova E, Frysak Z, Nesvadbova M, et al. Hypertension outcomes of adrenalectomy for unilateral primary aldosteronism. Endocrine. 2022; 76:142–50.
crossref
7. Stowasser M, Ahmed AH, Cowley D, Wolley M, Guo Z, McWhinney BC, et al. Comparison of seated with recumbent saline suppression testing for the diagnosis of primary aldosteronism. J Clin Endocrinol Metab. 2018; 103:4113–24.
8. Thuzar M, Young K, Ahmed AH, Ward G, Wolley M, Guo Z, et al. Diagnosis of primary aldosteronism by seated saline suppression test-variability between immunoassay and HPLC-MS/MS. J Clin Endocrinol Metab. 2020; 105:dgz150.
9. Burrello J, Monticone S, Buffolo F, Lucchiari M, Tetti M, Rabbia F, et al. Diagnostic accuracy of aldosterone and renin measurement by chemiluminescent immunoassay and radioimmunoassay in primary aldosteronism. J Hypertens. 2016; 34:920–7.
crossref
10. Keevil BG. Novel liquid chromatography tandem mass spectrometry (LC-MS/MS) methods for measuring steroids. Best Pract Res Clin Endocrinol Metab. 2013; 27:663–74.
crossref
11. Taylor PJ, Cooper DP, Gordon RD, Stowasser M. Measurement of aldosterone in human plasma by semiautomated HPLC-tandem mass spectrometry. Clin Chem. 2009; 55:1155–62.
crossref
12. Guo Z, Poglitsch M, McWhinney BC, Ungerer JP, Ahmed AH, Gordon RD, et al. Aldosterone LC-MS/MS assay-specific threshold values in screening and confirmatory testing for primary aldosteronism. J Clin Endocrinol Metab. 2018; 103:3965–73.
crossref
13. Ray JA, Kushnir MM, Palmer J, Sadjadi S, Rockwood AL, Meikle AW. Enhancement of specificity of aldosterone measurement in human serum and plasma using 2D-LC-MS/MS and comparison with commercial immunoassays. J Chromatogr B Analyt Technol Biomed Life Sci. 2014; 970:102–7.
crossref
14. Eisenhofer G, Kurlbaum M, Peitzsch M, Constantinescu G, Remde H, Schulze M, et al. The saline infusion test for primary aldosteronism: implications of immunoassay inaccuracy. J Clin Endocrinol Metab. 2022; 107:e2027–36.
crossref
15. Manolopoulou J, Fischer E, Dietz A, Diederich S, Holmes D, Junnila R, et al. Clinical validation for the aldosterone-to-renin ratio and aldosterone suppression testing using simultaneous fully automated chemiluminescence immunoassays. J Hypertens. 2015; 33:2500–11.
crossref

Fig. 1.
Comparison of receiver operating characteristics curve for the post-seated saline loading test (SLT) plasma aldosterone concentration (PAC; solid line) and the post-supine SLT PAC (dotted line) measured by immunoassay for the diagnosis of primary aldosteronism.
enm-2022-1535f1.tif
Table 1.
Comparison of Characteristics and SLT Results of Cases of PA-Confirmed or Excluded Using Seated SLT
Characteristic PA-confirmed (n=34) PA-excluded (n=64) P value
Age, yr 56±13 58±11 0.524
Male sex 24 (70.6) 28 (43.8) 0.010
BMI, kg/m2 25.9±3.6 25.2±2.9 0.324
SBP, mm Hg 146±22 139±22 0.136
DBP, mm Hg 83±14 81±14 0.465
Potassium, mmol/L 3.9±0.4 4.2±0.6 0.036
Screening test–PAC/PRA/ARR
PAC by LC-MS/MS, ng/dL 15.6 (8.8–29.1) 6.35 (4.4–12.1) <0.001
PAC by RIA, ng/dL 18.6 (11.1–34.7)a 8.9 (6.2–13.3)b <0.001
PRA by LC-MS/MS, ng/mL/hr 0.12 (0.07–0.26) 0.14 (0.08–0.28) 0.566
PRA by RIA, ng/mL/hr 0.10 (0.10–0.20) 0.20 (0.10–0.25) 0.944
ARR by LC-MS/MS, ng/dL per ng/mL/hr 101.9 (55.2–323.9) 50.0 (20.8–86.5) 0.005
ARR by RIA, ng/dL per ng/mL/hr 116.2 (59.5–273.1) 59.6 (38.3–85.5) 0.001
Supine SLT
Post-SLT PAC by RIA, ng/dL 10.7 (7.1–34.0) 3.6 (2.7–5.1) <0.001
Seated SLT
Post-SLT PAC by LC-MS/MS, ng/dL 9.7 (7.9–20.0) 2.9 (1.9–3.7) <0.001
Post-SLT PAC by RIA, ng/dL 11.1 (7.5–15.3) 4.0 (2.5–4.7) <0.001

Values are expressed as mean±standard deviation, number (%), or median (interquartile range). Categorical variables are shown as frequency. P value was calculated using an independent or paired t test for continuous variables and the chi-square test for categorical variables. PA was confirmed or excluded by seated SLT; if the post-SLT PAC measured by LC-MS/MS was greater than 5.8 ng/dL (162 pmol/L), PA was confirmed.

SLT, saline loading test; PA, primary aldosteronism; BMI, body mass index; SBP, systolic blood pressure; DBP, diastolic blood pressure; PAC, plasma aldosterone concentration; PRA, plasma renin activity; ARR, aldosterone/renin ratio; LC-MS/MS, liquid chromatography-tandem mass spectrometry; RIA, radioimmunoassay.

a P value vs. PAC by LC-MS/MS, <0.001;

b P value vs. PAC by LC-MS/MS, 0.007.

TOOLS
Similar articles